- Select a language for the TTS:
- UK English Female
- UK English Male
- US English Female
- US English Male
- Australian Female
- Australian Male
- Language selected: (auto detect) - EN
Play all audios:
ABSTRACT In this study, Pea Peels-Activated Carbon (PPAC), a novel biochar, was created from leftover pea peels (_Pisum sativum_) by wet impregnation with ZnCl2 and subsequent heating to
600, 700, and 800 °C in a CO2 atmosphere. Investigated how the newly acquired biochar affected the capacity to extract the AY11 dye from the aqueous solution. Through the use of FTIR, XRD,
SEM, BJH, BET, DSC, EDX, and TGA studies, the prepared PPAC was identified. It was found that a pH of 2 is optimum for the AY11 dye elimination. The highest removal percentage of AY11 dye
was 99.10% using a beginning AY11 dye concentration of 100 mg/L and a 1.0 g/L dose of PPAC. The highest adsorption capacity (_Q__m_) of the PPAC was 515.46 mg/g. Freundlich (FIM), Halsey
(HIM), Langmuir (LIM), Tempkin (TIM), and Gineralize (GIM) isotherm models were useful in examining the adsorption results. A variety of error functions, including the average percent errors
(APE), root mean square errors (RMS), Marquardt's percent standard deviation (MPSD), hybrid error function (HYBRID), Chi-square error (X2) and a sum of absolute errors (EABS)
equations, were also applied to test the isotherm models data. The PPAC experimental data were best suited by the HIM and FIM isotherm models. Elovich (EM), Pseudo-first-order (PFOM),
Intraparticle diffusion (IPDM), Pseudo-second-order (PSOM), and Film diffusion (FDM) models were applied to study the kinetic adsorption results. The PSOM had a strong correlation
coefficient (_R_2 > 0.99), and it was principally responsible for controlling the adsorption rate. Anions are typically absorbed during the adsorption mechanism of AY11 dye by PPAC owing
to attractive electrostatic forces created with an increase in positively charged areas at acidic pH levels. The regenerated PPAC was used in six successive adsorption/desorption cycles.
This study's outcomes show that PPAC successfully removes the AY11 dye from the aqueous solution; as a result, PPAC can be used repeatedly without experiencing considerable loss in
effectiveness. SIMILAR CONTENT BEING VIEWED BY OTHERS ADSORPTIVE REMOVAL OF MALACHITE GREEN DYE FROM AQUEOUS SOLUTION USING _RUMEX ABYSSINICUS_ DERIVED ACTIVATED CARBON Article Open access
07 September 2023 MANDARIN BIOCHAR-TETA (MBT) PREPARED FROM _CITRUS RETICULATA_ PEELS FOR ADSORPTION OF ACID YELLOW 11 DYE FROM WATER Article Open access 22 October 2022 ISOTHERM AND KINETIC
INVESTIGATIONS OF SAWDUST-BASED BIOCHAR MODIFIED BY AMMONIA TO REMOVE METHYLENE BLUE FROM WATER Article Open access 05 August 2023 INTRODUCTION Anxieties about water shortage continue to
grow in some parts of the world with ongoing pollution of present rivers in diverse locations. Chemical materials that place a heavy load on the aquatic environment can be listed as
pesticides1,2,3, drugs4,5, dyes6,7,8,9,10, hydrocarbons11,12, and heavy metals13,14,15,16,17. These chemicals are introduced into the environment through home sewage or sewage from
industrial and hospital facilities18,19. For example, dyes can be easily identified by their color in wastewater. The most common colors used in leather, paint, textile, and other industries
are synthetic dyes20. This pollution harms both the environmental balance and human health because most paints are poisonous, non-biodegradable, and carcinogenic21,22. An average of
(0.7–2.0) × 105 tons of untreated dyestuffs are thought to be released into water bodies each year23. Because they have the most color variation, are the largest, and are the greatest
adaptable of all synthetic dyes, azo dyes take the top spot. When these substances are used excessively, carcinogenic products are created24. There are numerous methods of dye-house effluent
treatment like coagulation/flocculation25, oxidation with chemical26, biological treatment27, advanced oxidations28,29,30,31, electrochemical treatment32, photo-degradation33,34,35,36 and
adsorption treatment6,8,20,37,38. One of these methods with the highest preference is the adsorption method for dye removal using activated carbon39. However, because commercial activated
carbon is expensive to produce and process, researchers are working to develop less expensive adsorbent materials that are just as effective17,40,41,42. For this reason, biochar
manufacturing is becoming increasingly popular as a less costly and environmentally beneficial substitute. Additionally, biochar produced from biomass and waste products reduces the waste of
finite resources. Biochar is defined as carbonaceous solids produced by gasifying or pyrolyzing biomass at temperatures higher than 300 °C under a nitrogen environment43. Several studies
have demonstrated that biochar derived from the thermochemical conversion of waste materials can adsorb contaminants with high efficiency. In their research, Güzel et al.44 discovered that
marketable activated carbon (AC) production activities are typically more costly than biochar production activities. In addition to being inexpensive, biochar has other benefits, including
lowering secondary environmental pollutants, being renewable, and producing adsorbents with a high added value45. Activated carbons (AC) have more surface functional groups, although
biochars have smaller surface areas and pore volumes46,47. Physical and chemical activation procedures were employed to create activated carbons, which were then used in the treatment of
wastewater46,48,49. In the chemical activation techniques used to produce activated carbons, the raw material is either combined with an acid (H2SO4 and H3PO4)50,51,52, an alkali (K2CO3,
KOH, Na2CO3 or NaOH)53, or earth metal salts (ZnCl2 and AlCl3)54,55,56. In the evaluation of physical activation methods, chemical activation proceeds faster and at a lower temperature.
Higher production of AC than those achieved through physical activation is produced as a result of chemical agents' reduction of tar formation and volatile components processing57.
ZnCl2, a chemical dehydrating agent, considerably increase the carbonization potential of biomass and aid in the improvement of the proper pore structure in activated carbon57,58. The
removal of different contaminants by these adsorbents, which are generated by extracting AC from biomass waste materials, has been the subject of numerous research in the literature. Coconut
husk59, gulmohar60, mandarin peels61, sesame hull62, rice straw63, sugarcane bagasse64, olive stone65, potato66, coffee bean husks67, green algae _Ulva lactuca_68, Macore fruit69,
watermelon peels70, orange peels71, wheat straw72, peanut husk73, tea waste74, red algae _Pterocladia capillacea_75, and are some of this biomass. The novelty of this work is attributed to
using chemical activation methods with ZnCl2 (activation reagent) under CO2 gas for the fabrication of activated carbon (PPAC) at different temperatures and investigating its effects on the
AY11 dye removal from water. In this study, AY11 dye was removed from an aqueous solution by _Pisum sativum_ peels AC as an adsorbent. The outer layer of pea seed pods is called pea peel
trash. In general, after peas are taken out of their seedpods, 35–40% of solid waste is produced76. It is a commonly available and affordable lignocellulosic biomass that has the potential
to be employed as a biomass source for the production of _cellulase. P. sativum_, usually referred to as pea, is a cool-season annual plant of the Leguminosae family grown all over the
world77. According to Pathak et al.76, biomass can be employed to adsorb cationic and anionic contaminants from solutions because of the surface charge on pea peel. Because of their simple
production, easy supply, surface functional groups, and effective treatment, pea peel-based activated carbon is utilized in this investigation. Research on activated carbon made from pea
peels for adsorption applications to remove AY11 dye is scarce. The effectiveness of PPAC, prepared via pyrolysis at high temperature under a flow of CO2 gas after activation with wet ZnCl2,
in removing AY11 dye from wastewater was studied. PPAC is produced from low-cost agricultural waste made from pea _Pisum sativum_ peels. The influence of pH, beginning AY11 dye
concentration, PPAC dosage, and interaction time of PPAC and AY11 dye were investigated as removal conditions for AY11 dye from water. To ascertain the organization of adsorption and its
highest adsorption capacity (_Q_m), the adsorption isotherms of the AY11 dye on PPAC as an adsorbent were also investigated. EXPERIMENTAL DETAILS CHEMICALS AND REAGENTS The starting biomass
Pea (_Pisum sativum_) peels applied for the formation of PPAC in this research were obtained from the local pea peels shop located in Alexandria, Egypt. To remove dust, grime, and other
contaminants, these pea peels were repeatedly washed with distilled water (DW), then let to dry in the sun for a week. Consequently, the Pea peels were milled by a high-speed rotating mill
and separated to size < 200 meshes. The collected Pea peel powder was well-kept in a close-fitting enclosure at room temperature for further treatment. KOH and ZnCl2 were bought from
El-Nasr Company, Egypt. HCl (37%) was procured from Sigma-Aldrich, Germany. Acid Yellow 11 (AY11) dye (C.I.18820) (C16H13N4O4SNa) (Mwt = 380.35 g) supplied by Aldrich was used without any
purifications. AY11 dye solution with a concentration of 1000 mg/L was achieved by using 1 g of AY11 dye and 1000 mL of DW. The stock solution was diluted with DW to get the required
concentrations of working solution that were needed. This work used analytic-grade compounds of all types without additional purification77,78. FABRICATION OF PPAC The powder of pea peels
was mixed with ZnCl2 in a 2:1 ratio in DW and the mixture was dried at 105 °C in an oven. In a horizontal tube furnace, a sequentially dried mixture was transferred to an alumina boat and
heated there for 1 h at 600, 700, and 800 °C in the presence of 100 mL/min a flow rate of CO2 gas. After being removed from the furnace, the carbonized material was refluxed in 2N HCl for
two hours to remove any leftover mineral matter before being repeatedly washed with warm DW to reach the neutral pH for filtrate. The remaining material (PPAC) was dried for 24 h at 105
°C79,80. PPAC CHARACTERIZATION To compute the specific surface area (_S_BET), the total volume of pores, and primary pore size, BET, BJH, MP, and _t_-plot methods were utilized. They were
computed using equipment of BELSORP Mini-II model from BEL Japan utilizing N2 adsorption at 77 K as the adsorption temperature, and 89.62 kPa saturated vapor pressure on the PPAC surface
area per unit mass of the observed samples. The PPAC samples were pre-treated with nitrogen gas flow at 300 °C. The _t_-plot approach was applied to compute the volume of micropores and the
overall volume of pores. The difference between _V_TP and _V_mP calculated the volume of mesopores (_V_MesoP). The average diameter of pores (DAP) was measured by the 4_V_TP/_S_BET ratio.
The functional groups on the PPAC surface were identified using FTIR analysis using a Bruker model Vertex 70 spectrometer attached to a platinum ATR unit, Bruker, Germany examined in a
spectral range of 4000–400 cm–1. Using the SDT650 TA Instrument, thermal studies were carried out between 50 and 900 °C with a 100 mL/min N2 flow. Activated carbons collected for this work
were analyzed for porosity and surface morphology using SEM Quanta 250 FEG equipment with 500 kV HV, 2500–6000 × enlargement, and big Field low vacuum SED (LED)81,82. ADSORPTION EXPERIMENTS
Depending on a preliminary test, the maximum specific surface area of the prepared PPAC (800 °C) was nominated for further evaluation for AY11 dye adsorption capacity via batch equilibrium
investigation. Batch adsorption experiments utilizing AY11 dye solutions with various beginning concentrations were created by diluting the 1000 mg/L feedstock solution with DW. At room
temperature (RT), all adsorption experiments were conducted in a shaking apparatus. 0.1 M NaOH or HCl solutions were used to change the pH values of the solutions. The different solutions
were presented to flasks containing a predefined amount of PPAC at RT (24 ± 2 °C), along with their respective initial concentrations. The impacts of the following variables on the
adsorption of AY11 dye on the PPAC surface were examined: contact period of 0–180 min; pH range of 1–12; dosages of 0.75, 1.0, 1.5, 2.0, and 2.5 g/L of PPAC; and AY11 dye starting
concentrations of 100, 150, 200, 300, and 400 mg/L of feed solution. A spectrophotometer was used to detect the beginning and equilibrium concentrations of the AY11 dye at a wavelength of
λmax 407 nm. At predetermined intervals, the mixture was shaken at 200 rpm, and 0.5 ml of the clear solution was then removed and subjected to UV–Vis absorption spectroscopic analysis. The
experiment was triple-checked, and the reported values are average. The AY11 dye removal percentage (% R) was computed using Eq. (1): $$\%R=\frac{{C}_{0}-{C}_{e}}{{C}_{i}}\times 100$$ (1)
where _C__0_ and _C__e_ are the measured concentrations of AY11 dye (in mg/L) corresponding to the beginning and equilibrium states of removal, respectively. _Q_t (mg/g) is the capacity of
the AY11 dye adsorption at time _t_ (min) on the PPAC can be obtained from Eq. (2): $${Q}_{t}=\frac{\left({C}_{0}-{C}_{t}\right)}{W}\times V$$ (2) where _C_t (mg/L), _W_ (g) and _V_ (L) are
the AY11 dye concentration at time _t_, the weight of PPAC used as adsorbent and the initial volume of feed solution investigated. _Q__e_ (mg/g) is the adsorption capacity for the PPAC at
equilibrium calculated using Eq. (3): $${Q}_{e}=\frac{({C}_{0}-{C}_{e})\times V}{W}$$ (3) After adding PPAC (0.75, 1.0, 1.5, 2.0, and 2.50 g/L), the batch adsorption kinetic studies were
conducted in the identical system with a range of beginning AY11 dye concentrations (100, 150, 200, 300, and 400 mg/L). The residual AY11 dye concentrations were identified at a definite
time interval by spectrophotometer. ISOTHERM MODELS (IMS) INVESTIGATION Experimental results were investigated by five IMs, Langmuir (LIM)83, Freundlich (FIM)84, Tempkin (TIM)85, Generalize
isotherm (GIM)86 and Halsey (HIM)87. The ideal model was chosen using linear regression. The LIM hypothesis proposes that homogenous adsorption takes place on the active sites of the PPAC
surface and that no molecular interactions between the adsorbate would result in the deposition of a single layer on the PPAC surface. The PPAC has maximum restricted adsorption capacity
(_Q_m) and identical active sites. No more adsorption may occur at an active site once the adsorbate occupies it, and adsorbate cannot transmigrate in the PPAC surface plane88. The linear
LIM can be signified in the form of Eq. (4): $$\frac{{C}_{e}}{{Q}_{e}}=\frac{1}{{Q}_{m}\times {K}_{L}}+\frac{{C}_{e}}{{Q}_{m}}$$ (4) where _K__L_ (L/g) is connected to the LIM adsorption
energy constant and _Q__m_ (mg/g) is the maximum adsorption capacity. According to the FIM84, interactions between molecules that have been adsorbed result in the manufacture of
multi-layered adsorption on the adsorbent surface. It is believed that the concentration of adsorbate on the adsorbent surface rises as a function of adsorbate concentration because the FIM
expression is an exponential equation. The FIM can be presented by the linear Eq. (5)6: $$\mathrm{ln}\left({Q}_{e}\right)=\mathrm{ln}\left({K}_{F}\right)+\frac{1}{n}\times
\mathrm{ln}({C}_{e})$$ (5) where _n_ and_ K_F denote FIM constants equivalent to heterogeneity factor and adsorption capacity, respectively. A 1/_n_ ratio less than one implies a normal LIM,
whereas a 1/_n_ value more than one reveals cooperative adsorption. The hypothesis of adsorbate–adsorbate indirect interactions is put forth in the TIM85. According to the TIM theory,
adsorption is categorized by an identical distribution of binding energies up to a maximum binding energy, and as a result of interactions between adsorbents and adsorbates, the heat of
adsorption for every molecule in the layer falls linearly with coverage. TIM can be explained using a simplified linear Eq. (6)88:
$${Q}_{e}=\frac{RT}{b}\mathrm{ln}\left({K}_{T}\right)+\frac{RT}{b}\mathrm{ln}({C}_{e})$$ (6) where _K_T (L/mg) is TIM constant, _R_ (8.314 J/mol K) is the universal gas constant, _b_ (J
g/mol mg) is the energy of adsorption (heat of adsorption) difference factor, and _T_ in _Kelvin_ is the absolute temperature. The GIM explains both multilayer adsorption and the presence of
pore distribution in a heterogeneous form in the adsorbent86. The following form Eq. (7) is where the GIM has frequently been used.
$$\mathrm{log}\left[\frac{{Q}_{m}}{{Q}_{e}}-1\right]=\mathrm{log}{K}_{G}-{N}_{b}\mathrm{log}({C}_{e})$$ (7) where _A_HJ and _B_HJ are isotherms constant, multilayer adsorption heterogeneous
pore distribution. The HIM87 is appropriate for heterosporous solids, and multilayer adsorption89 can be used to match the HIM. The following form Eq. (8) has frequently used the HIM as a
solution: $$\mathrm{ln}\left({Q}_{e}\right)=\left[\left(\frac{1}{{n}_{H}}\right)\mathrm{ln}({K}_{H})\right]+\left(\frac{1}{{n}_{H}}\right)\mathrm{ln}({C}_{e})$$ (8) where _K_H and _n_H are
HIM constants. KINETIC MODELS INVESTIGATION OF AY11 DYE ADSORPTION The adsorption data was then tailored using the previously described kinetic models to reveal the pattern of the kinetics
of adsorption. Equation (9) below describes how Lagergren's pseudo-first-order (PFOM)88,90 is stated. Where _K_1 (g/mg min) is the PFO rate constant.
$$\mathrm{log}\left({Q}_{e}-{Q}_{t}\right)=log{Q}_{e}-\frac{{K}_{1}}{2.303}t$$ (9) The pseudo-second-order model (PSOM)88,91 can be stated as Eq. (10):
$$\frac{t}{{Q}_{t}}=\frac{1}{{K}_{2}{Q}_{e}^{2}}+\frac{t}{{Q}_{e}}$$ (10) where _K_2 (g/mg min) is the PSOM constant. Plotting _t_/_Q_t versus _t_ yields the intercept and slope of the plot,
which were used to calculate the _K__2_ and _Q__e_88. Another kinetic equation based on adsorption capacity is the Elovich kinetic (EM) equation, which is typically stated as Eq. (11)88,92.
$$\frac{{dQ_{t} }}{dt} = \alpha \exp \left( {{-}\beta Q_{t} } \right)$$ (11) where _α_ (mg/g min) is the rate constant of adsorption and _β_ (g/mg) is the constant of desorption throughout
the experiment. It is simplified by supposing _αβt_ > > _t_ and by removing the boundary conditions _Q_t = 0 at _t_ = 0 and _Q_t = _Q_t at _t_ = _t_ Eq. (11) becomes formed as Eq.
(12): $${Q}_{t}=\frac{1}{\beta }\mathrm{ln}\left(\propto \beta \right)+\frac{1}{\beta }\mathrm{ln}(t)$$ (12) To be used as an adsorption rate controller, the plot of _Q_tversus ln(_t_) must
produce a linear correlation with a slope of (1/_β_) and an intercept of (1/_β_) × ln(_αβ_). As a result, the constants may be found using the slope and intercept of the straight line. To
fit the adsorption results, the intra-particle diffusion model (IPDM)88,93 was also applied. Equation (13) is a way to express the IPDM: $${Q}_{t}={K}_{dif}{t}^{0.5}+C$$ (13) where _C_
(mg/g) is a constant revealing the boundary layer thickness, and _K_dif (mg/g min0.5) is the intra-particle diffusion rate constant. When the adsorption process is considerably impacted by
the flow of solute molecules from the water phase to the PPAC phase barrier, the liquid film diffusion model (FDM) Eq. (14)88,94 can be used. $$\mathrm{ln}\left(1-F\right)={K}_{FD}(t)$$ (14)
where _K_FD and _F_ are the FDM rate constant and the equilibrium fractional attainments (_F_ = _Q_t/_Q_e), respectively. AUTHOR STATEMENT FOR THE USE OF PLANTS In this study, Experimental
research and field studies on plant material (Pea _Pisum Sativum_ Peels), including the collection of plant waste material, complies with relevant institutional, national, and international
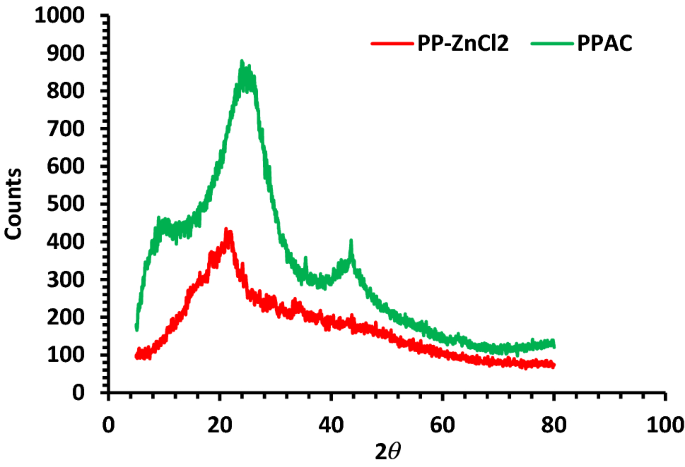
guidelines and legislation. RESULTS AND DISCUSSION PPAC CHARACTERIZATION THE X-RAY DIFFRACTION STUDIES Figure 1 shows the XRD patterns of activated carbon produced by pyrolyzing pea peels
impregnated with ZnCl2 at 800 °C while flowing CO2. A large diffraction band at 2_Ɵ_ = 22° and a tiny strength band at 44° could be seen in the PP-ZnCl2 sample. The PPAC sample's XRD
pattern exposed a little shift in the band from 22° to 25°, demonstrating the existence of an amorphous structure with irregularly arranged carbon rings, which is favorable for establishing
an adsorption gap. Furthermore, the band at 44° changed from being rounded to fairly sharp, showing that PPAC had a more organized structure than PP-ZnCl2 and that the activation procedure
might encourage the development of graphite microcrystallites. The bands between 10° and 20° are ultimately linked to the synthetic activated carbon's presence of micropores and
microcrystallinity60, which may be connected to the multilayer stacks microcrystalline structure that resembles graphite55. FTIR INVESTIGATION Pea peels (_Pisum sativum_) (PP), pea peels
soaked with a 2:1 ratio of ZnCl2 (PP-ZnCl2), and PPAC produced at 800 °C while flowing CO2 were all shown in Fig. 2's FTIR spectra. When the temperature was elevated to 800 °C, OH–
stretching vibration of functional groups disappeared, which explains why broadband formed around 3290 cm–1. An aliphatic CH- stretching vibration may be the cause of a weak band at 2850
cm-1 that was gone at 800 °C. It was shown that the appearance of a very weak band at about 2650 cm–1 after heating at 800 °C corresponds to the presence of stretching (C-H aldehydes). The
emergence of a small peak at a wavelength of 2301–2351 cm–1, which is connected to C–C stretching vibrations in alkyne groups (Fig. 2). The steep band at 1600 cm–1 in the instance of PPAC,
created via heating at 800 °C with a 2:1 ratio of ZnCl2 under CO2 flow, corresponds to C=C skeletal stretching of the aromatic rings. This peak may grow sharper with ZnCl2 under CO2 flow as
due to the breakdown of CH bonds at the greater activation temperature (800 °C) to produce more stable aromatic C=C bonds. The occurrence of a band at 1400 cm–1 can be recognized as C=O, C–O
of COOH groups, or in-plane vibration of OH of COOH groups. With pea peel aromatization at 800 °C as the pyrolysis temperature, this band was completely gone. The large peaks at about
1050–1200 cm–1 relate to the stretching vibration of the C–O group in COOH acids, esters, ethers, phenols, and alcohols. The bands between 700 and 400 cm–1 may be caused by C–C stretching.
Benzene polycyclic, C–H bending, and Si–H stretching vibrations are all potential descriptions for the tiny absorption band at 600 cm–1. Most of the functional group's adsorption band
was gone after the activation process, and other peaks appeared instead. This might be because when heated, the functional groups in the feedstock evaporate as volatile molecules,
demonstrating that the activation process was successful48. SEM INVESTIGATION The SEM pictures of the microstructure of the pea peels, which were heated at diverse temperatures (600, 700,
and 800 °C) while being exposed to CO2 gas for 60 min., are shown in Fig. 3. The peels were soaked with a 2:1 ratio of ZnCl2. The surface of the PPAC was found to have a number of porous and
hollow carbon pores, as shown from SEM pictures acquired during the activation step (700 °C). Since the most volatile organic compounds evolved, the exterior surface of the PPAC has a
porous structure with numerous micropores. In micrographs (~ nm range) taken during studies at carbonization temperatures of 600 and 800 °C, PPAC has a broad outer surface with a very large
number of micropores that serve as pathways for the microporous adsorbent. The diameters of the micropores range from 69.95 to 48.88 nm. The PPAC operations were successful due to the
development of the microporous structure through chemical activation with ZnCl2, and the microporous structure's high specific surface area was similar to the BET value. TGA AND DTA
ANALYSES The Pea peels (_Pisum sativum_) TGA and DTA profiles and their impregnation with samples of ZnCl2 in a 2:1 ratio afford a clear representation of the range of carbonization
temperatures essential to make PPAC. Figure 4 displays the PP TGA and DTA curves as well as the sample impregnated with ZnCl2. There are four stages of deterioration in PP pyrolysis. At
temperatures between 56.46 and 190 °C, a weight loss of 4.15% is seen in the first phase. The discharge of aqueous molecules containing moisture, bound water, and volatile chemicals can be
the root of this mass loss. The depolymerization of hemicelluloses may be the cause of the second step's quick reduction in weight loss (around 44.07% at the temperature range of
192.98–275 °C) (Fig. 4). At temperatures between 275 and 394.09 °C, a progressive mass loss is included in the third stage. However, there was an 18.49% weight reduction, which can be
attributable to the breakdown of cellulose. The dissolution of the lignin unit in PP and the structure recombination and basic carbon skeleton synthesis may have contributed to the minor
downtrend of the last stage and a 14.02% weight loss between 400 and 950 °C62,63,80. Between 192.98 and 394.09 °C, the curve of DTA analysis in Fig. 4a has a substantial double maximum
between 260 and 306.99 °C. This suggests that it was in this temperature range where the PP main breakdown occurred. The pyrolysis procedure for the PP-ZnCl2-activated sample included four
steps, as described in Fig. 4b. The ZnCl2-activated sample lost weight during the first stage at 58.84–130 °C, which the discharge of water may have produced from the biomass. From 178.18 to
745.02 °C, the mass was reduced more slowly in the second and third stages (42.14 and 33.16%, respectively). While this was happening, a sizable percentage of the mass loss was brought on
by the decomposition of the lignocellulose components and the moisture released from the solid-phase ZnCl2. The last stage revealed a mass loss of 5.19% between 745.02 and 950 °C. The total
evaporation of the ZnCl2 liquid phase at a temperature higher than 700 °C was most likely the cause of this. Temperatures higher than 800 °C caused ZnO to change into metallic zinc67,80. The
PP-ZnCl2-activated sample was subjected to differential thermogravimetric analysis (DTA), which revealed that the largest mass loss rate was seen at two fundamental bands at 255 and 588 °C.
PORE STRUCTURE CATEGORIZATIONS The produced PPAC specific surface area was optimized by various techniques (BET, t-Plot, MP, and BJH) (Fig. 5). In Fig. 5a–e, the N2 adsorption–desorption
isotherms of activated carbon generated from PP soaked with 2:1 ZnCl2 are displayed. The carbon was activated at diverse pyrolysis temperatures of 600, 700, and 800 °C for 1 h while under
CO2 gas. As can be seen by comparing the adsorption isotherms of the diverse PPACs in Fig. 5a–e, the different adsorption isotherms of PPACs are classified by the IUPAC as typical Type I
microporous carbons68,75,95. The height of activated carbon's nitrogen adsorption isotherm. It's important to note that at 800 °C activation temperature and CO2 gas, more pores
form in superficially changed activated carbon PPAC (Table 1). AY11 DYE ADSORPTION ON PPAC INFLUENCE OF PH The pHPZC was studied following the method reported in the literature68,75. From
the result shown in Fig. 6a, the point of zero-charge (pHPZC) was estimated to be 5.6. When the pH of the solution was < the pHPZC, the active sites on the biosorbent surface were
positively charged, and when the pH of the solution was > the pHPZC, the active sites on the biosorbent surface were negatively charged. The pH range of textile industry effluents is
extremely large. The pH of the solution considerably influences the amino, carboxyl, and OH– groups on the surface of the biochar, which affects the adsorption procedure. Acid Yellow 11
(AY11) dye equilibrium adsorbed quantity determination and dye elimination were carried out at 25 °C, with a starting AY11 dye concentration of 100 ppm and 1.0 g/L PPAC acting as the
adsorbent. The ability to adsorb the AY11 dye in pH ranges from 1 to 12 was evaluated for 150 min. The pH changes are presented in Fig. 6b, which shows that the highest AY11 dye removal
(99.1%) occurred at pH 2 for AY11 dye adsorption utilizing PPAC. According to the change graph of AY11 dye removal with pH, by increasing the pH from 1 to 2, AY11 dye removal increased from
89.5 to 99.1%. By increasing the pH from 2 to 3, there is a sharp decrease, then a stable state between pH 3 and 4, then a sharp decrease again with the increase of pH from 4 to 9, and
finally a stable state from this point until pH 12. Considering the investigation on the adsorption of azo dyes, according to Song et al.78, the removal of Sunset Yellow dye resulted in a
dramatic drop in adsorption capacity when the pH value was increased from 2 to 4. In their investigation into the adsorption of the dye Direct Yellow 12, Khaled et al.79 discovered that the
removal effectiveness decreased from 98.1 to 11.1% by raising the pH of the water from 1.5 to 11.1. Eleryan et al.6 studied the pH impact on the adsorption of AY 11 dye with Mandarin
Biochar-TETA (MBT) adsorbent obtained from _Citrus reticulata_ peels and found that the removal decreased from 66.5 to 1.3% by changing the pH value from 1.5 to 12. It was found that the
optimal pH for AY11 dye adsorption for PPAC was 2. Since they fight for adsorption sites with the anions of the anionic AY11 dye, abundant OH– ions in an alkaline environment (high solution
pH) diminish the adsorption effectiveness. Additionally, the PPAC adsorbent favors dye anions over OH– ions of low concentration and mobility. The formation of attractive electrostatic
forces as the amount of positively charged regions rises at acidic pH levels aids in the improvement of anion adsorption. Because of negatively charged surface regions and electrostatic
repulsion of PPAC do not promote the removal of AY11 anionic dye molecules, resulting in very high adsorption efficiency in the strongly acidic pH 2. This is a result of the hydrophobic
properties of biochar. Hydrogen atoms connect to the carbon surface of the PPAC adsorbent and give it a positive charge. Therefore, the attractive interactions between the positively charged
PPAC and the negatively charged AY11 dye allow adsorption. CONTACT TIME IMPACT For the PPAC adsorbent and AY11 dye to interact as needed, contact time is a crucial factor. For this purpose,
PPAC at pH 2 with a starting AY11 dye concentration varying from 100 to 400 ppm was applied to investigate the influence of contact time. Figure 7 illustrates how the adsorption process
advances steadily after the first minute and occurs quickly for the first 15 min. According to Fig. 7, the first 30 min of AY11 dye adsorption account for 35–89% of the total adsorption.
With an increase in contact duration, the AY11 dye was continually adsorped. Depending on the AY11 dye beginning concentration (100, 150, 200, 300, and 400 mg/L), after 150 min, the
elimination was 99.9%, 99.8%, 99.6%, 97.9%, and 95.4%, respectively. The majority of AY11 dye ions will be able to stick to the PPAC and the removal will be high since the empty active
sites' dye concentration is low when the AY11 dye is adsorption from the PPAC adsorbent. On the other hand, the removal percentage remains low when removing AY11 dye from PPAC adsorbent
with a high initial concentration because of the empty active sites are unable to adsorb fresh dyes once they have been occupied by a certain amount of AY11 dye. Eleryan et al.6 and El Nemr
et al.70 showed similar results in the Acid Yellow 11 dye removal studies. INFLUENCE OF BEGINNING AY11 DYE CONCENTRATION The beginning concentration of AY11 dye is an essential factor in
the removal process as it can be used to predict how it will change the equilibrium adsorption capacity (_q__e_). To determine the effect of PPAC dose on the steady-state adsorption
capacity, the beginning AY11 dye concentration (100, 150, 200, 300, and 400 mg/L) and the AY11 dye concentration (0.75, 1.0, 1.5, 2.0 and 2.5 g/L) were studied at 25 °C and pH 2 (_q__e_).
Figure 8 demonstrates that as PPAC doses are reduced, the AY11 dye amount adsorbed at equilibrium (_q_e) increases at the same beginning concentration of AY11 dye. PPAC adsorbents were used
to compute the adsorption capacities at equilibrium (_q__e_) in the adsorption of AY11 dye at various doses (0.75–2.5 g/L), as shown in Fig. 8. For beginning AY11 dye concentrations (100,
150, 200, 300, and 400 mg/L), these values range from 133 to 508, 80 to 391, 67 to 264, 50 to 199, and 40 to 159 mg/g, respectively. Figure 8 shows that in solutions with higher beginning
AY11 dye concentrations, the AY11 dye adsorption capacity (_q_e) of PPAC is higher at equilibrium. As the adsorbent dose rose, it was seen to decrease. The adsorption of the AY11 dye from
its water solution was, therefore, clearly dependent on its beginning concentration, as shown. In their investigation into the adsorption of the dye Direct Yellow 12, Khaled et al.79
reported a similar pattern. The boundary layer effect is the first thing that happens to the AY11 dye molecules when they stick to the PPAC adsorbent. Due to the porous nature of the
adsorbent, they eventually coalesce when they diffuse out of the boundary layer film to the PPAC surface. IMPACT OF PPAC DOSAGE ON AY11 DYE ADSORPTION In order to test the impact of PPAC
dosage on the removal of the AY11 dye, the following experimental conditions were used: initial AY11 dye concentrations of 100–400 mg/L, PPAC dosages of 0.75–2.5 g/L, solution temperature of
25 °C, adsorption time of 150 min, and solution pH of 2 and the results are shown in Fig. 9a,b. According to experimental findings, the amount of AY11 dye adsorbed at equilibrium (_q_e)
falls as PPAC adsorbent dosage is increased (Fig. 9b), while the AY11 dye elimination % marginally increases (in the range of 95.4–100%) (Fig. 9a). If the beginning AY11 dye concentration is
300–400 mg/L and the PPAC dosage is 0.75 g/L, the release is caused by the active sites on the PPAC surface filling up rapidly in the existence of highly concentrated AY11 dye molecules.
Thus, 95–97% of the dye was eliminated, when the amount of PPAC adsorbent was increased from 0.75 to 2.5 g/L for beginning AY11 dye concentrations of 100, 150, 200, 300, and 400 mg/L,
respectively, the amount of AY11 dye adsorbed at equilibrium (_q_e) decreases from 133 to 40, 200 to 60, 266 to 80, 397 to 120, and 512 to 159 mg/g. It was discovered that 2.5 g/L PPAC dose
produced the highest elimination % of AY11 dye and the lowest adsorption quantity at equilibrium (_q_e). ADSORPTION ISOTHERMS The adsorption isotherm is applied to explain how the adsorbate
molecules partition between the solid and liquid phases by relating to the _q__e_ (mg/g) and _C_0 (mg/L) and to the equilibrium time88,98. The ideal amount of adsorbent to use is determined
using the molecular fraction of the adsorbate distributed in equilibrium (_q__e_) between solid–liquid phases and isotherm data. In this investigation, Langmuir (LIM), Freundlich (FIM),
Tempkin (TIM), Halsey (HIM), and Generalize isotherm (GIM) isotherm models were used to analyze the interaction between PPAC and AY11 dye88. The findings of the AY11 dye's adsorption on
PPAC are presented in Table 2, where the constants for the LIM are the affinity of the adsorption sites (_K__L_) and the saturated monolayer adsorption capacity (_Q__m_). PPAC adsorbent
demonstrated a high correlation coefficient (_R_2 = 0.992) in the linear form of the Langmuir model for the removal of AY11 dye, and the highest monolayer capacity (_Q__m_) was determined to
be 515.46 mg/g. The 1/_Q_m_K_L and 1/_Q_m values of the LIM were obtained from the intersection point and slope of the _C_e/_q_e vs _C_e plot shown in Fig. 10a, respectively. Strong
evidence for the adsorption of AY11 dye on PPAC can be mentioned from the _K_L ranging from 0.79 to 6.49 L/mg and a high _R_2 (0.994). According to the LIM, it is possible to apply the AY11
dye on the PPAC adsorbent. It was found that the AY11 dye was only absorbed in one layer on the PPAC adsorbent's surface. An additional model used for the adsorption of the AY11 dye by
PPAC is the FIM. The FIM was used to assess how well the PPAC adsorbent removed the AY11 dye. The linear fit values of the FIM, which considers the adsorption process as a heterogeneous
phenomenon, are presented in Table 2. The log _K_F and 1/_n_F values of the FIM are provided by the intersection point and slope of the log (_q__e_) vs log (_C__e_) plot shown in Fig. 10b,
respectively. One of the FIM constants, _K__F_ (L/g), denoting the binding energy, is used to indicate the amount of AY11 dye removed on the PPAC for a unit equilibrium concentration. The
adsorption capacity of the adsorbent increases with a greater _K_F value. Additionally, the adsorbent can easily absorb the adsorbate if 1/_n_ is less than 1. Therefore, the removal of AY11
dye by PPAC adsorbent is a physical process when 1/_n_ is smaller than 1. Examining the 1/_n_ values in Table 2 reveals that the AY11 dye can be appropriately adsorbed to the PPAC adsorbent
because all values are less than one. When the _n_ value, which measures the level of nonlinearity between the solution concentration and the removal process, is greater than 1, the AY11 dye
physically absorbs into the PPAC. The values of the FIM correlation coefficients are successfully defined by the change in log (_q__e_) as a function of log (_C__e_) (Fig. 10b). The higher
_Q__m_ value, which is 1692 mg/g and belongs to the PPAC with a 2.0 g/L dose as shown in Table 2, determines the superior adsorbability of AY11 dye to PPAC adsorbent. For PPAC adsorbent, the
Freundlich correlation coefficient (_R_2 > 0.995) was slightly higher than the Langmuir correlation coefficient. The TIM, another isotherm model used to analyze experimental results,
describes the indirect influences of adsorbent/adsorbate interactions on the process of adsorption. The TIM considers the heat exchange that takes place while the AY11 dye is being adsorbed
to the PPAC surface. Each molecule in the bed is expected to experience a linear decay in the heat of adsorption over time due to the process of adsorption. The linear relationship between
_q__e_ and ln _C__e_ presented in Fig. 10c is used to determine the TIM constants (_A__T_ and _B__T_) of adsorption of AY11 dye by PPAC adsorbents. Calculating the equilibrium binding
constant _A__T_ (g/L) using the graph's slope and the intercept of the graph, respectively. The equilibrium bonding constant _A__T_ (g/L) is computed from the graph's slope, while
the adsorption heat coefficient _B__T_ is measured from the graph's intercept. The computed TIM constants are shown in Table 2. Concerning the adsorption of the AY11 dye by the PPAC
using a 0.75 g/L dosage, the TIM correlation coefficient was obtained, and since it was quite high (_R_2 > 0.982), it was determined that the model was appropriate for analyzing
temperature changes in the removal process. The AY11 dye was removed through physisorption due to the extremely low heat of adsorption, and there was very little ionic contact between the
adsorbent and the adsorbate. The coating of the AY11 dye on the PPAC adsorbent is affected by the heat of adsorption (_B__T_), which is connected to the adsorbent-adsorbate interaction. If
Table 2 is examined, it can be seen that this value gradually climbed from 0.75 to 1.5 g/L of PPAC while decreasing to 0.25 g/L following this dosage. Halsey Model is another IM that has
been used to analyze experimental results. Multilayer adsorption is suited for the Halsey isotherm model. The adsorbent is non-homogeneous if this model satisfactorily matches the
equilibrium data. According to Fig. 10d, the HIM based on the correction factor is more appropriate for fitting such data than LIM, FIM, TIM, and GIM. In the Halsey model, a great
correlation (_R_2 = 1) was obtained in all samples except the adsorbent with 2.5 g/L concentration (Table 2). The multi-layer adsorption in the pores resulted in high _R_2 values when the
adsorption results were fitted to the FIM and HIM. The experimental data are also fitted to the GIM (Fig. 10e) in addition to the IMs already described above. It was noted that the _R_2
values were relatively high at all concentrations (_R_2 > 0.984), with the exception of the PPAC with 1.5 g/L concentration. Figure 10f shows the comparison of the _q_e and _C_e working
results and their prediction using the isotherm models for the absorption of AY11 dye by PPAC. ERROR FUNCTION INVESTIGATION FOR THE BEST-FIT IM To select the best appropriate model for the
removal of AY11 dye to PPAC, correlation coefficients (_R_2) for the LIM, FIM, TIM, HIM and GIM were compared to the experimental data of_ q_e. Comparing several error function values is
another method for selecting the best IM given experimental data. Average percent errors (APE), root mean square errors (RMS), hybrid error function (HYBRID), Chi-square error (X2), sum of
absolute errors (EABS) and Marquardt's percent standard deviation (MPSD) were used as the primary functions to compute the error distribution between the equilibrium values and the
estimated IM88. It is very clear that the most suitable model is the Halsey isotherm model, according to both correlation coefficients and error function terms (Table 3). ADSORPTION KINETIC
STUDIES PFOM, PSOM, IPDM, FDM and EM equations were used for the kinetic models of the AY11 dye removal by PPAC88. The kinetic models in Tables 4 and 5 have correlation coefficients (_R_2)
that range from zero (0) to one (1), and the model's suitability is directly correlated with how near the _R_2 value is to one. Figure 11a illustrates the calculation of the rate
constant, _k_1, and _q_e from the linear graph of the values of log (_q_e – _q_t) against time (_t_). The fact that the _R_2 values are above 0.9, with some exceptions, indicates that the
estimated _q_e values are compatible with the experimental _q_e. The PFOM equation is, therefore, appropriate for the AY11 dye adsorption on PPAC when considering the values in Table 5. As
the concentration of PPAC adsorbent increases from 0.75 to 25 g/L, Table 5 demonstrates no regular increase or reduction in _R_2 values. The PSOM was also used to assess the AY11 dye's
removal by the PPAC adsorbent. The quantity of AY11 dye adsorbed at equilibrium (_q__e_), as well as the PSOM constant, _k__2_, may be calculated by graphing _t_/_q_e vs time, as seen in
Fig. 11b. Figure 11b shows the PSO kinetic curve of the PPAC for the removal of the AY11 dye. Table 5 also includes the values for the PSOM constant (_k_2), theoretical and experimentally
calculated _q_e values, and related _R_2 values. Table 5 analysis reveals that the PSOM has _R_2 values that are closest to 1. The PSOM is, therefore, the most suitable kinetic model. As a
result, the experimental _q__e_ values exactly overlap the estimated _q__e_ values for all of the beginning AY11 dye concentrations examined. The elimination of the AY11 dye on the PPAC
was studied using the EM, and Fig. 11c displays the correlation curve between _q__t_ and ln (_t_). The EM constants were calculated using the intercept and slope of Fig. Figure 11c,
respectively, and the results are shown in Table 5. When comparing the _R_2 values, it can be said that the EM's _R_2 values are higher than the PFOM's and lower than the
PSOM's (Tables 4 and 5). The results from Tables 4 and 5 demonstrate that, under certain circumstances, chemical adsorption can control the rate of AY11 dye adsorption on PPAC
adsorbent. The IPDM explains the solute transport from solid to liquid during adsorption. The IPDM identifies and explains each phase in the sorption process. The adsorbate is deposited onto
the adsorbent in an adsorption process in three steps: (i) In the initial stage, ions or molecules are moved from the solution via the liquid layer to the adsorbent surface. (ii) The second
step entails scattering the molecules or ions that have been adhered to the inside adsorbent surface. (iii) The final stage involves the chemical reaction that occurs in the
adsorbent's active groups. The phase that determines the rate of adsorption evolves slowly, as does each of the other two phases. The theory put out by Weber and Morris93 states that
the intraparticle diffusion step controls adsorption if the lines indicated in the graph of _q_t and root time (_t_) in Fig. 11d pass through the origin. However, when the drawn lines do not
go through the origin, it is thought that FD regulates the rate of the removal process (i.e., when the _C_ value is high). For the adsorption of AY11 dye onto PPAC at varied adsorbent
dosages and starting AY11 dye concentrations, the Webber-Morris adsorption line is shown in Fig. 11d. The slope and intercept points of the plot of _q__t_ versus _t_0.5 were used to generate
the _K_dif and _C_ values displayed in Table 5. The straight lines in Fig. 11d that represent all adsorbent concentrations do not pass through the origin because of their high _C_
intersection. It can be demonstrated that this is the case since FD regulates the rate of AY11 dye adsorption on PPAC adsorbent, which increases progressively over time (Fig. 11e). This
occurs because the PPAC adsorbent's surface area and pore volume diminish as the removal process progresses. COMPARISON WITH THE FINDINGS FROM THE LITERATURE The azo dye removal
effectiveness using various materials was compared with the PPAC adsorbent in the literature analysis reported in Table 6, which demonstrated how effectively the AY11 dye was absorbed by the
PPAC adsorbent. REGENERATION OF PPAC To test the viability and reusability of PPAC as an adsorbent, desorption tests of the AY11 dye from the PPAC adsorbent were carried out by 0.1 M NaOH
and HCl as elution media. With increasing regeneration cycles in this situation, the desorption percentage dropped (Fig. 12). The regenerated PPAC was used in six successive
adsorption/desorption cycles. The amount of adsorption that was offered remained constant during the cycles; however, after six generations, the adsorption capacity had decreased by 12.85%,
while the desorption capacity decreased by 9.8% after six desorption cycles. It implies that it might be employed as a long-lasting AY11 dye adsorption process (Fig. 12). CONCLUSION This
work has shown that pea peels, a type of biomass waste, may be used to make an inexpensive and effective adsorbent material. Dry pea peels were first impregnated with ZnCl2 at 25 °C, then
heated to 600, 700, and 800 °C in a CO2 environment to create PPAC, which is ready to be employed in the adsorption of AY11 dye. Beginning concentration, PPAC dose, time of contact between
the AY11 dye and the PPAC, and pH were all found to influence the remove of the AY11 dye from water. The optimal pH for PPAC to absorb the AY11 dye was found to be 2, researchers found. It
was found that the 2.5 g/L dosages of PPAC adsorbent produced the most AY11 dye elimination and the lowest amount of adsorption (_q__e_) at equilibrium. The HIM and FIM perform better than
other models in in eliminating AY11 dye. The maximum adsorption capacity (_Q_m) determined using the LIM was 515.46 mg/g. The AY11 dye was removed through physisorption because of the
exceedingly low heat of adsorption and the negligible ionic contact between the adsorbent and adsorbate. The results of this investigation point to PPAC as a potentially effective and
cost-effective adsorbent for the elimination of AY11 dye from water. DATA AVAILABILITY The datasets used in this investigation are accessible for review upon request from the corresponding
author of the paper. REFERENCES * Hassaan, M. A. & El Nemr, A. Pesticides pollution: Classifications, human health impact, extraction and treatment techniques. _Egypt. J. Aquat. Res._
46, 207–220 (2020). Article Google Scholar * Ragab, S., El Sikaily, A. & El Nemr, A. Concentrations and sources of pesticides and PCBs in surficial sediments of the Red Sea coast
Egypt. _Egypt. J. Aquat. Res._ 42, 365–374 (2016). Article Google Scholar * Asiri, H. F. _et al._ Monitoring and health risk assessment of some pesticides and organic pollutants in fruit
and vegetables consumed in Asir Region Saudi Arabia. _Fresenius Environ. Bull._ 29, 615–625 (2020). CAS Google Scholar * Cuerda-Correa, E.M., Domínguez-Vargas, J.R., Olivares-Marín, F.J.
& de Heredia, J.B. On the use of carbon blacks as potential low-cost adsorbents for the removal of non-steroidal anti-inflammatory drugs from river water. _J. Hazard. Mater._ 177, 46–53
(2010). * Al-Musawi, T. J. _et al._ Synthesis of a doped α-Fe2O3/g-C3N4 catalyst for high-efficiency degradation of diazinon contaminant from liquid wastes. _Magnetochemistry_ 8, 137 (2022).
Article CAS Google Scholar * Eleryan, A. _et al._ Mandarin Biochar-TETA (MBT) prepared from Citrus reticulata peels for adsorption of Acid Yellow 11 dye from water. _Sci. Rep._ 12, 17797
(2022). Article ADS CAS PubMed Central PubMed Google Scholar * Ghaedi, M., Ansari, A., Habibi, M. H. & Asghari, A. R. Removal of malachite green from aqueous solution by zinc
oxide nanoparticle loaded on activated carbon: Kinetics and isotherm study. _J. Ind. Eng. Chem._ 20, 17–28 (2014). Article CAS Google Scholar * Yılmaz, M. _et al_. The use of
mandarin-biochar-O3-TETA (MBT) produced from mandarin peels as a natural adsorbent for the removal of acid red 35 (AR35) dye from water. _Environ. Process_. 9, (2022). * Hassaan, M. A. _et
al._ Tibacterial activity and removal of Congo red dye. _Desalin. Water Treat._ 218, 423–435 (2021). Article CAS Google Scholar * Ghaedi, M., Mohammdi, F. & Ansari, A. Gold
nanoparticles loaded on activated carbon as novel adsorbent for kinetic and isotherm studies of methyl orange and sunset yellow adsorption. _J. Dispers. Sci. Technol._ 36, 652–659 (2015).
Article CAS Google Scholar * El Nemr, A., El-Sikaily, A., Khaled, A., Said, T. O. & Abd-Alla, A. Determination of hydrocarbons in mussels from the Egyptian Red Sea Coast. _Environ.
Monit. Assess._ 96, 251–261 (2004). Article PubMed Google Scholar * El Nemr, A., El-Sadaawy, M. M., Khaled, A. & Draz, S. O. Aliphatic and polycyclic aromatic hydrocarbons in the
surface sediments of the Mediterranean: Assessment and source recognition of petroleum hydrocarbons. _Environ. Monit. Assess._ 185, 4571–4589 (2013). Article CAS PubMed Google Scholar *
Hassaan, M. A., El-Rayis, O., Hemada, E. & El Nemr, A. Assessment of potentially toxic elements in water and sediments in the drainage network of Lake Mariout. _Egypt. SN Appl. Sci._ 4,
1–17 (2022). Google Scholar * Dhahri, R. _et al._ Optimization of the preparation of activated carbon from prickly pear seed cake for the removal of lead and cadmium ions from aqueous
solution. _Sustainability_ 14, 3245 (2022). Article CAS Google Scholar * Bilal, M. _et al._ Waste biomass adsorbents for copper removal from industrial wastewater—a review. _J. Hazard.
Mater._ 263, 322–333 (2013). Article CAS PubMed Google Scholar * Li, W., Ji, W., Yılmaz, M., Zhang, T.C. & Yuan, S. One-Pot synthesis of MWCNTs/Fe-MOFs nanocomposites for enhanced
adsorption of As(V) in aqueous solution. _Appl. Surf. Sci._ 609, (2023). * El-Wakil, A. M. _et al._ Triazine-based functionalized activated carbon prepared from water hyacinth for the
removal of Hg(2+), Pb(2+), and Cd(2+) ions from water. _ACS Omega_ 7, 6058–6069 (2022). Article CAS PubMed Central PubMed Google Scholar * El Nemr, A. _Impact_ (Monitoring and
Management of Environmental Pollution. Nova Science Publishers, Inc., 2010). Google Scholar * El Nemr, A. _Pollution status, environmental protection, and renewable energy production in
marine systems_ (Nova Science Publishers, Inc., 2016). Google Scholar * Lin, Q. _et al._ Effectively removal of cationic and anionic dyes by pH-sensitive amphoteric adsorbent derived from
agricultural waste-wheat straw. _J. Taiwan Inst. Chem. Eng._ 76, 65–72 (2017). Article CAS Google Scholar * Rafatullah, M., Sulaiman, O., Hashim, R. & Ahmad, A. Adsorption of
methylene blue on low-cost adsorbents: A review. _J. Hazard. Mater._ 177, 70–80 (2010). Article CAS PubMed Google Scholar * Ali, R. M. _et al._ Highly crystalline heterogeneous catalyst
synthesis from industrial waste for sustainable biodiesel production. _Egypt. J. Chem._ 63, 161–1178 (2020). Google Scholar * Dawood, S. & Sen, T. K. Removal of anionic dye Congo red
from aqueous solution by raw pine and acid-treated pine cone powder as adsorbent: equilibrium, thermodynamic, kinetics, mechanism and process design. _Water Res._ 46, 1933–1946 (2012).
Article CAS PubMed Google Scholar * Rauf, M. A. & Ashraf, S. S. Radiation induced degradation of dyes: An overview. _J. Hazard. Mater._ 166, 6–16 (2009). Article CAS PubMed Google
Scholar * Saleh, T. A. & Gupta, V. K. Column with CNT/magnesium oxide composite for lead(II) removal from water. _Environ. Sci. Pollut. Res._ 19, 1224–1228 (2012). Article CAS Google
Scholar * Karthikeyan, S. _et al._ A new approach for the degradation of high concentration of aromatic amine by heterocatalytic Fenton oxidation: Kinetic and spectroscopic studies. _J.
Mol. Liq._ 173, 153–163 (2012). Article CAS Google Scholar * Gupta, V. K., Nayak, A. & Agarwal, S. Bioadsorbents for remediation of heavy metals: Current status and their future
prospects. _Environ. Eng. Res._ 20, 1–18 (2015). Article Google Scholar * Hassaan, M. A., El Nemr, A. & Madkour, F. F. Testing the advanced oxidation processes on the degradation of
Direct Blue 86 dye in wastewater. _Egypt. J. Aquat. Res._ 43, 11–19 (2017). Article Google Scholar * Hassaan, M. A., El Nemr, A. & Madkour, F. F. Advanced oxidation processes of
Mordant Violet 40 dye in freshwater and seawater. _Egypt. J. Aquat. Res._ 43, 1–9 (2017). Article Google Scholar * El Nemr, A., Hassaan, M. A. & Madkour, F. F. Advanced oxidation
process (AOP) for detoxification of acid red 17 dye solution and degradation mechanism. _Environ. Process._ 5, 95–113 (2018). Article Google Scholar * El Nemr, A., Hassaan, M. A. &
Madkour, F. F. HPLC-MS/MS mechanistic study of direct yellow 12 dye degradation using ultraviolet assisted ozone process. _J. Water Environ. Nanotechnol._ 3, 1–11 (2018). Google Scholar *
Felix, C. _et al._ Electrophoresis and stability of nano-colloids: history, theory and experimental examples. _Adv. Colloid Interface Sci._ 211, 77–92 (2014). Article CAS PubMed Google
Scholar * Yilmaz, M., Mengelizadeh, N., khodadadi Saloot, M. & Balarak, D. Facile synthesis of Fe3O4/ZnO/GO photocatalysts for decolorization of acid blue 113 under solar, visible and
UV lights. _Mater. Sci. Semicond. Process._ 144, 106593 (2022). * Hassaan, M., El Katory, M., Ali, R. M. & El Nemr, A. Photocatalytic degradation of reactive black 5 using Photo-Fenton
and ZnO nanoparticles under UV irradiation. _Egypt. J. Chem._ 63, 1443–1459 (2020). Google Scholar * Helmy, E. T., Nemr, A. E., Arafa, E., Eldafrawy, S. & Mousa, M. Photocatalytic
degradation of textile dyeing wastewater under visible light irradiation using green synthesized mesoporous non-metal-doped TiO2. _Bull. Mater. Sci._ 44, 1–11 (2021). Article Google Scholar
* El Nemr, A., Helmy, E. T., Gomaa, E. A., Eldafrawy, S. & Mousa, M. Photocatalytic and biological activities of undoped and doped TiO2 prepared by Green method for water treatment.
_J. Environ. Chem. Eng._ 7, 103385 (2019). Article Google Scholar * Jabar, J. M., Odusote, Y. A., Ayinde, Y. T. & Yılmaz, M. African almond (Terminalia catappa L) leaves biochar
prepared through pyrolysis using H3PO4 as chemical activator for sequestration of methylene blue dye. _RINENG._ 14, 100385 (2022). CAS Google Scholar * Salama, A., Shukry, N. &
El-Sakhawy, M. Carboxymethyl cellulose-g-poly(2-(dimethylamino) ethyl methacrylate) hydrogel as adsorbent for dye removal. _Int. J. Biol. Macromol._ 73, 72–75 (2015). Article CAS PubMed
Google Scholar * El Nemr, A. _Non-conventional textile waste water treatment_ (Nova Science Publishers, Inc., 2012). Google Scholar * Hoang, L. P. _et al._ Removal of Tetracycline from
aqueous solution using composite adsorbent of ZnAl layered double hydroxide and bagasse biochar. _Environ. Technol. Innov._ 28, 102914 (2022). Article CAS Google Scholar * de Souza, C. C.
_et al._ Activated carbon of Coriandrum sativum for adsorption of methylene blue: Equilibrium and kinetic modeling. _Cleaner Materials._ 3, 100052 (2022). Article Google Scholar *
Heibati, B. _et al._ Kinetics and thermodynamics of enhanced adsorption of the dye AR 18 using activated carbons prepared from walnut and poplar woods. _J. Mol. Liq._ 208, 99–105 (2015).
Article CAS Google Scholar * Kołodyńska, D., Krukowska, J. A. & Thomas, P. Comparison of sorption and desorption studies of heavy metal ions from biochar and commercial active carbon.
_Chem. Eng. J._ 307, 353–363 (2017). Article Google Scholar * Güzel, F., Sayğılı, H., Sayğılı, G. A., Koyuncu, F. & Yılmaz, C. Optimal oxidation with nitric acid of biochar derived
from pyrolysis of weeds and its application in removal of hazardous dye methylene blue from aqueous solution. _J. Clean. Prod._ 144, 260–265 (2017). Article Google Scholar * Liu, X.,
Zhang, Y., Li, Z., Feng, R. & Zhang, Y. Characterization of corncob-derived biochar and pyrolysis kinetics in comparison with corn stalk and sawdust. _Bioresour. Technol._ 170, 76–82
(2014). Article CAS PubMed Google Scholar * El-Nemr, M.A. _et al_. The use of biochar-NH2 produced from watermelon peels as a natural adsorbent for the removal of Cu(II) ion from water.
_Biomass Convers. Biorefinery_ 1–17 (2022). * El-Nemr, M.A., Yılmaz, M., Ragab, S. & El Nemr, A. Biochar-SO prepared from pea peels by dehydration with sulfuric acid improves the
adsorption of Cr6+ from water. _Biomass Convers. Biorefinery_ 1–19 (2022). * Arabzadeh, S., Ghaedi, M., Ansari, A., Taghizadeh, F. & Rajabi, M. Comparison of nickel oxide and palladium
nanoparticle loaded on activated carbon for efficient removal of methylene blue: Kinetic and isotherm studies of removal process. _Hum. Exp. Toxicol._ 34, 153–169 (2015). Article CAS
PubMed Google Scholar * Sayğılı, H. & Güzel, F. High surface area mesoporous activated carbon from tomato processing solid waste by zinc chloride activation: Process optimization,
characterization and dyes adsorption. _J. Clean. Prod._ 113, 995–1004 (2016). Article Google Scholar * İzgi, M. S., Saka, C., Baytar, O., Saraçoğlu, G. & Şahin, Ö. Preparation and
characterization of activated carbon from microwave and conventional heated almond shells using phosphoric acid activation. _Anal. Lett._ 52, 772–789 (2018). Article Google Scholar *
Jiang, Z. _et al._ Activated carbons chemically modified by concentrated H2SO4 for the adsorption of the pollutants from wastewater and the dibenzothiophene from fuel oils. _Langmuir_ 19,
731–736 (2003). Article CAS Google Scholar * El Nemr, A., El-Sikaily, A., Khaled, A. & Abdelwahab, O. Removal of toxic chromium from aqueous solution, wastewater and saline water by
marine red alga Pterocladia capillacea and its activated carbon. _Arab. J. Chem._ 8, 105–117 (2015). Article Google Scholar * Guo, J. _et al._ Preparation and characterization of
nanoporous activated carbon derived from prawn shell and its application for removal of heavy metal ions. _Materials_ 12, 241 (2019). Article ADS CAS PubMed Central PubMed Google
Scholar * Wang, S., Nam, H. & Nam, H. Preparation of activated carbon from peanut shell with KOH activation and its application for H2S adsorption in confined space. _J. Environ. Chem.
Eng._ 8, 103683 (2020). Article CAS Google Scholar * Ma, H. Y. Thermal and structure analysis on reaction mechanisms during the preparation of activat-ed carbon fibers by KOH activation
from liquefied wood-based fibers. _Ind. Crops Prod._ 69, 447–455 (2015). Article Google Scholar * Tazibet, S., Boucheffa, Y., Lodewyckx, P., Velasco, L. F. & Boutillara, Y. Evidence
for the effect of the cooling down step on activated carbon adsorption properties. _Microporous Mesoporous Mater._ 221, 67–75 (2016). Article CAS Google Scholar * Li, Y. _et al._
ZnCl2-activated carbon from soybean dregs as a high efficiency adsorbent for cationic dye removal: Isotherm, kinetic, and thermodynamic studies. _Environ. Technol._ 41, 2013–2023 (2020).
Article CAS PubMed Google Scholar * Kwon, D., Oh, J. I., Lam, S. S., Moon, D. H. & Kwon, E. E. Orange peel valorization by pyrolysis under the carbon dioxide environment. _Bioresour.
Technol._ 285, 121356 (2019). Article CAS PubMed Google Scholar * Foo, K. Y. & Hameed, B. H. Coconut husk derived activated carbon via microwave induced activation: Effects of
activation agents, preparation parameters and adsorption performance. _Chem. Eng. J._ 184, 57–65 (2012). Article CAS Google Scholar * Muniandy, L., Adam, F., Mohamed, A. R. & Ng, E.
P. The synthesis and characterization of high purity mixed mi-croporous/mesoporous activated carbon from rice husk using chemical activation with NaOH and KOH. _Microporous Mesoporous
Mater._ 197, 316–323 (2014). Article CAS Google Scholar * Koyuncu, F., Güzel, F. & Sayğılı, H. Role of optimization parameters in the production of nanoporous carbon from mandarin
shells by microwave-assisted chemical activation and utilization as dye adsorbent. _Adv. Powder Technol._ 29, 2108–2118 (2018). Article CAS Google Scholar * Gao, Y. _et al._ Preparation
of high surface area-activated carbon from lignin of pa-permaking black liquor by KOH activation for Ni(II) adsorption. _Chem. Eng. J._ 217, 345–353.
https://doi.org/10.1016/j.cej.2012.09.038 (2013). Article CAS Google Scholar * Guo, H. _et al_. Lignin-based adsorbent-catalyst with high capacity and stability for polychlorinated
aromatics removal. _Bioresour. Technol._ 337, 125453. https://doi.org/10.1016/j.biortech.2021.125453 (2021). * El Nemr, A. _et al_. Utilization of sugarcane bagasse/ZnCl2 for sustainable
production of microporous nano-activated carbons of type I for toxic Cr(VI) removal from aqueous environment. _Biomass Convers. Biorefinery_ 1–20 (2021). * Yavuz, R., Akyildiz, H., Karatepe,
N. & Çetinkaya, E. Influence of preparation conditions on porous structures of olive stone activated by H3PO4. _Fuel Process. Technol._ 91, 80–87 (2010). Article CAS Google Scholar *
Kyzas, G. Z., Deliyanni, E. A. & Matis, K. A. Activated carbons produced by pyrolysis of waste potato peels: Cobalt ions removal by adsorption. _Colloids Surf. A Physicochem. Eng._ 490,
74–83 (2016). Article CAS Google Scholar * Lv, Y. _et al._ A self-template synthesis of hierarchical porous carbon foams based on banana peel for supercapacitor electrodes. _J. Power
Sour._ 209, 152–157 (2012). Article ADS CAS Google Scholar * Shoaib, A. G., El-Sikaily, A., El Nemr, A., Mohamed, A. E. D. A. & Hassan, A. A. Testing the carbonization condition for
high surface area preparation of activated carbon following type IV green alga Ulva lactuca. _Biomass Convers. Biorefinery_ 12, 3303–3318. https://doi.org/10.1007/s13399-020-00823-w (2022).
Article CAS Google Scholar * Aboua, K. N., Yobouet, Y. A., Yao, K. B., Gone, D. L. & Trokourey, A. Investigation of dye adsorption onto activated carbon from the shells of Macore
fruit. _J. Environ. Manage._ 156, 10–14 (2015). Article CAS PubMed Google Scholar * El-Nemr, M. A., Abdelmonem, N. M., Ismail, I. M. A., Ragab, S. & El Nemr, A. Removal of Acid
Yellow 11 dye using a novel modified biochar derived from watermelon peels. _Desalin. Water Treat._ 203, 403–431 (2020). Article CAS Google Scholar * El Nemr, A., _et al_. Utilization of
Citrus aurantium peels for sustainable production of high surface area type I microporous nano activated carbons. _Biomass Convers. Biorefinery_ 1–19 (2021). * Zhang, W. _et al._ Adsorption
of anionic dyes from aqueous solutions using chemically modified straw. _Bioresour. Technol._ 117, 40–47 (2012). Article ADS CAS PubMed Google Scholar * Song, J., Zou, W., Bian, Y., Su,
F. & Han, R. Adsorption characteristics of methylene blue by peanut husk in batch and column modes. _Desalination_ 265, 119–125 (2011). Article CAS Google Scholar * Islam, M. A.,
Benhouria, A., Asif, M. & Hameed, B. H. Methylene blue adsorption on factory-rejected tea activated carbon prepared by conjunction of hydrothermal carbonization and sodium hydroxide
activation processes. _J. Taiwan Inst. Chem. Eng._ 52, 57–64 (2015). Article CAS Google Scholar * Shoaib, A. G., El-Sikaily, A., El Nemr, A., Mohamed, A. E. D. A. & Hassan, A. A.
Preparation and characterization of highly surface area activated carbons followed type IV from marine red alga (_Pterocladia capillacea_) by zinc chloride activation. _Biomass Convers.
Biorefinery_ 12, 2253–2265. https://doi.org/10.1007/s13399-020-00760-8 (2022). Article CAS Google Scholar * Pathak, P. D., Mandavgane, S. A. & Kulkarni, B. D. Characterizing fruit and
vegetable peels as bioadsorbents. _Curr. Sci._ 110, 2114–2123 (2016). Article CAS Google Scholar * El-Nemr, M. A., Abdelmonem, N. M., Ismail, I., Ragab, S. & El Nemr, A. Ozone and
ammonium hydroxide modification of biochar prepared from Pisum sativum peels improves the adsorption of copper (II) from an aqueous medium. _Environ. Process._ 7, 973–1007.
https://doi.org/10.1007/s40710-020-00455-2 (2020). Article CAS Google Scholar * El-Nemr, M. A. _et al._ Adsorption of Cr6+ ion using activated Pisum sativum peels decorated with
triethylenetetramine. _Environ. Sci. Pollut. Res._ 29, 91036–91060. https://doi.org/10.1007/s11356-022-21957-6 (2022). Article CAS Google Scholar * Sahlabji, T. _et al._ High surface area
microporous activated carbon from pisum sativum peels for hexavalent chromium removal from aquatic environment. _Toxin. Rev._ 41, 639–649. https://doi.org/10.1080/15569543.2021.1908361
(2022). Article CAS Google Scholar * El-Nemr, M. A. _et al._ Microporous activated carbon prepared from Pisum sativum pods using different activation methods for adsorptive removal of
Acid Orange 7 dye from water. _Molecules_ 27, 4840. https://doi.org/10.3390/molecules27154840 (2022). Article CAS PubMed Central PubMed Google Scholar * Eleryan, A. _et al._ Feasible
and eco-friendly removal of hexavalent chromium toxicant from aqueous solutions using chemically modified sugarcane bagasse cellulose. _Toxin Rev._ 40, 835–846.
https://doi.org/10.1080/15569543.2020.1790606 (2021). Article CAS Google Scholar * El Nemr, A. _et al_. Enhancement of biogas production from individually or co-digested green algae
Cheatomorpha linum using ultrasound and ozonation treated biochar. _Ultrason. Sonochem._ 90, 106197. https://doi.org/10.1016/j.ultsonch.2022.106197 (2022). * Langmuir, I. The constitution
and fundamental properties of solids and liquids. _J. Am. Chem. Soc._ 38, 2221–2295 (1916). Article CAS Google Scholar * Freundlich, H. M. F. Über die adsorption in lösungen. _Z. Fur
Phys. Chem._ 57A, 385–470 (1906). Google Scholar * Tempkin, M. J. & Pyzhev, V. Acta physiochim. _URSS_ 12, 217–222 (1940). Google Scholar * Harkins, W. & Jura, G. Surfaces of
solids XIII A vapor adsorption method for the determination of the area of a solid without the assumption of a molecular area, and the areas occupied by nitrogen and other molecules on the
surface of a solid. _J. Am. Chem. Soc._ 66, 1366–1371 (1944). Article CAS Google Scholar * Halsey, G. D. The role of surface heterogeneity. _Adv. Catal._ 4, 259–269 (1952). CAS Google
Scholar * El Nemr, A., El-Sikaily, A. & Khaled, A. Modeling of adsorption isotherms of Methylene Blue onto rice husk activated carbon. _Egypt. J. Aquat. Res._ 36, 403–425 (2010). Google
Scholar * Rosen, M.J. _Surfactants and interfacial phenomena_ pp 32–76 (John Willey, New York, 1978). * Lagergren, S. Zur theorie der sogenannten adsorption geloster stoffe. _Kungl.
Svenska Vetenskapsakad. Handl._ 24, 1–39 (1898). Google Scholar * Ho, Y. S., McKay, G., Wase, D. A. J. & Foster, C. F. Study of the sorption of divalent metal ions on to peat. _Adsorp.
Sci. Technol._ 18, 639–650 (2000). Article CAS Google Scholar * Zeldowitsch, J. Über den mechanismus der katalytischen oxidation von CO and MnO2. _Acta Physicochim. URSS_ 1, 364–449
(1934). Google Scholar * Weber, W. J. & Morris, J. C. Kinetics of adsorption on carbon from solution. _J. Sanit. Eng. Div. Am. J. Civ. Eng._ 89, 31–60 (1963). Article Google Scholar *
Boyd, G. E., Adamson, A. M. & Myers, L. S. The exchange adsorption of ions from aqueous solutions by organic zeolites. _J. Am. Chem. Soc._ 69, 2836 (1949). Article Google Scholar * El
Nemr, A., Ragab, S. & El Sikaily, A. Rapid synthesis of cellulose triacetate from cotton cellulose and its effect on specific surface area and particle size distribution. _Iran Polym.
J._ 26, 261–272. https://doi.org/10.1007/s13726-017-0516-2 (2017). Article CAS Google Scholar * Song, Y., Xu, H. & Ren, J. Adsorption study for removal of sunset yellow by
ethylenediamine-modified peanut husk. _Desalin. Water Treat._ 57, 17585–17592 (2015). Article Google Scholar * Khaled, A., El Nemr, A., El-Sikaily, A. & Abdelwahab, O. Treatment of
artificial textile dye effluent containing Direct Yellow 12 by orange peel carbon. _Desalination_ 238, 210–232 (2009). Article CAS Google Scholar * Ghaedi, A. M. _et al._ Adsorption of
Triamterene on multi-walled and single-walled carbon nanotubes: Artificial neural network modeling and genetic algorithm optimization. _J. Mol. Liq._ 216, 654–665 (2016). Article CAS
Google Scholar * Wang, L. _et al._ Microwave-assisted preparation of nitrogen-doped biochars by ammonium acetate activation for adsorption of acid red 18. _Appl. Surf. Sci._ 433, 222–231
(2018). Article ADS CAS Google Scholar * Yin, H. _et al._ Preparation of amphoteric modified bentonite from calcium-based bentonite for adsorption of anionic dye: The importance of
sodium-modification pretreatment. _Physicochem. Probl. Miner. Process._ 57, 1–17 (2020). Article Google Scholar * Kelm, M. A. P. _et al._ Removal of azo dye from water via adsorption on
biochar produced by the gasification of wood wastes. _Environ. Sci. Pollut. Res._ 26, 28558–28573 (2019). Article CAS Google Scholar * Chen, S. _et al._ Study on the adsorption of
dyestuffs with different properties by sludge-rice husk biochar: Adsorption capacity, isotherm, kinetic, thermodynamics and mechanism. _J. Mol. Liq._ 285, 62–74 (2019). Article CAS Google
Scholar * Unugul, T. & Nigiz, F. U. Preparation and characterization an active carbon adsorbent from waste mandarin peel and determination of adsorption behavior on removal of synthetic
dye solutions. _Wat. Air Siol Poll._ 231, 1–14 (2020). Google Scholar * Xia, L. _et al._ Environment-friendly Juncus effusus-based adsorbent with a three-dimensional network structure for
highly efficient removal of dyes from wastewater. _J. Clean. Prod._ 259, 120812 (2020). Article CAS Google Scholar * Park, H., Kim, J., Lee, Y. G. & Chon, K. Enhanced adsorptive
removal of dyes using mandarin peel biochars via chemical activation with NH4Cl and ZnCl2. _Water_ 13, 1495 (2021). Article CAS Google Scholar * Koyuncu, F. & Güzel, F. Use of new
nanoporous carbon produced from Mandarin (Citrus reticulata) industrial processing waste to remove anionic and cationic dyes. _Sep. Sci. Technol._ 56, 1001–1013 (2020). Article Google
Scholar Download references FUNDING Open access funding provided by The Science, Technology & Innovation Funding Authority (STDF) in cooperation with The Egyptian Knowledge Bank (EKB).
This work was partially supported by The Science, Technology & Innovation Funding Authority (STDF) of Egypt, project number SCSE-31235. AUTHOR INFORMATION AUTHORS AND AFFILIATIONS *
Department of Chemical Engineering, Faculty of Engineering, Minia University, Minia, Egypt Mohamed A. El-Nemr * Department of Chemical Engineering, Faculty of Engineering, Osmaniye Korkut
Ata University, 80000, Osmaniye, Türkiye Murat Yılmaz * Environment Division, National Institute of Oceanography and Fisheries, Kayet Bey, El-Anfoushy, Alexandria, Egypt Safaa Ragab, Mohamed
A. Hassaan & Ahmed El Nemr Authors * Mohamed A. El-Nemr View author publications You can also search for this author inPubMed Google Scholar * Murat Yılmaz View author publications You
can also search for this author inPubMed Google Scholar * Safaa Ragab View author publications You can also search for this author inPubMed Google Scholar * Mohamed A. Hassaan View author
publications You can also search for this author inPubMed Google Scholar * Ahmed El Nemr View author publications You can also search for this author inPubMed Google Scholar CONTRIBUTIONS
M.A.E. conceived the paper's main idea and performed the experiment and theoretical calculation. M.Y. wrote the original manuscript. S.R. and M.A.H. helped in prepare the
characterization analyses, and contributed various comments and ideas to help improve the overall quality of the research. A.E.N. designed the experiment, supervised the work, and revised
the manuscript. All authors have reviewed and approved the paper in its published form. CORRESPONDING AUTHOR Correspondence to Ahmed El Nemr. ETHICS DECLARATIONS COMPETING INTERESTS The
authors declare no competing interests. ADDITIONAL INFORMATION PUBLISHER'S NOTE Springer Nature remains neutral with regard to jurisdictional claims in published maps and institutional
affiliations. RIGHTS AND PERMISSIONS OPEN ACCESS This article is licensed under a Creative Commons Attribution 4.0 International License, which permits use, sharing, adaptation, distribution
and reproduction in any medium or format, as long as you give appropriate credit to the original author(s) and the source, provide a link to the Creative Commons licence, and indicate if
changes were made. The images or other third party material in this article are included in the article's Creative Commons licence, unless indicated otherwise in a credit line to the
material. If material is not included in the article's Creative Commons licence and your intended use is not permitted by statutory regulation or exceeds the permitted use, you will
need to obtain permission directly from the copyright holder. To view a copy of this licence, visit http://creativecommons.org/licenses/by/4.0/. Reprints and permissions ABOUT THIS ARTICLE
CITE THIS ARTICLE El-Nemr, M.A., Yılmaz, M., Ragab, S. _et al._ Isotherm and kinetic studies of acid yellow 11 dye adsorption from wastewater using _Pisum Sativum_ peels microporous
activated carbon. _Sci Rep_ 13, 4268 (2023). https://doi.org/10.1038/s41598-023-31433-x Download citation * Received: 22 December 2022 * Accepted: 11 March 2023 * Published: 15 March 2023 *
DOI: https://doi.org/10.1038/s41598-023-31433-x SHARE THIS ARTICLE Anyone you share the following link with will be able to read this content: Get shareable link Sorry, a shareable link is
not currently available for this article. Copy to clipboard Provided by the Springer Nature SharedIt content-sharing initiative