- Select a language for the TTS:
- UK English Female
- UK English Male
- US English Female
- US English Male
- Australian Female
- Australian Male
- Language selected: (auto detect) - EN
Play all audios:
ABSTRACT In the absence of a systematic approach to epidemiological modeling in Slovenia, various isolated mathematical epidemiological models emerged shortly after the outbreak of the
COVID-19 epidemic. We present an epidemiological model adapted to the COVID-19 situation in Slovenia. The standard SEIR model was extended to distinguish between age groups, symptomatic or
asymptomatic disease progression, and vaccinated or unvaccinated populations. Evaluation of the model forecasts for 2021 showed the expected behavior of epidemiological modeling: our model
adequately predicts the situation up to 4 weeks in advance; the changes in epidemiologic dynamics due to the emergence of a new viral variant in the population or the introduction of new
interventions cannot be predicted by the model, but when the new situation is incorporated into the model, the forecasts are again reliable. Comparison with ensemble forecasts for 2022
within the European Covid-19 Forecast Hub showed better performance of our model, which can be explained by a model architecture better adapted to the situation in Slovenia, in particular a
refined structure for vaccination, and better parameter tuning enabled by the more comprehensive data for Slovenia. Our model proved to be flexible, agile, and, despite the limitations of
its compartmental structure, heterogeneous enough to provide reasonable and prompt short-term forecasts and possible scenarios for various public health strategies. The model has been fully
operational on a daily basis since April 2020, served as one of the models for decision-making during the COVID-19 epidemic in Slovenia, and is part of the European Covid-19 Forecast Hub.
SIMILAR CONTENT BEING VIEWED BY OTHERS AGE-STRATIFIED DISCRETE COMPARTMENT MODEL OF THE COVID-19 EPIDEMIC WITH APPLICATION TO SWITZERLAND Article Open access 04 December 2020 ENHANCING
COVID-19 FORECASTING PRECISION THROUGH THE INTEGRATION OF COMPARTMENTAL MODELS, MACHINE LEARNING AND VARIANTS Article Open access 19 August 2024 USING MECHANISTIC MODEL-BASED INFERENCE TO
UNDERSTAND AND PROJECT EPIDEMIC DYNAMICS WITH TIME-VARYING CONTACT AND VACCINATION RATES Article Open access 28 November 2022 INTRODUCTION The COVID-19 pandemic forced nations worldwide to
suspend significant parts of their social and economic activities1. In Slovenia, SARS-CoV-2 was first detected in March 2020, and containment measures soon followed2. Especially before the
development and rollout of vaccines against SARS-CoV-2, such non-pharmaceutical interventions were the only means available to countries to slow down coronavirus infection rates and avoid
overburdening health care systems. Because of potentially high social and economic costs of containment measures, it is important to make informed decisions about when to implement them and
at what scale. A useful tool for predicting and controlling the evolution of infectious diseases and understanding the impact of public health interventions is mathematical epidemiological
modeling3. In the absence of a systematic approach to mathematical epidemiological modeling in Slovenia, various isolated mathematical epidemiological models emerged shortly after the
outbreak of the COVID-19 epidemic. To benefit from more systematic access to epidemiological data and peer-review process, some of them4,5,6,7 gathered around the emerging web portal
COVID-19 Sledilnik2. Soon COVID-19 Sledilnik was widely accepted as a portal for aggregation, analysis, and representation of COVID-19 epidemiological data in Slovenia, and the results of
some models4,7 were used by government decision-makers. In this work, we present an epidemiological model adapted to the COVID-19 epidemic in Slovenia7. The standard SEIR model3 was extended
to distinguish between age groups, symptomatic or asymptomatic disease progression, and vaccinated or unvaccinated populations. Similar extensions of SEIR-like models have been widely used
in the COVID-19 crisis, for example, to account for undetected infections, different stages of infection or age groups8,9,10,11,12,13, the effects of vaccination and coexistence of different
viral variants14, to study different behavioral responses to public health interventions15,16, or to forecast burden of epidemics on health care systems17. The model presented in this paper
has been fully operational on a daily basis since April 2020, served as a decision support tool during the COVID-19 epidemic in Slovenia, was used for COVID-19 Sledilnik data analyses2, and
has been included in the European Covid-19 Forecast Hub18 coordinated by the European Centre for Disease Prevention and Control. The rest of the paper is organized as follows. In the
Methods section, the structure of the model with all its extensions, the outputs of the model, and the model evaluation methodology are explained. The model forecasts were evaluated for the
years 2021 and 2022. The epidemic situation in Slovenia in 2021 and 2022 is described together with the evaluation results in the Results section and discussed in the following section.
Before the final conclusions of the paper, the limitations of the model are explained. METHODS MODEL We developed a deterministic age-structured compartmental model of SARS-CoV-2
transmission with a population stratified into 5 age groups. The model was constructed by extending the standard SEIR model3 with additional compartments to model symptomatic and
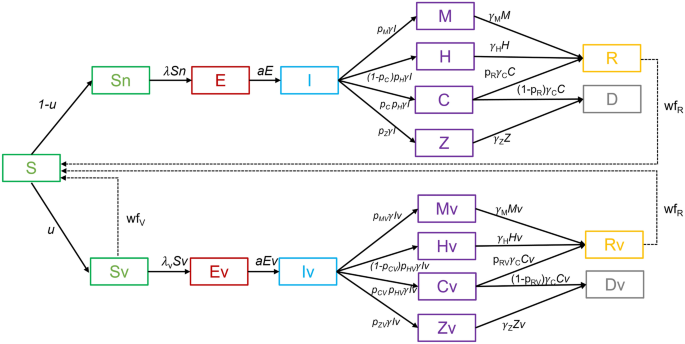
asymptomatic disease progression and to model vaccinated and unvaccinated populations separately. EXTENDED COMPARTMENTAL SEIR MODEL We extended the standard SEIR model, by adding
compartments to consider different courses of COVID-19 disease, as shown in Fig. 1. Those who are susceptible to the disease (compartment S) may become infected and enter the incubation
state (compartment E), after some time they become infectious (compartment I) and begin to recover from the infection in different ways. Most people can have an infection with mild symptoms
or are asymptomatic (compartment M) and then recover from the infection (compartment R). This is the pathway S → E → I → M → R in the model. Some have severe symptoms requiring
hospitalization (compartment H), where they may remain until further recovery (compartment R). This is the pathway S → E → I → H → R in the model. Some of the patients require additional
intensive care (compartment C). Patients in the intensive care units may recover and go to compartment R, this is the pathway S → E → I → C → R, or die, this is the pathway S → E → I → C → D
in the model. There is an additional compartment Z for modeling people who died from COVID-19 but were not treated in hospitals. This corresponds to the pathway S → E → I → Z → D in the
model. This compartment was added during the second wave of COVID-19 in Slovenia in the fall/winter of 2020, when Slovenia witnessed severe outbreaks of SARS-CoV-2 in nursing and retirement
homes and could not treat all severely ill people in hospitals. In the following waves of the epidemic, such a course of the disease was rare. The above idea was applied separately to
vaccinated and unvaccinated populations. The joint model was then merged from these two submodels by dividing the susceptible group (S) into two subgroups, Sn and Sv, representing the
unvaccinated and vaccinated susceptibles, respectively. The split of the susceptible group into Sn and Sv is defined by the parameter _u_, which represents the proportion of vaccinated at a
given time. As can be seen from Fig. 1, the two submodels have identical compartments but differ in parameters related to the probability of infection, severity of disease, and possibility
of death. All the parameters of the model are summarized in Table 1. The parameters can be broadly divided into three groups: the proportion parameters, the duration parameters, and the
parameters corresponding to the transmission of the infection. The proportion parameters are vaccination rate \(u\left(t\right)\), the proportion of mild/asymptomatic infections
\({p}_{M}\left(t\right)\), the proportion of hospitalizations \({p}_{H}\left(t\right)\), the proportion of intensive care hospitalizations \({p}_{C}\left(t\right)\), the proportion of
hospitalizations resulted in death \(1-{p}_{R}\left(t\right),\) and the proportion of deaths outside hospital care \({p}_{Z}\left(t\right)\). All these parameters are estimated daily using
data on confirmed positive cases, regular and intensive care hospitalizations, deaths, and vaccination progress. Duration parameters correspond to the latent period duration 1/a(t), the
infectious period duration 1/\(\gamma \left(t\right)\), the mild/asymptomatic period duration 1/\({\gamma }_{M}\left(t\right)\), the intensive care hospitalization 1/\({\gamma
}_{C}\left(t\right)\), the non-ICU hospitalization 1/\({\gamma }_{H}\left(t\right)\), and the pre-death duration 1/\({\gamma }_{Z}\left(t\right)\) of patients in nursing/retirement homes. It
should be noted that from a mathematical point of view, the compartment of exposed individuals (E) can often be omitted by appropriately including the latent period in the infectious
period. In this work, we treated the compartment E separately to preserve the epidemiological perspective of the existing incubation period after infection with SARS-CoV-2. This group also
includes two durations of waning immunity: the period of waning immunity after disease 1/\({wf}_{R}\left(t\right)\) and the period of waning immunity after vaccination
1/\({wf}_{V}\left(t\right)\). The time 1/\({wf}_{R}\left(t\right)\) corresponds to the mean duration, in which the patient becomes susceptible to re-infection, the time
1/\({wf}_{V}\left(t\right)\) represents the mean duration, in which the vaccinated person becomes susceptible to infection. The two durations of waning immunity are set to a longer period,
e.g., one year, which means that in one year those who have been vaccinated or recovered from the disease will again become susceptible. Both rates are included in the model so that the
proportion of those vaccinated or recovered that migrate back to the susceptible class decreases exponentially over time. In this way, we have also attempted to include in the model the
efficacy of the vaccine, which changes over time. Disease transmission is included in the model by the parameters \(\lambda \left(t\right)\) corresponding to the force of infection3, which
are computed in the age-stratified extended SEIR model described in the next section. AGE-STRATIFIED EXTENDED SEIR MODEL The SEIR model from the previous section has been additionally
extended to model five age groups of the population. This was done by cloning a structure of the base model (Fig. 1) five times and allowing population mixing across all age subgroups from
these submodels. The resulting extended SEIR model is shown in Fig. 2. Each submodel of the model schemed in Fig. 2 allows for modeling of the same disease courses and has the same
parameters as the base SEIR model shown in Fig. 1, whereby the values of the parameters in the submodels may differ. We chose to model five age groups of the population to obtain an
age-stratified model that better fits the epidemiological situation with the age-dependent vaccination strategy in Slovenia and the different severity of disease progression within different
age groups. Disease transmission in this model is defined by assuming mixing of populations between age groups and between vaccinated and unvaccinated groups. The force of infection in each
submodel is computed as $$ \lambda_{i} \left( t \right) = \mathop \sum \limits_{j = 1}^{5} \beta_{ij} \left( t \right) \cdot I_{j} \left( t \right) + \mathop \sum \limits_{j = 1}^{5}
\beta_{ij} \left( t \right) \cdot Iv_{j} \left( t \right), $$ (1) where \(\lambda_{i} (t)\) is the force of infection in the submodel representing age group _i_, and is computed as the sum
over all age groups of the rates of how many unvaccinated and vaccinated infected individuals from the age group _j_, denoted by _I__j_ and _Iv__j_, infect susceptibles from the age group
_i_. The rates for each combination of the groups _i_ and _j_ are computed as \(\beta_{ij} (t) \cdot I_{j} (t)\), where \(\beta_{ij} (t)\) represents the contact rate between individuals of
group _i_ and individuals of group _j_. Contact rates \(\beta_{ij} (t)\) are computed as \(\beta_{ij} (t) = \beta (t) \cdot w_{ij} (t)\), where \(\beta (t)\) is an overall transmission rate
of the disease, and \(w_{ij} (t)\) are the weights for increasing or decreasing the transmission rate according to the assumed contact mixing of the groups _i_ and _j_. The weights are
stored in the contact matrix _W_. The overall transmission rate \(\beta (t)\) is computed as a product of the effective reproduction number _R_(_t_) and the mean infectious period 1/\(\gamma
(t)\), namely \(\beta (t) = R(t)/\gamma (t)\). Note that the forces of infection of vaccinated groups, \(\lambda v_{i} (t)\), are the same as \(\lambda_{i} (t)\) reduced by a specific
factor _f_IV(_t_) that accounts for the effectiveness of vaccination in reducing transmission of the disease (see Table 1). This was done in a similar way as in11,12, where the force of
infection of the vaccinated group was reduced by the percentage of the reduced infections due to vaccination. MODEL OUTPUTS The model produces the following projections for each age group:
7-day averages of daily positive cases, daily non-intensive care hospitalization admissions and active stays, daily intensive care admissions and active stays, and 7-day averages of deaths.
The projections are additionally summarized across all age groups to obtain overall projections. From these projections, we derived cumulative projections of positive cases,
hospitalizations, intensive-care hospitalizations and total deaths. In addition, the model also generates weekly incidence of positive cases, hospitalizations and deaths. PARAMETERS
COMPUTATION AND MODEL OPTIMIZATION The model is calibrated to the current state of the epidemic in Slovenia by adjusting the model parameters in Table 1. All parameters are treated as
functions of time, so their values may change over time according to the varying epidemiological situation. While some model parameters are calculated daily, others are estimated by
observing the dynamics of the epidemic in the population, and some are set according to the literature and mainly remain fixed over time. We performed the optimization routine to minimize
the error of the model projections on four different objective functions: daily reported infections, daily deaths, daily reported number of current hospitalizations not requiring intensive
care and daily reported number of current hospitalizations requiring intensive care. All the data for tuning the parameters were collected from COVID-19 Sledilnik2 and the Slovenian National
Institute of Health19. We collated the population into 5 age groups: 0–24, 25–44, 45–64, 65–74, and older than 75. This age grouping was chosen because, from a clinical point of view, these
groups represent in some cases the finest granularity we could find in the data, and from a computational point of view, it reduces the dimension of the optimization problem12. The
parameters estimated daily are the forces of infection \({\lambda }_{i}\left(t\right)\) and the vaccination rates \({u}_{i}\left(t\right)\) in each age group _i_. The force of infection
\({\lambda }_{i}\left(t\right)\) is calculated according to Eq. (1). For these computations we need the daily estimated effective reproduction number _R_(_t_) weighted by the contact matrix
_W._ The reproduction number _R_(_t_) is estimated from the time-series of daily reported infections by using the EpiNow2 CRAN R package20, while the contact matrices _W_(_t_) were set
manually by following21 and corrected over time to follow the current epidemiological interventions in the population. The vaccination rates are computed directly from the data of the daily
reported vaccination rates in the collated age groups provided by the Slovenian National Institute of Health19. The proportions \({p}_{H}\left(t\right)\), \({p}_{C}\left(t\right)\),
\({p}_{Z}\left(t\right)\) and \({p}_{R}\left(t\right)\) are also determined daily. The proportion of hospitalizations \({p}_{H}\left(t\right)\) is estimated from the ratio of the time-series
of daily active confirmed cases and the hospital stays; the proportion of intensive care hospitalizations \({p}_{C}\left(t\right)\) is determined from the time-series of intensive care and
non-intensive care hospitalizations; and the proportion of hospitalizations resulted in death, \(1-{p}_{R}\left(t\right),\) is computed from the time-series of hospitalization data and
reported deaths. The proportion of deaths outside hospital care \({p}_{Z}\left(t\right)\) was used in the second wave in Slovenia and was estimated from the time-series data of hospital
deaths and all reported deaths due to COVID-19 in Slovenia in that wave. In all other cases it was set to 0. All these proportions are estimated separately for each age group. For example,
the proportions of hospitalizations or deaths are much lower in the 0–24 age group than in the 75+ age group. Similarly, the vaccination rates also differ greatly in time between age groups,
etc. The duration parameters 1/a(t), 1/\(\gamma \left(t\right)\), 1/\({\gamma }_{M}\left(t\right)\), 1/\({\gamma }_{C}\left(t\right)\), 1/\({\gamma }_{H}\left(t\right)\), 1/\({\gamma
}_{Z}\left(t\right)\) and the durations of waning immunity 1/\({wf}_{R}\left(t\right)\), 1/\({wf}_{V}\left(t\right)\) are determined manually. They were set according to the literature and
remain mainly fixed over time. We changed them only in cases of different SARS-CoV-2 variants when suggested in the literature22,23,24. The optimization and additional calibration of the
model are performed daily in the following way. The effective reproduction number _R_(_t_), the proportions \({p}_{iH}\left(t\right)\), \({p}_{iC}\left(t\right)\),
\({p}_{iZ}\left(t\right)\), \({p}_{iR}\left(t\right)\) and the vaccination rates \({u}_{i}\left(t\right)\) are computed daily from the time-series data of daily active confirmed cases,
intensive care and non-intensive care hospitalizations, reported deaths and vaccination reports. The estimation of the proportion parameters of the model is performed using the past data
from the beginning of the modeling because this process is not computationally intensive, while the effective reproduction number is estimated based on one-year of past data. Several runs of
the model are performed, perturbing the parameters around these estimated values (by using perturbation range of \(\pm 10\text{\%}\)). The resulting model projections are additionally
calibrated in each run by automatically adjusting the proportion parameters so that the resulting projections better fit the objective functions on the past data. Typically, 100 runs are
made in such an optimization procedure, resulting in 100 instances of model projections. The final projections are created using the median values of these instances. By estimating
appropriate quantiles from these instances, we also estimate the 50%- and 95%-confidence intervals of the final projections. MODEL EVALUATION We have conducted two evaluations of the model:
one for the year 2021 (SI-2021 evaluation) and one as part of the European Covid-19 Forecast Hub18, in which we have participated with our model since December 2021 (EUHub-2022 evaluation).
In both assessments, we focused on three forecast targets: the weekly incidence of new COVID-19 cases, the weekly incidence of new COVID-19 hospitalizations (intensive care and non-intensive
care), and the weekly incidence of new COVID-19 deaths in Slovenia. In the SI-2021 evaluation, forecasts were compared with data from COVID-19 Sledilnik2. In the EUHub-2022 evaluation,
forecasts were compared with data provided by the European Covid-19 Forecast Hub18, which relies on data from the Johns Hopkins University (for cases and deaths) and data collated by ECDC
from national health authorities (for hospitalizations). Forecasts were made for 1, 2, 3, and 4 weeks ahead, with forecasts calculated each Monday from data up to the last Sunday. Thus, the
parameters of the model were estimated from past data, and forecasts were made for up to 4 weeks in advance. Possible future interventions planned by the health authorities to change
epidemic dynamics were not considered. Consequently, we assessed the short-term forecasts of the model rather than different possible scenarios according to planned changes in epidemics. The
quality of the forecasts in the SI-2021 evaluation was assessed graphically and by calculating two error statistics. The graphical observations were used to estimate the accuracy of the
model over time, while the overall performance of the model was measured by the two error statistics. The absolute differences \(RAE_{i} = \left| {y_{i} - \hat{y}_{i } } \right|/ y_{i }\)
were calculated for a set of observations \(y_{i} , i = 1, \ldots , n\) and point predictions \(\hat{y}_{i} , i = 1, \ldots ,n\). The first error statistic was then computed as the median of
\(RA{E}_{i}\) with interquartile range to compensate for possible outliers in the forecast errors. To obtain a more scale-free error statistic, we compared the model forecasts with baseline
forecasts. The baseline forecasts were constructed as forecasts by repeating an observation from the current week four times to predict future observations 4 weeks in advance. The
comparison of forecast errors was then measured using a ratio \(\theta =\)(mean of \(RA{E}_{i}\) of our model)/(mean of \(RA{E}_{i}\) of baseline model). The ratio \(\theta \) is a measure
of the relative performance of our model compared to the baseline model. For \(\theta <1\) our model outperforms the baseline model, and for \(\theta >1\) the baseline model is better.
This measure was developed according to Cramer et al.25. In the EUHub-2022 evaluation, we reported evaluation results according to the European Covid-19 Forecast Hub reporting style, using
the relative weighted interval score (rel.wis) for the evaluation metric, as described in Cramer et al.25. Comparisons of our model were made with the ensemble and the baseline EuroCOVIDhub
models26, which were evaluated on the Slovenian data. RESULTS EPIDEMIC SITUATION IN SLOVENIA IN YEARS 2021 AND 2022 Slovenia started 2021 with a peak of COVID-19 cases from a prolonged
second wave that had already begun in the summer of 2020, and rapid antigen testing (RAT) and vaccination against COVID-19 were introduced in late 20202,19,27,28. As shown in Fig. 3a, after
a brief decline in cases in March 2021, the number of COVID-19 infections, predominantly with the Alpha variant, which was more than 50% more transmissible in humans compared with the
original virus, began to rise again. The proportion of vaccinated individuals in Slovenia at that time was approximately 9%, including 5% with completed initial vaccination protocol. To stop
the rise in infections, a partial lockdown was imposed in early April, by keeping education and work at a distance, restricting movement, and limiting entry and exit from the country. To
visit certain establishments, bars, or shelters, people had to be vaccinated, tested, or show proof of recovery (3G rule). By summer, the number of COVID-19 infections in Slovenia had
decreased significantly, after which the measures were relaxed2,19,27,28. In August 2021, the number of COVID -19 infections in Slovenia started to rise again. At the beginning of the new
school year in September, about 50% of Slovenians were vaccinated, with 45% of the population fully vaccinated. Due to the steady increase in Delta variant infections, the government
reintroduced the 3G rule for most of social life on September 15. Measures included restricting social life, limiting the number of people engaged in economic activity, mandatory wearing of
surgical or FFP2 masks, and self-testing (3 times per week) for unvaccinated school children, students, and employees in all activities. The increase in infections stalled, but in October
the number of new infections began to rise again, reaching a record of more than 22.000 weekly confirmed cases in early November. Slovenia was on the verge of another lockdown as the
capacity of 300 beds in intensive care units had almost been reached. The maximum of 288 occupied intensive care unit beds was reached on November 252,19,27,28, without any further
implementation of a lockdown. By the end of 2021, 60% of people had been vaccinated, 57% of the population with two doses. The fifth epidemic wave (Fig. 3b) began with the first Omicron
variant case confirmed in Slovenia on December 14, and with stricter restrictions over New year holidays. A dramatic increase in infections followed in January 2022, with the wave peaking on
January 31 with a weekly incidence of confirmed COVID-19 cases of nearly 100,000 (nearly 5% of the country’s population). It should be noted that despite the record number of confirmed
cases, the number of hospitalizations and deaths was not higher than in the previous waves, due in part to the fact that infections with the Omicron variant are often milder than with the
Delta variant, and in part to the high vaccination rate in the elderly population. Thereafter, numbers began to decline more rapidly than in previous waves, and measures were gradually
relaxed. Entry restrictions and quarantine were lifted, the 3G rule was abolished (except for certain high-risk activities), and a less strict mask-wearing regime was introduced. The
percentage of vaccinated individuals had not improved significantly from data at the end of 20212,19,27,28. MODEL FORECASTS EVALUATION FOR SLOVENIA IN YEAR 2021 Figures 4, 5, and 6 show
model forecasts for the weekly incidence of COVID-19 confirmed cases, hospitalizations, and deaths in Slovenia in 2021, respectively. More detailed versions of these graphs can be found
online29. According to the figures, the accuracy of model forecasts over time depends on the epidemiological situation. The model forecast is less accurate at the beginning and near the peak
of the wave, whereas it is more accurate in periods of rising or falling of the wave. This pattern can be clearly seen in the weekly incidence of cases (Fig. 3) and in the weekly incidence
of hospital admissions (Fig. 4), while the forecasts of the weekly incidence of deaths (Fig. 6) are more aligned with the actual data even for 4 weeks ahead. The overall assessment of the
model forecasts for the year 2021 is summarized in Table 2. It can be seen that the median of _RAE_ for the weekly incidence of confirmed cases, hospitalizations, and deaths is below or
around 10% and exceeds this value only for the forecasts of confirmed cases for 4 weeks ahead and the forecasts of hospitalizations for 3 and 4 weeks ahead. The median of _RAE_ for the
weekly incidence of confirmed cases is only about 3% for the 1-week-ahead forecast, with the Q3 quartile barely reaching 4%. For the longer-term forecasts, the error statistics become
larger, as expected, but the median of RAE for the forecast of confirmed cases for 3 weeks ahead is still only about 6%. The relative performance of the model to the baseline model was
measured by the ratio \(\theta \). The values \(\theta \) are in all forecasts well below 1.0, indicating that our model outperformed the baseline forecasts in all cases. For almost all
forecasts in Table 2, the values are even below 0.5, which means that our model almost always provides a forecast that is more than twice as good as the baseline model. For the forecasts of
confirmed cases for 1 and 2 weeks ahead and deaths for 3 and 4 weeks ahead, the values \(\theta \) are even below 0.2, which means that we can expect a more than 80% better prediction
compared to the baseline model. MODEL FORECASTS EVALUATION WITHIN EUROPEAN COVID-19 FORECAST HUB FOR YEAR 2022 The evaluation of the model for the first three months of 2022 was conducted as
part of the European Covid-19 Forecast Hub project. The evaluation results in Table 3 show the relative weighted interval score (rel.wis) for three models: our model (named ULZF-SEIRC19SI
in the table), the ensemble model (named EuroCOVIDhub-ensemble in the table) and the baseline model (named EuroCOVIDhub-baseline in the table). The evaluation was performed using data from
January 1, 2022 to March 28, 2022. The ensemble is built from all of the models providing forecasts for Slovenia (9 for the weekly incidence of cases, 4 for the weekly incidence of hospital
admissions, and 7 for the weekly incidence of deaths). The baseline forecasts are computed in the same way as in the previous evaluation. Note also that the relative interval score is the
evaluation measure that compares the performance of the evaluated model to all other models, with values below 1.00 indicating better performance (lower error) of the evaluated model
relative to its compared counterparts. More details can be found in Cramer et al.25. According to the results in Table 3, our model outperformed the ensemble model in almost all forecasts in
all three categories. For the forecasts of weekly incidence of cases, our model performed better in all 4 forecasts, with a larger gap in the long-term forecasts. The forecasts of hospital
admissions are almost the same for weeks 2, 3, and 4, whereas there is a higher gap in favor of our model for the forecast for 1 week ahead. The weekly incidence of deaths is better
forecasted for 1 week ahead with the ensemble model, and for 2, 3, and 4 weeks ahead with our model. DISCUSSION The accuracy of the model over time clearly depends on the epidemiological
situation, as can be seen in Figs. 2, 3, and 4. The forecasts are less accurate at the beginning and near the peak of the two epidemiologic waves in 2021. Both waves in 2021 were caused by
new variants of the SARS-CoV-2 virus with different transmission characteristics. The timing of the introduction of a new viral variant into the population can be speculated, but not
accurately predicted. Therefore, forecasts of the onset of waves caused by new variants with different transmission characteristics cannot be accurate. However, when the new viral variant
was detected and its transmission properties were incorporated into the model, model forecasts became more reliable and could accurately predict the peak of the wave, assuming no additional
public health measures were introduced that could affect epidemiologic dynamics. However, in both waves in 2021 in Slovenia (April 2021 and October-December 2021), a number of public health
measures were introduced to slow down the transmission dynamics. Accordingly, at the beginning of the waves, we could not include the changes in transmission due to the measures in the
model. As a result, the long-term forecasts predicted peaks without any interventions. The moment the interventions were included in the model, the predictions became more accurate. Errors
both at the onset and near the peak of the waves are therefore to be expected and are well known in epidemiological modeling30,31,32. Transmission characteristics of new virus variants were
incorporated into the model by estimating the effective reproduction number _R_, whereas interventions were accounted for by changes in the contact matrix _W_. The correct estimation of _R_
and contact matrices remains a difficult task and depends strongly on the model structure on the one hand and on the behavior of people during the epidemic on the other33,34. It should also
be noted that a vaccination campaign was underway in Slovenia in 2021, where 5% of the population, primarily the elderly, was fully vaccinated at the start of the first wave in March 2021,
and the second wave started in September 2021 with 45% of the population fully vaccinated. Vaccination was carefully included in the model by dividing the population into age groups and
modeling vaccinated and unvaccinated populations separately, following the modeling approach presented by Matrajt et al.11,12. This allowed us to more accurately include and track the
vaccination strategy in Slovenia, resulting in more accurate predictions of hospitalizations and deaths. Our model also shows an overall better performance compared to the base model and the
ensemble model35 in the European Covid-19 Forecast Hub 2022 evaluation. Although the model is expected to outperform the baseline model, this should not be the case for the ensemble model.
Nevertheless, in the model assessment of the first three months of 2022, conducted as part of the European Covid-19 Forecast Hub project, our model performed better than the ensemble model
in almost all cases. The epidemic situation in Slovenia in early 2022 coincided with a large wave of daily confirmed cases that peaked in early February 2022, whereas hospitalizations and
deaths did not follow this pattern. This was due to the Omicron variant of the SARS-CoV-2 virus, which is highly transmissible and does not cause as many severe courses of disease as earlier
variants36. The model could not predict the exact timing of the onset of the Omicron wave, but later, when the model was updated with the features of the new variant and since there were no
interventions that caused substantial changes in epidemic dynamics, we were able to accurately predict the timing and height of the peak of the wave as well as the decline. More precise
tuning of the proportion parameters in the model and separate vaccination modeling allowed our forecasts to more accurately predict hospitalizations and deaths, although they did not follow
the same pattern as in previous waves. Since our model is one of the models included in the ensemble for Slovenian forecasts within the European Covid-19 Forecast Hub, better results mean
that our model forecasts were among the best among all other models. A closer look at the evaluation results of the European Covid-19 Forecast Hub 2022 shows that among the models providing
forecasts for Slovenia, our model performed best in all cases of forecasting hospitalizations and deaths, while ranked first for week 1 and second for weeks 2, 3, and 4 for weekly incidence
of confirmed cases. The better forecasts in these cases were from the USC-SLKJalpha model37. The overall better performance of our model compared with other models for the Slovenian
forecasts could be explained by a more appropriate structure of the model for the epidemic situation in Slovenia, in particular by a more refined structure for vaccination and by more and
better parameter tuning made possible by the data provided by COVID-19 tracker for Slovenia2. MODEL LIMITATIONS Our model is a compartmental model, in which the epidemic dynamics within the
modelled subgroups of the population are assumed to be homogeneous. We introduced the heterogeneity of transmission to the model by dividing the population into five age groups and modeling
the vaccinated and unvaccinated populations separately. But this might not be sufficient to capture the actual dynamics of transmission in the population. This problem could be addressed
with other modeling approaches, such as agent-based or network-based modeling38,39. However, such modeling introduces a lot of open parameters that need to be estimated using data from
different sources (e.g., mobility, localization data, more individual data) that were not available during the epidemics in Slovenia. Therefore, we opted for a less complex and
well-established compartmental model, but with extensions that allowed us to increase the model's accuracy by adding the compartments and parameters that can be estimated from the data
we have. It should be noted here that the model can be also extended to other groups of population, for example to model individual regions in Slovenia. This would probably lead to better
estimates of the epidemic waves in Slovenia, but since only the data of infections are individually reported for regions and municipalities, and no other data, the model could not be
reliably estimated. Nevertheless, our model has more than 100 parameters that need to be properly determined. Since many parameters in the model are arbitrarily estimated and may not fully
reflect the actual epidemic situation, we attempted to compensate for this by performing an additional calibration of the proportion parameters in the model optimization process. This
calibration tries to change the proportion parameters of the model (e.g., the proportion of hospitalizations, the proportion of intensive care, deaths, etc.) to better fit the model
projections to the actual data, even if the parameters would no longer reflect the actual situation in the data. In this way, we achieve a better fit of the model projections to the current
and past data and compensate for some loosely/arbitrarily estimated open parameters of the model. In addition, the model forecasts rely only on current data, and we did not attempt to
incorporate any expected future interventions into the model, even if they could be predicted based on the model projections. Therefore, the forecasts tend to predict what would happen
without possible future interventions or other unexpected situations. In daily operational runs of the model, we also created additional scenarios for situations in which a new epidemiologic
wave or a new variant of the SARS-CoV-2 virus was expected. Note that epidemiological forecasts and other epidemiological statistics for Slovenia are calculated daily with our model
starting in April 2020. All the results can be found on our web page7. CONCLUSION The presented compartmental model is used for modeling the COVID-19 epidemic in Slovenia. The SEIR model was
extended by dividing the population into five age groups and allowing separate modeling of vaccinated and unvaccinated populations, to better account for the vaccination strategy in
Slovenia as well as various courses of the disease and transmissibility caused by different SARS-CoV-2 variants. The model was extended to the complexity at which the model parameters can
still be reliably estimated from the epidemiological data available in Slovenia. Despite the known limitations of such modeling, we were able to obtain acceptable forecast results for
short-term forecasts for up to 4 weeks in advance. Evaluation of model forecasts for 2021 showed the expected behavior of epidemiological modeling: if we do not interfere with disease
dynamics, the model predicts the situation well; the changes in epidemiologic dynamics due to the emergence of a new viral variant in the population or the introduction of new interventions
cannot be predicted by the model, but when the new situation is incorporated into the model, the forecasts are again reliable. Comparison of model forecasts with the ensemble forecasts for
2022 within the European Covid-19 Forecast Hub showed better performance of our model, which can be explained by a more appropriate structure of the model for the epidemic situation in
Slovenia, in particular a more refined structure for vaccination, and better parameter tuning enabled by the more comprehensive data for Slovenia included in our modeling. The model has been
fully operational on a daily basis since April 2020 and served as one of the models for decision-making during the COVID-19 epidemic in Slovenia. The model is also part of the European
Covid-19 Forecast Hub, coordinated by the European Centre for Disease Prevention and Control. DATA AVAILABILITY The data that support the findings of this study are openly available at
https://covid-19.sledilnik.org/ and https://github.com/sledilnik. Sources of the model described in this study can be found at https://github.com/janezz25/SEIR-C19-SI. REFERENCES * World
Health Organization. Coronavirus disease (COVID-19) Pandemic. 2022 (accessed 26 Mar 2022); https://www.who.int/emergencies/diseases/novel-coronavirus-2019/. * COVID-19-sledilnik. 2020
(accessed 26 March 2022); https://covid-19.sledilnik.org/. * Keeling, M. J., Rohani, P. Modeling Infectious Diseases in Humans and Animals. (Princeton University Press, 2008, accessed 26
March 2022); https://doi.org/10.1515/9781400841035/html. * Leskovar, M. & Cizelj, L. Robust and intuitive model for COVID-19 epidemic in Slovenia. _Stroj. vestn. J. Mech. Eng._ 68,
213–224 (2022). Article Google Scholar * Zaplotnik, Ž, Gavrić, A. & Medic, L. Simulation of the COVID-19 epidemic on the social network of Slovenia: Estimating the intrinsic forecast
uncertainty. _PLoS ONE_ 15, e0238090 (2020). Article CAS Google Scholar * Manevski, D., Ružić Gorenjec, N., Kejžar, N. & Blagus, R. Modeling COVID-19 pandemic using Bayesian analysis
with application to Slovene data. _Math. Biosci._ 329, 108466 (2020). Article MathSciNet CAS Google Scholar * Žibert, J. COVID-19 SI. APPS LUSY. 2022 (accessed 15 May 2022);
https://apps.lusy.fri.uni-lj.si/. * Barbarossa, M. V. _et al._ The impact of current and future control measures on the spread of COVID-19 in Germany. _Epidemiology_
https://doi.org/10.1101/2020.04.18.20069955 (2020). Article Google Scholar * Li, M. L. _et al._ Forecasting COVID-19 and analyzing the effect of government interventions. _Epidemiology_
https://doi.org/10.1101/2020.06.23.20138693 (2020). Article PubMed PubMed Central Google Scholar * Khailaie, S. _et al._ Development of the reproduction number from coronavirus
SARS-CoV-2 case data in Germany and implications for political measures. _BMC Med._ 19, 32 (2021). Article CAS Google Scholar * Matrajt, L., Eaton, J., Leung, T. & Brown, E. R.
Vaccine optimization for COVID-19: Who to vaccinate first?. _Sci. Adv._ 7, eabf1374 (2021). Article ADS Google Scholar * Matrajt, L. _et al._ Optimizing vaccine allocation for COVID-19
vaccines shows the potential role of single-dose vaccination. _Nat. Commun._ 12, 3449 (2021). Article ADS CAS Google Scholar * Oshinubi, K. _et al._ Age dependent epidemic modeling of
COVID-19 outbreak in Kuwait, France, and Cameroon. _Healthcare_ 10, 482 (2022). Article Google Scholar * Parolini, N., Dede’, L., Ardenghi, G. & Quarteroni, A. Modelling the COVID-19
epidemic and the vaccination campaign in Italy by the SUIHTER model. _Infect. Dis. Model._ 7, 45–63 (2022). PubMed PubMed Central Google Scholar * Chowdhury, R. _et al._ Dynamic
interventions to control COVID-19 pandemic: A multivariate prediction modelling study comparing 16 worldwide countries. _Eur. J. Epidemiol._ 35, 389–399 (2020). Article CAS Google Scholar
* Grimm, V., Mengel, F. & Schmidt, M. Extensions of the SEIR model for the analysis of tailored social distancing and tracing approaches to cope with COVID-19. _Sci. Rep._ 11, 4214
(2021). Article ADS CAS Google Scholar * Sjödin, H. _et al._ COVID-19 healthcare demand and mortality in Sweden in response to non-pharmaceutical mitigation and suppression scenarios.
_Int. J. Epidemiol._ 49, 1443–1453 (2020). Article Google Scholar * European Covid-19 Forecast Hub (accessed 12 Dec 2021); https://covid19forecasthub.eu. * National Institute of Public
Health Slovenia. 2022 (accessed 12 Dec 2022); https://www.nijz.si/sl/dnevno-spremljanje-okuzb-s-sars-cov-2-covid-19. * Abbott, S., Hellewell, J., Sherratt, K., Gostic, K., Hickson, J., Badr,
H. S., DeWitt, M., Thompson, R., EpiForecasts & Funk, S. EpiNow2: Estimate Real-Time Case Counts and Time-Varying Epidemiological Parameters (2020);
https://doi.org/10.5281/zenodo.3957489. * Prem, K., Cook, A. R. & Jit, M. Projecting social contact matrices in 152 countries using contact surveys and demographic data. _PLoS Comput.
Biol._ 13, e1005697 (2017). Article ADS Google Scholar * Lauer, S. A. _et al._ The incubation period of coronavirus disease 2019 (COVID-19) from publicly reported confirmed cases:
estimation and application. _Ann. Intern. Med._ 172, 577–582 (2020). Article Google Scholar * European Centre for Disease Prevention and Control. Updated projections of COVID-19 in the
EU/EEA and the UK. (2020); https://www.ecdc.europa.eu/sites/default/files/documents/covid-forecasts-modelling-november-2020.pdf * Zhang, J. _et al._ Changes in contact patterns shape the
dynamics of the COVID-19 outbreak in China. _Science_ 368, 1481–1486 (2020). Article ADS CAS Google Scholar * Cramer, E. Y. _et al._ Evaluation of individual and ensemble probabilistic
forecasts of COVID-19 mortality in the United States. _Proc. Natl. Acad. Sci. U S A_ 119, e2113561119 (2022). Article CAS Google Scholar * European Covid-19 Forecast Hub: Community. 2022
(accessed 6 June 2022); https://covid19forecasthub.eu/community.html. * Portal GOV.SI. 2022 (accessed 8 May 2022); https://www.gov.si/. * Our World in Data: Slovenia. 2022 (accessed 15 May
2022); https://ourworldindata.org/coronavirus/country/slovenia. * Žibert, J. Model evaluation. APPS LUSY. 2022 (accessed 6 June 2022).
https://apps.lusy.fri.uni-lj.si/~janezz/analize/eval_model_2021.html. * Roberts, M., Andreasen, V., Lloyd, A. & Pellis, L. Nine challenges for deterministic epidemic models. _Epidemics_
10, 49–53 (2015). Article Google Scholar * Castro, M., Ares, S., Cuesta, J. A. & Manrubia, S. The turning point and end of an expanding epidemic cannot be precisely forecast. _Proc.
Natl. Acad. Sci. U S A._ 117, 26190–26196 (2020). Article ADS MathSciNet CAS Google Scholar * Crépey, P., Noël, H. & Alizon, S. Challenges for mathematical epidemiological
modelling. _Anaesth. Crit. Care Pain Med._ 41, 101053 (2022). Article Google Scholar * Melegaro, A., Jit, M., Gay, N., Zagheni, E. & Edmunds, W. J. What types of contacts are important
for the spread of infections? Using contact survey data to explore European mixing patterns. _Epidemics_ 3, 143–151 (2011). Article Google Scholar * Fumanelli, L., Ajelli, M., Manfredi,
P., Vespignani, A. & Merler, S. Inferring the structure of social contacts from demographic data in the analysis of infectious diseases spread. _PLoS Comput. Biol._ 8, e1002673 (2012).
Article ADS MathSciNet CAS Google Scholar * Sherratt, K., Bosse, N. & Funk, S. EuroCOVIDhub-ensemble.
https://raw.githubusercontent.com/epiforecasts/covid19-forecast-hub-europe/main/data-processed/EuroCOVIDhub-ensemble/metadata-EuroCOVIDhub-ensemble.txt. * European Centre for Disease
Prevention and Control. Assessment of the further spread and potential impact of the SARS-CoV-2 Omicron variant of concern in the EU/EEA, 19th update. 2022 (accessed 15 May 2022);
https://www.ecdc.europa.eu/en/publications-data/covid-19-omicron-risk-assessment-further-emergence-and-potential-impact. * Srivastava, A., Xu, T. & Prasanna, V. K. Fast and Accurate
Forecasting of COVID-19 Deaths Using the SIkJα Model. 2020 (accessed 15 May 2022); http://arxiv.org/abs/2007.05180. * Perez, L. & Dragicevic, S. An agent-based approach for modeling
dynamics of contagious disease spread. _Int. J. Health Geogr._ 8, 50 (2009). Article Google Scholar * Firth, J. A., Hellewell, J., Klepac, P., Kissler, S., CMMID COVID-19 Working Group,
Kucharski, A. J., et al. Using a real-world network to model localized COVID-19 control strategies. _Nat. Med._ 26, 1616–1622 (2020). Download references FUNDING This work was supported by
Slovenian Research Agency under Research Programme P2-0250 (Grant No. ARRS-RPROG-JP_COVID19-Prijava/2020/050). AUTHOR INFORMATION AUTHORS AND AFFILIATIONS * Faculty of Health Sciences,
University of Ljubljana, Zdravstvena pot 5, 1000, Ljubljana, Slovenia Miha Fošnarič, Tina Kamenšek & Janez Žibert * Alpineon, d.o.o., Ulica Iga Grudna 15, 1000, Ljubljana, Slovenia
Jerneja Žganec Gros Authors * Miha Fošnarič View author publications You can also search for this author inPubMed Google Scholar * Tina Kamenšek View author publications You can also search
for this author inPubMed Google Scholar * Jerneja Žganec Gros View author publications You can also search for this author inPubMed Google Scholar * Janez Žibert View author publications You
can also search for this author inPubMed Google Scholar CONTRIBUTIONS All authors contributed to the study conception and design. Data collection, modeling, and analysis were performed by
J.Ž., and M.F. Material preparation was done by T.K. and J.Ž.G. The first draft of the manuscript was written by J.Ž. and all authors commented on previous versions of the manuscript. All
authors read and approved the final and the revised versions of themanuscript. CORRESPONDING AUTHOR Correspondence to Janez Žibert. ETHICS DECLARATIONS COMPETING INTERESTS The authors
declare no competing interests. ADDITIONAL INFORMATION PUBLISHER'S NOTE Springer Nature remains neutral with regard to jurisdictional claims in published maps and institutional
affiliations. RIGHTS AND PERMISSIONS OPEN ACCESS This article is licensed under a Creative Commons Attribution 4.0 International License, which permits use, sharing, adaptation, distribution
and reproduction in any medium or format, as long as you give appropriate credit to the original author(s) and the source, provide a link to the Creative Commons licence, and indicate if
changes were made. The images or other third party material in this article are included in the article's Creative Commons licence, unless indicated otherwise in a credit line to the
material. If material is not included in the article's Creative Commons licence and your intended use is not permitted by statutory regulation or exceeds the permitted use, you will
need to obtain permission directly from the copyright holder. To view a copy of this licence, visit http://creativecommons.org/licenses/by/4.0/. Reprints and permissions ABOUT THIS ARTICLE
CITE THIS ARTICLE Fošnarič, M., Kamenšek, T., Žganec Gros, J. _et al._ Extended compartmental model for modeling COVID-19 epidemic in Slovenia. _Sci Rep_ 12, 16916 (2022).
https://doi.org/10.1038/s41598-022-21612-7 Download citation * Received: 09 July 2022 * Accepted: 29 September 2022 * Published: 08 October 2022 * DOI:
https://doi.org/10.1038/s41598-022-21612-7 SHARE THIS ARTICLE Anyone you share the following link with will be able to read this content: Get shareable link Sorry, a shareable link is not
currently available for this article. Copy to clipboard Provided by the Springer Nature SharedIt content-sharing initiative