- Select a language for the TTS:
- UK English Female
- UK English Male
- US English Female
- US English Male
- Australian Female
- Australian Male
- Language selected: (auto detect) - EN
Play all audios:
ABSTRACT Immunophenotyping of bone marrow (BM) precursors has been used as an ancillary diagnostic tool in myelodysplastic syndromes (MDS), but there is no general agreement about which
variables are the most relevant for prognosis. We developed a parsimonious prognostic model based on BM cell populations well-defined by phenotype. We analyzed 95 consecutive patients with
primary MDS diagnosed at our Institution between 2005 and 2012 where BM immunophenotyping had been performed at diagnosis. Median follow-up: 42 months (4–199). Median age: 67 years (33–79).
According to IPSS-R, 71 cases were low or intermediate risk. Flow variables significant in the univariate Cox analysis: “%monocytes/TNCs”, “% CD16+ monocytes/TNCs”, “total alterations in
monocytes”, “% myeloid CD34+ cells”, “number of abnormal expressions in myeloblasts” and “% of B-cell progenitors”. In the multivariate model remained independent: “% myeloid CD34+ cells”,
B-cell progenitors” and “% CD16+ monocytes/TNCs”. These variables were categorized by the extreme quartile risk ratio strategy in order to build the score: % myeloid CD34+ cells” (≥ 2.0% = 1
point), B-cell progenitors” (< 0.05% 1 point) and “CD16+ monocytes/TNCs” (≥ 1.0% 1 point). This score could separate patients with a different survival. There was a weak correlation
between the score and IPSS-R. Both had independent prognostic values and so, the flow score adds value for the prognostic evaluation in MDS. SIMILAR CONTENT BEING VIEWED BY OTHERS
IMMUNOPHENOTYPIC ABERRANT HEMATOPOIETIC STEM CELLS IN MYELODYSPLASTIC SYNDROMES: A BIOMARKER FOR LEUKEMIC PROGRESSION Article Open access 15 February 2023 VALIDATION OF THE MOLECULAR
INTERNATIONAL PROGNOSTIC SCORING SYSTEM IN PATIENTS WITH MYELODYSPLASTIC SYNDROMES DEFINED BY INTERNATIONAL CONSENSUS CLASSIFICATION Article Open access 09 August 2023 COMPARISON OF THE
REVISED 4TH (2016) AND 5TH (2022) EDITIONS OF THE WORLD HEALTH ORGANIZATION CLASSIFICATION OF MYELODYSPLASTIC NEOPLASMS Article Open access 12 October 2022 INTRODUCTION Immunophenotyping of
bone marrow (BM) precursors by multiparametric flow cytometry (FCM) has proven to be a useful ancillary tool for the differential diagnosis of myelodysplastic syndromes (MDS) and unexplained
non-clonal cytopenias1,2,3,4,5,6,7,8,9,10. Besides, several studies aimed to investigate the prognostic value of flow cytometric (FCM) features, especially those which could add independent
information to the established clinical scores, such as IPSS-R, but at the moment there is no general agreement about which are the most relevant prognostic flow variables8,11,12,13,14,15.
This is mainly due to the large variety of FCM features examined among different studies4,7,8,9,10,11,12,13,14, some of them examining small patient cohorts or short follow-up times4,8,9,15.
Furthermore, some quantitative FCM features, such as the mean fluorescence intensity of antigen expressions are difficult to interpret, since they depend on comparisons with normal values,
which must be individually standardized for each laboratory. Some prognostic scores based on FCM parameters have already been proposed, such as the Ogata score5,6, the Wells’ FCSS8,9 and the
Red Score13 but they are not widely used in daily practice, in part because they are laborious and based on a large number of markers, which are difficult to standardize and depend on
highly trained operators with good expertise9,10,15. The most used is the Ogata score6, that carries two parameters with a known prognostic significance, namely the “myeloblast-related
cluster” and the “B-cell progenitor-related cluster”, with a known relation to patients’ prognosis, together with “Lympho/Gran CD45 ratio”, “Gran/Lympho SSC ratio” that have not shown a
relevant meaning for prognosis. Therefore, this score is used predominantly for differential diagnosis between MDS with a normal karyotype and non-clonal peripheral cytopenias. In this
context we tried to create a prognostic model based on flow cytometric parameters which would be parsimonious, based only on few easily reproducible variables and which would add
significantly new information to the already established IPSS-R score. The design was an uni-Institutional prospective patient cohort study with a long follow-up. Especially, we have
addressed the distribution of the subsets of monocytic precursors in BM based on their expression of CD14 and CD16. The importance of these subsets in peripheral blood has been recently
shown for the diagnosis of chronic myelomonocytic leukemia (CMML)16,17. However, their distribution in BM has not been studied in detail. METHODS AND DEVELOPMENT OF THE SCORE PATIENTS The
present study includes consecutive patients with primary MDS diagnosed at our Institution between 2005 and 2012. Diagnosis was made by WHO 2008 criteria based on clinical data, PB counts, BM
cytology and histology as well as cytogenetics18. BM immunophenotyping was performed during the diagnostic work-up. Deficiency anemias, viral infections and autoimmune disorders had been
excluded. For all cases IPSS-R was assessed19. Overall survival of the patients was calculated from diagnosis until death or last follow-up for patients receiving only supportive care.
Patients eligible for cytotoxic therapy or bone marrow transplantation were censored at the time of the start of therapy. FLOW CYTOMETRIC ANALYSIS Flow cytometric analysis was performed in
BM collected in EDTA and diluted to a concentration of 5–7 × 10⁶ cells in 100 µl. Samples were processed within 24 h after sample collection. A standardized stain/lyse/wash protocol was used
to study antigenic expression of the myelomonocytic series and CD34+ cell subsets. Details had been previously described11. Immediately after staining, samples were acquired in a
FACSCalibur flow cytometer (Becton Dickinson—BD Biosciences, San José, CA, USA) using the CellQuest software (BD Biosciences). Information of least 100,000 events was acquired. The following
antibody combinations were used: CD64/CD14/CD45/HLA-DR; CD16/CD11b/CD45/CD13; CD13/CD117/CD45/CD34; CD19/CD10/CD45/CD34 and CD7/CD56/CD45/CD34. Diagnostic flow files were reanalyzed in the
Infinicyt 1.7 version (Cytognos SL, Salamanca, Spain). In granulocytic precursors we assessed hypogranularity (SSC of granulocytes/SSC lymphocytes ratio, according to Ogata6) and decrease or
increase (1 standard deviation from normal) in expression of CD11b, CD13 and CD16. Besides, the percentages of all monocytes, those of classical (CD14+/CD16−) and of CD16+ monocytes among
total nucleated cells and their proportion among all monocytes17, as well as decrease in expression of HLA-DR, CD11b, CD14 and CD64 were examined. Cross-lineage expressions of CD56 and CD7
in granulocytes and monocytes (20% of the cells) were also assessed2,10,11. Antigen expression was compared to those of 15 controls obtained from BM aspirated from donors for bone marrow
transplantation and analyzed with the same flow protocol as the patients. Concerning CD34+ cells, we quantified the myeloid progenitors (CD13+ and/or CD117+), and decrease in expression (1
standard deviation of normal MFI) of CD13 or CD117 as well as aberrant expression of CD56 or CD7 in > 20% of the cells (until 4 alterations) and the percentage of B-lymphoid progenitors
(CD34+/CD19+/CD10+). All percentages of positive cells were computed among total nucleated cells (TNCs). Values for myeloid CD34+ cells were considered normal when below 2%6. For hematogones
(H1), the normal Brazilian reference values for age were used20. STATISTICAL ANALYSIS First, descriptive statistics was performed. Differences among groups and relations between phenotypic
features and other risk factors were analyzed by non-parametric tests (Mann–Whitney and Kruskall–Wallis test, Spearman’s and Kendall´s rank order correlations). Survival analyses were made
using the Kaplan–Meier-diagram followed by the log-rank test and uni- and multivariate Cox regressions with the backward conditional strategy for variable selection, considering _p_ = 0.05
for input and _p_ = 0.1 for output, including all variables with _p_ < 0.1 in the univariate models. The internal stability of the models was tested by bootstrap resampling21,22,23. In
brief, 100 new data sets with the same size of the original one, were created by random sampling with replacement. Cox regressions with the same conditions as in the original data set were
performed for each of these new data sets. For the prognostic flow cytometric variables which remained as independent prognostic factors in the final multivariate model (with _p_ <
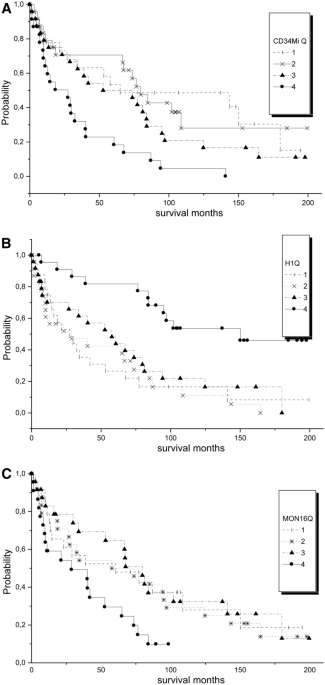
0.0001) (“% CD16+ monocytes”, “myeloid CD34+ cells” and “H1”), we defined cut-points by using the criteria of the extreme quartile risk ratio24,25 in order to build a flow score. For that
purpose, the values for the quartiles of each variable were assessed, and examined by the Kaplan–Meier method followed by the log-rank test, to see which cut-point could separate best
patients with a different survival (Fig. 1). Then, one point was given for each variable in the range of a worse survival. Finally, the score was tested by the Kaplan–Meier method to see if
it was able to separate patients with a different survival. In order to compare IPSS-R and our flow score, we used the AKAIKE information criteria (AIC), which are based on information
theory26. When a mathematical (idealized) model represents a set of true data from real life, this representation will never be exact. Therefore, some information will be lost by using the
calculated model. The Akaike information theory estimates this relative information loss. Good models are characterized by minimal information loss. To apply AIC in practice, we start with a
set of candidate models, and then find the models' corresponding AIC values. Most of the times there will be loss of information as the candidate models represent the "true
model," i.e. the process that generated the data. The Akaike information criterion takes into consideration both the simplicity and goodness of fit of the model. Our aim was to select
the model that minimizes the information loss among the candidate models. We could not choose with certainty, but we could minimize the estimated information loss. We calculated the
so-called Akaike weights which permit the simultaneous comparison of various candidate models. SPSS 15.0 and Winstat softwares were used for calculations. ETHICAL APPROVAL All methods were
performed according to the regulations of the Brazilian Commission for Ethics in Research (CONEP) and the Helsinki Declaration. Informed consent was obtained from all the participating
patients. The project had been approved by the Ethics Committee (ERC) of the University of Campinas (Proc 0652.0.146.000-08). RESULTS A total of 101 patients with newly diagnosed MDS entered
the study. Among them, 6 had a follow-up less than one month and were excluded. So, the study was based on 95 patients. Their flow data were compared with those of 13 BM donors for
transplantation. The median time of observation was 42 months (4–199 months). At the end of the observation, only 23 patients remained alive. The characteristics of the patients are shown on
Table 1. According to the WHO classification, the majority of the patients had refractory cytopenia with multilineage dysplasia. According to IPSS-R only 24 cases were high or very high
risk. Regarding the flow cytometric variables (Table 2), in the granulocytic lineage, SSC was decreased compared to normal controls (< 6.9) in 46 cases. Besides, 4 cases had no phenotypic
alterations, 32 had one, 28 had two, 27 had three and 4 cases had four alterations. In 26 MDS patients the proportion of monocytes among all nucleated cells was increased compared to our
control group (5.6% among TNCs—Table 2). There were high correlations between “% monocytes/TNCs” and “classical monocytes/TNCs” and CD16+ monocytes/TNCs” (r = 0.96; _p_ < 0.0001 and r =
0.72; _p _< 0.00001 for CD16+ ones respectively in the Spearman’s correlations), but this correlation turned non-significant when calculated between “% monocytes/TNCs” and the proportion
of each subtype among total monocytes. So, the proportions between classical and CD16+ monocytes were maintained independently of the total monocyte count. Concerning alterations in antigen
expressions, 12 cases had no alterations, 26 showed one, 24 two, 32 three and one case had four alterations. In 25 patients the percentage of myeloid CD34+ cells, was above 2%. Abnormal
co-expressions among these ells, was present in 43 patients: 14 with one, 13 with two and 16 three aberrant expressions. Hematogones type I were not detectable in 54 cases and in 18
additional patients they were less than 0.05% among total nucleated cells. Only in 23 cases they were in the normal range for age. SURVIVAL Table 3 shows all the variables that were
significant in the univariate Cox regression. Concerning the flow variables, a multivariate Cox regression was run with: “% monocytes/TNCs”, “% CD16+ monocytes/TNCs”, “total alterations in
monocytes”, “% myeloid CD34+ cells”, “number of abnormal expressions in myeloblasts” and “% of B-cell progenitors”. The variables remaining as independent in the models were: “% myeloid
CD34+ cells”: B = 0.156; HR 1.167 (1.096–1.243); _p_ < 0.0001; “% CD16+ monocytes/TNCs” B = 0.348; HR 1.416 (1.170–1.714); _p_ < 0.0001 and B-cell progenitors”: B = – 7.068; HR 0.003
(0.000–0.126) _p_ < 0.0001. In the bootstrap stability test, they were present in 70%, 68% and 88% respectively of the new models, while “% monocytes” was present in 10%, “total
alterations in monocytes” 38% and “number of abnormal expressions in myeloblasts” in 28% of the new data sets. DEVELOPMENT OF THE PROGNOSTIC SCORE In order to construct a score for practical
application we categorized the three continuous variables according to the principle of the extreme quartile risk ratio and got the following suggestion: * % myeloid CD34+ cells”—one point
for values ≥ 2.0% (Fig. 1A). * % of B-cell progenitors”—one point for values < 0.05% (Fig. 1B). * CD16+ monocytes/TNCs—one point for values ≥ 1.0% (Fig. 1C). The score is the sum of the
three points and ranges between 0 and 3. Among all patients, 17 had 0 points, 40 had 1 point, 35 had 2 and 3 had 3 points. Our score separated well groups with different survival in the
Kaplan–Meier method (Fig. 2A), as was also seen with IPSS-R (Fig. 2B). There was a rather weak correlation between the flow score and IPSS-R: r = 0.305; p = 0.001 (Kendall´s tau correlation,
significant at the 0.01 level, 2-tailed). Furthermore, in a multivariate Cox-model with IPSS-R and our flow score, both were independent variables for patients’ overall survival. In 100
bootstrap resampling sets of the original data, IPSS-R was present in 98% and the score in 100% of the models, thus showing the complementary nature of both scores, which is also
demonstrated in Table 4. Comparing the three prognostic models in the original data and the resampling, the relative weights of the Akaike information criterion with the following data
(mean, percentile 5 and 95): W IPSS-R = 0.0002 (0.000–0.0665), W flow score = 0.0008 (0.000–0.1837) and W IPSS-R + Flow Score = 0.9990 (0.7245–1.000). So, we can conclude that a model
combining IPSS-R and our Flow Score describes much better overall survival of MDS patients than both scores separately. The flow score was able to add prognostic value to IPSS-R. DISCUSSION
In the present work we examined the prognostic relevance of several phenotypically well-defined hematopoietic precursor cell populations in a relatively large prospective uni-Institutional
cohort of MDS patients with a long observation time, which permits a more reliable survival analysis. We also tried to construct a simple and reproducible score, which could be easily
applied in daily practice. The ideal variables for this purpose should be easy to obtain and relatively independent of antibody combinations used and analytical conditions. These premises
are fulfilled when quantifying well-defined cell subsets. In our study, phenotypical alterations in granulocytic maturation had no influence on patients’ prognosis. Several of them had been
included in other formerly described scores based on flow data2,5,10. These variables are difficult to reproduce, as they are based on the measure of mean fluorescence intensity of antigen
expressions and therefore highly dependent on the type of equipment, the antibody fluorescence, and analysis software, so that comparisons with local control groups are necessary. First, we
confirmed the prognostic value of the increase in CD34+ myeloid progenitors and decrease of B-cell progenitors, which has already been described by our group4,11,18 as well as by
others1,4,6,7,10,11,14,16,18,27. The number of phenotypic alterations in CD34+ myeloid progenitors were also associated with survival, but were less important as their total number in the
multivariate Cox regression, and especially in the bootstrap stability test. A value > 2% for myeloid progenitors has been recognized as a good cut-point for malignancy, and included in
the Ogata score5,6. It has also been claimed that this parameter is important in predicting progression to acute leukemia and overall survival of patients with MDS with IPSS-R intermediate
risk14. In our study, we could confirm the importance of this variable on our patients’ overall survival. The cut-point for a worse survival proposed by the extreme quartile risk ratio
(EQRR) was also “myeloid progenitors > 2%”. Concerning B-cell progenitors (hematogones type I), using the same strategy we found that patients with hematogones within the upper quartile
had a better survival. This value corresponded to the normal range for age in our population, as previously demonstrated in a Brazilian multicenter study20. Similar results had been
described by other studies concerning MDS28,29 and ALL in remission after induction30. Although the decrease of hematogones is considered to be a diagnostic hallmark of MDS, a preserved
number in low-risk cases is a sign of a better survival. This was found in 24% of our cases, and in 29% of the cases of low-risk MDS in the work of Chen et al28. Furthermore, we demonstrated
that the percentage of CD16+ monocytes among total nucleated cells, better than their percentage among all monocytes was associated with a worse survival. The proportion of classical
monocytes varied proportionally to the total monocytes, and had only a weak influence on patients’ survival. The patients with increased CD16+ monocytes/TNCs, again in the highest quartile
(> 1.0%) had a worse survival. Recently, emphasis has been given to the distribution of monocyte subsets (classical, intermediate and non-classical) in peripheral blood based on their
expression of CD14 and CD1616,17, for the diagnosis of chronic myelomonocytic leukemia (CMML) and its differential diagnosis with MDS presenting peripheral relative but not absolute
monocytosis. Several studies have shown that in CMML, the proportion of classical (CD16-) monocytes are increased in CMML compared to cases of reactive monocytosis. In MDS, the values are
very variable in peripheral blood17, but their distribution in BM has not been studied in detail. MDS cases with relative but not absolute peripheral monocytosis have been called
oligomonocytic myelomonocytic leukemia27,31. Several of them progress to CMML or acute myeloid leukemia, so presenting a worse survival. The association of some alterations in BM monocyte
antigen expressions with the outcome of MDS patients have already been described in the first publications concerning BM immunophenotyping in MDS9,10,11,12, but only recently more attention
has been drawn to number and type of antigen aberrancies. Recently, we have shown that the number of total BM monocytic precursors, as well as the increase in CD16+ ones (intermediate and
non-classical) could be associated with a patients’ worse survival11,12. Therefore, we decided to study these parameters separately from antigenic aberrancies, and could confirm this
finding. So, we developed a “flow score” with the three variables “% myeloid CD34+ cells > 2%”, % of B-cell progenitors < 0.05%” and “CD16+ monocytes/TNCs > 1.0%” (one point for
each). The most frequent abnormality found was the decrease of B-cell progenitors. Increase in CD34+ myeloid progenitors and CD16+ monocytes were alterations found with a similar frequency.
This score was able to separate groups of patients with a significantly different overall survival, independent and complementary to IPSS-R, and so, adding value to this clinical score.
Stability tests were made for our cohort of patients, but the score should be validated in an independent cohort. A wide variety of parameters generated by multiparametric flow cytometry of
BM precursors in MDS have been examined for their diagnostic and prognostic importance27. Many works are retrospective studies and some have short observation times. Most of the flow
abnormalities examined are based on “different from normal” variations in antigen expression, when compared to normal or reactive BM. All these aspects have hampered the standardization of
the scores and the search for features that are able to add independent prognostic value to the clinical scores, especially to IPSS-R. So, we tried to construct a score based on the
quantification of well-defined BM cell subsets, which is easier to standardize for clinical praxis. In our study, the flow variables related to quantification of specific cell subsets had a
more robust prognostic significance than the variables related to antigen expressions. So, we used these variables to build the score. The score developed in the present study was very
robust to add additional prognostic information to IPSS-R. The Flow Score has several advantages: it is parsimonious, for it is based on only three cell types, well defined in several
publications in the literature and is easily reproducible. Challenging the model by bootstrapping showed good intrinsic model stability. A test of external stability is however still missing
and therefore reproducibility should be tested with a new cohort of patients, preferentially in another institution and population. REFERENCES * Stetler-Stevenson, M. & Yuan, C. M.
Myelodysplastic syndromes: The role of flow cytometry in diagnosis and prognosis. _Int. J. Lab. Hematol._ 31, 479–483 (2009). Article CAS Google Scholar * Lorand-Metze, I., Ribeiro, E.,
Lima, C. S. P., Batista, L. S. & Metze, K. Detection of hematopoietic maturation abnormalities by flow cytometry in myelodysplastic syndromes and its utility for the differential
diagnosis with non-clonal disorders. _Leuk. Res._ 31, 147–155 (2007). Article CAS Google Scholar * Grille, S. _et al._ Flow cytometry diagnosis in myelodysplastic syndrome: Current
practice in Latin America and comparison with other regions of the world. _Leuk. Res._ 79, 69–74 (2019). Article CAS Google Scholar * Lorand-Metze, I. _et al._ The prognostic value of
maturation-associated phenotypic abnormalities in myelodysplastic syndromes. _Leuk. Res._ 32, 211–213 (2008). Article CAS Google Scholar * Ogata, K. _et al._ Diagnostic utility of flow
cytometry in low-grade myelodysplastic syndromes: a prospective validation study. _Haematologica_ 94, 1066–1074 (2009). Article Google Scholar * Della Porta, M. G. _et al._ Multicenter
validation of a reproducible flow cytometric score for the diagnosis of low-grade myelodysplastic syndromes: results of a European LeukemiaNET study. _Haematologica_ 97, 1209–1217 (2012).
Article Google Scholar * Grille S, et al Flow cytometry “Ogata score” for the diagnosis of myelodysplastic syndromes in a real‐life setting. A Latin American experience. _Int. J. Lab.
Hematol._ 41:536–541 (2019) Google Scholar * Wells, D. A. _et al._ Myeloid and monocytic dyspoiesis as determined by flow cytometric scoring in myelodysplastic syndrome correlates with the
IPSS and with outcome after hematopoietic stem cell transplantation. _Blood_ 102, 394–403 (2003). Article CAS Google Scholar * Chu, S. C. _et al._ Flow cytometric scoring system as a
diagnostic and prognostic tool in myelodysplastic syndromes. _Leuk. Res._ 35, 868–873 (2011). Article Google Scholar * Alhan, C. _et al._ The myelodysplastic syndromes flow cytometric
score: a three-parameter prognostic flow cytometric scoring system. _Leukemia_ 30, 658–665 (2016). Article CAS Google Scholar * Reis-Alves, S. C. _et al._ Immunophenotyping in
myelodysplastic syndromes can add prognostic information to well-established and new clinical scores. _PLoS ONE_ 8, e81048 (2013). Article ADS Google Scholar * Metze, K., Reis-Alves, S.
C. & Lorand-Metze, I. Monocyte phenotypic aberrancies are an unfavorable prognostic factor in patients with myelodysplastic syndromes and low IPSS-R scores. _Cell Immunol._ 310, 212–213
(2016). Article CAS Google Scholar * Cremers, E. M. P. _et al._ Implementation of erythroid lineage analysis by flow cytometry in diagnostic models for myelodysplastic syndromes.
_Haematologica_ 102, 320–326 (2017). Article CAS Google Scholar * Benton, C. B. _et al._ Prognosis of patients with intermediate risk IPSS-R myelodysplastic syndrome indicates variable
outcomes and need for models beyond IPSS-R. _Am. J. Hematol._ 93, 1245–1253 (2018). Article CAS Google Scholar * Matarraz, S. _et al._ Bone marrow cells from myelodysplastic syndromes
show altered immunophenotypic profiles that may contribute to the diagnosis and prognostic stratification of the disease: a pilot study on a series of 56 patients. _Cytometry B_ 78B, 154–168
(2010). CAS Google Scholar * Talati, C. _et al._ Monocyte subset analysis accurately distinguishes CMML from MDS and is associated with a favorable MDS prognosis. _Blood_ 129, 1881–1883
(2017). Article CAS Google Scholar * Hudson, C. A., Burack, W. R. & Bennett, J. M. Emerging utility of flow cytometry in the diagnosis of chronic myelomonocytic leukemia. _Leuk. Res._
73, 12–15 (2018). Article Google Scholar * Swerdlow, S., Camp, E., Harris, N., et al. WHO classification of tumors of haematopoietic and lymphoid tissues. Lyon: IARC (2008). * Greenberg,
P. _et al._ Revised International Prognostic Scoring System for myelodysplastic syndromes. _Blood_ 120, 2454–2465 (2012). Article CAS Google Scholar * Lorand-Metze, I. _et al._ Normal
variation of bone marrow B-cell precursors according to age—Reference ranges for studies in myelodysplastic syndromes in Brazil. _Cytometry B_ 94B, 644–650 (2018). Google Scholar * Bedin,
V. _et al._ Fractal dimension is an independent prognostic factor for survival in melanoma. _BMC Cancer_ 10, 260 (2010). Article Google Scholar * Lourenço, G. J. _et al._ Polymorphisms of
glutathione S-transferase mu 1, theta 1 and pi 1 genes and prognosis in Hodgkin lymphoma. _Leuk. Lymph._ 51, 2215–2221 (2010). Article Google Scholar * Ferro, D. P. _et al._ Fractal
Characteristics of May–Grünwald–Giemsa stained chromatin are independent prognostic factors for survival in multiple myeloma. _PLoS ONE_ 6(6), e20706 (2011). Article ADS CAS Google
Scholar * Kent, D. M. _et al._ Risk and treatment effect heterogeneity: re-analysis of individual participant data from 32 large clinical trials. _Int. J. Epid._ 45, 2075–2088 (2016).
Google Scholar * Ioannidis, J. P. A. & Lau, J. Heterogeneity of the baseline risk within patient populations of clinical trials. _Am. J. Epid._ 148, 1117–1126 (1998). Article CAS
Google Scholar * Wagenmakers, E.-J. & Farrell, S. AIC model selection using Akaike weights. _Psychon. Bull. Rev._ 11, 192–196 (2004). Article Google Scholar * Porwit, A. Is there a
role for flow cytometry in the evaluation of patients with myelodysplastic syndromes?. _Curr. Hematol. Malig. Rep_ 10, 309–317 (2015). Article Google Scholar * Chen, Z. Low-grade
myelodysplastic syndromes with preserved CD34+ B-cell precursors (CD34+ Hematogones). _Cytometry B_ 96B, 73–82 (2019). Google Scholar * Metze, K., Reis-Alves, S. C. & Lorand-Metze, I.
Presence of B-cell precursors in bone marrow is a favorable independent prognostic factor for overall survival in patients with myelodysplastic syndromes. _Am. J. Hematol._ 91, E503-504
(2016). Article CAS Google Scholar * Liao, H. _et al._ The prognostic significance of hematogones and CD34+ myeloblasts in bone marrow for adult B-cell lymphoblastic leucemia without
minimal residual disease. _Sci. Rep._ 9, 19722 (2019). Article ADS CAS Google Scholar * Geyer, J. T. _et al._ Oligomonocytic chronic myelomonocytic leukemia (chronic myelomonocytic
leukemia without absolute monocytosis) displays a similar clinicopathologic and mutational profile to classical chronic myelomonocytic leukemia. _Mod. Pathol._ 30, 1213–1222 (2017). Article
CAS Google Scholar Download references ACKNOWLEDGEMENTS I.L.M. and K.M have grants from the Brazilian National research Council (305110/2018-7 and 309910/2018-8 respectively). AUTHOR
INFORMATION AUTHORS AND AFFILIATIONS * Department of Internal Medicine, Faculty of Medical Sciences, University of Campinas, Campinas, Brazil J. R. Vido-Marques, S. T. O. Saad & I.
Lorand-Metze * Hematology and Hemotherapy Center, University of Campinas, Carlos Chagas Street, 480, Campinas, São Paulo, 13083-878, Brazil S. C. Reis-Alves, S. T. O. Saad & I.
Lorand-Metze * Department of Pathology, Faculty of Medical Sciences, University of Campinas, Campinas, Brazil K. Metze Authors * J. R. Vido-Marques View author publications You can also
search for this author inPubMed Google Scholar * S. C. Reis-Alves View author publications You can also search for this author inPubMed Google Scholar * S. T. O. Saad View author
publications You can also search for this author inPubMed Google Scholar * K. Metze View author publications You can also search for this author inPubMed Google Scholar * I. Lorand-Metze
View author publications You can also search for this author inPubMed Google Scholar CONTRIBUTIONS J.R.V.-M. analyzed the flow data and participated in the study design and helped to write
the manuscript, S.C.R.-A. collected the flow data and the clinical data of the patients , S.T.O.S. was responsible for the diagnosis and treatment of the patients, K.M. was responsible for
the statistical approach and the development of the score, reviewed the data and the manuscript, I.L.-M. was responsible for the study design reviewed the data analysis, made the statistical
calculations and wrote the manuscript. CORRESPONDING AUTHOR Correspondence to I. Lorand-Metze. ETHICS DECLARATIONS COMPETING INTERESTS The authors declare no competing interests. ADDITIONAL
INFORMATION PUBLISHER'S NOTE Springer Nature remains neutral with regard to jurisdictional claims in published maps and institutional affiliations. RIGHTS AND PERMISSIONS OPEN ACCESS
This article is licensed under a Creative Commons Attribution 4.0 International License, which permits use, sharing, adaptation, distribution and reproduction in any medium or format, as
long as you give appropriate credit to the original author(s) and the source, provide a link to the Creative Commons licence, and indicate if changes were made. The images or other third
party material in this article are included in the article's Creative Commons licence, unless indicated otherwise in a credit line to the material. If material is not included in the
article's Creative Commons licence and your intended use is not permitted by statutory regulation or exceeds the permitted use, you will need to obtain permission directly from the
copyright holder. To view a copy of this licence, visit http://creativecommons.org/licenses/by/4.0/. Reprints and permissions ABOUT THIS ARTICLE CITE THIS ARTICLE Vido-Marques, J.R.,
Reis-Alves, S.C., Saad, S.T.O. _et al._ A simple score derived from bone marrow immunophenotyping is important for prognostic evaluation in myelodysplastic syndromes. _Sci Rep_ 10, 20281
(2020). https://doi.org/10.1038/s41598-020-77158-z Download citation * Received: 27 February 2020 * Accepted: 04 November 2020 * Published: 20 November 2020 * DOI:
https://doi.org/10.1038/s41598-020-77158-z SHARE THIS ARTICLE Anyone you share the following link with will be able to read this content: Get shareable link Sorry, a shareable link is not
currently available for this article. Copy to clipboard Provided by the Springer Nature SharedIt content-sharing initiative