- Select a language for the TTS:
- UK English Female
- UK English Male
- US English Female
- US English Male
- Australian Female
- Australian Male
- Language selected: (auto detect) - EN
Play all audios:
The viscoelastic properties of mammalian cells can vary with biological state, such as during the epithelial-to-mesenchymal (EMT) transition in cancer, and therefore may serve as a useful
physical biomarker. To characterize stiffness, conventional techniques use cell contact or invasive probes and as a result are low throughput, labor intensive, and limited by probe
placement. Here, we show that measurements of biomass fluctuations in cells using quantitative phase imaging (QPI) provides a probe-free, contact-free method for quantifying changes in cell
viscoelasticity. In particular, QPI measurements reveal a characteristic underdamped response of changes in cell biomass distributions versus time. The effective stiffness and viscosity
values extracted from these oscillations in cell biomass distributions correlate with effective cell stiffness and viscosity measured by atomic force microscopy (AFM). This result is
consistent for multiple cell lines with varying degrees of cytoskeleton disruption and during the EMT. Overall, our study demonstrates that QPI can reproducibly quantify cell
viscoelasticity.
Viscoelastic properties of cells are important emerging biomarkers of disease state and progression1. The simplest approach to defining cell viscoelastic properties examines two parameters:
stiffness and viscosity, which characterize the elastic and dissipative components of a cell’s response to stress2. The elastic response has been used as a biomarker for cancer cells3 or
metastatic potential4, and has been related to cell migration during embryogenesis5. Cell viscosity has been linked to multiple biological processes, such erythrocyte porous trafficking and
deformability6, diffusion7,8, and cell disease state9,10.
Most approaches to interrogate cell viscoelastic properties use induced deformations11 or probes12. Approaches to measure the elastic component of cell viscoelasticity include atomic force
microscopy (AFM)13, optical laser tweezers14, magnetic tweezers15, pipette suction16, uniaxial stretching rheometry17, hydrodynamic stretching18, and microrheology19,20. The viscous response
of cells has been measured using approaches that include microrheology19,20, electronic spin resonance21, fluorescent rotor protein22, AFM23, pipette suction16, and optical laser
tweezers24. These measurements, however, can be strongly influenced by the specific region of a cell that is probed25, alterations of the cytoskeletal network by an applied stress26 or cell
interactions with a probe27. All of these influences may bias measurements of cell viscoelasticity.
Therefore, we developed a contact-free, non-invasive approach that accurately measures cell viscoelastic properties based on quantitative phase imaging (QPI), a method that we refer to as
quantitative phase rheology (QPR). QPI28 is a microscopy technique used to measure the phase-shift or retardation of light due to its interactions with the relative dry mass, or the
non-aqueous biomass, of a cell29. Using an experimentally determined cell-average specific refractive index, we can relate the phase shift of light to cell biomass30,31. QPI has been used to
study cell growth32, death33, and responses to growth inhibition by chemotherapeutics or targeted inhibitors of biological processes34,35,36.
Previous studies have used what we refer to as QPR to measure membrane viscoelastic properties of enucleated erythrocytes, including development of an analytical model linking observed
vibration modes to viscoelastic properties through the autocorrelation of quantitative phase data37,38. However, this model does not directly translate to the more complex structure of
nucleated cells. In an application to nucleated cells, spatial and temporal autocorrelations of quantitative phase data from human pluripotent stem cell colonies indicated both a larger
degree of spatial coordination and faster rate of temporal decorrelation for pluripotent cells compared to their differentiated progeny39. A more recent study found that spatial
autocorrelations of quantitative phase data can be used to indicate the intracellular disorder of cells, a parameter related to cell stiffness in response to deformation to fluid shear40.
Other work on QPR indicates that temporal autocorrelation of quantitative phase data relates to cellular transport properties including diffusion41,42,43, and show a correlative relation to
cellular stiffness44. However, there is currently no QPR method to concurrently model and measure both the elastic and viscous components of cell viscoelasticity.
In the present study, we report that the temporal autocovariance of quantitative phase data for cells at interphase of the cell cycle show a response similar to a mass spring damper system.
The elastic and viscous coefficients describing this behavior correlate with viscous and elastic stiffness components of interphase cells quantified by AFM measurements. We varied the cell
stiffness of three different cell lines with cytochalasin B45, an actin polymerization inhibitor, and show a high correlation between QPR results and AFM viscoelasticity measurements.
Finally, to validate our measurements in cells of the same genetic origin during a cell state transition in which stiffness plays a physiological role, we apply QPR to a cellular model of
the epithelial to mesenchymal transition (EMT)46. These results show that QPR measures of stiffness and viscosity correlate with EMT state. Overall, our results suggest that label-free QPR
can be used to indicate cell stiffness and viscosity, significantly expanding the utility of QPI for monitoring cell behavior.
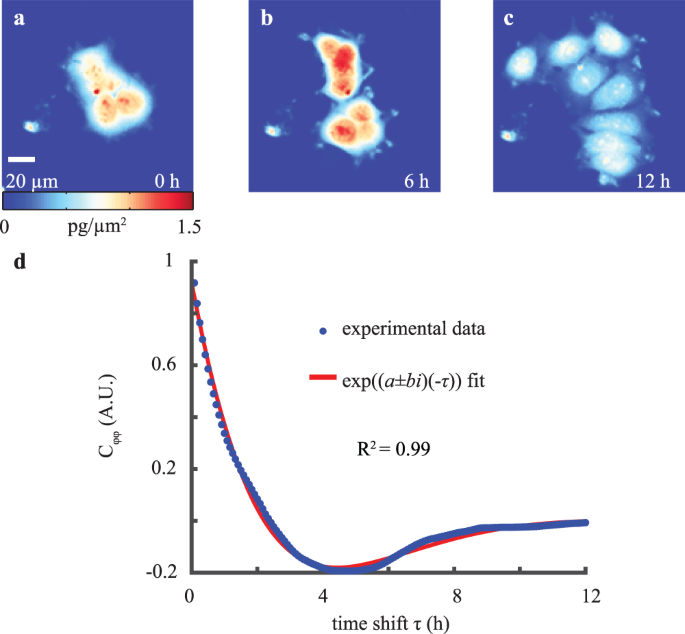
We used QPI to measure cellular biomass distribution over time (Fig. 1a–c) and computed the autocovariance of these biomass distributions over time, Cϕϕ, to quantify changes in the
distribution of biomass caused by the motion of cellular structures (Fig. 1d). The autocovariance of the quantitative phase data (Fig. 1d) is well-fit by an equation describing damped
harmonic oscillations (R2 = 0.99). The fitting coefficients in this equation are related to an effective stiffness, k, and effective viscosity, μ. Assuming the spring and damper act in
series, k is given by Eq. (9) (Methods) and μ can be found by dividing Eq. (9) by Eq. (5) (Methods).
Autocovariance of QPI biomass-density over time displays underdamped oscillations. (a–c) QPI of MCF-7 cell cluster at 0, 6, and 12 h of imaging. (d) Autocovariance of QPI data over timeshift
τ fitted to a complex exponential.
QPR detects large changes in both effective stiffness and viscosity during mitosis (Fig. S1). These changes are consistent with previously measured increases in cortical tension and cell
stiffness during cell division and mitosis47,48,49. However, our QPR analysis averages values obtained over a period of approximately 5 h, so changes in cell stiffness due to single mitotic
events are not resolved. To measure population-level differences, we therefore restrict our analysis to interphase cells.
We filtered QPI data to automatically detect the localized increase in biomass density that occurs during mitosis using a kernel consisting of a sigmoid function in time50 and a disk in
space. This kernel mimics the characteristic changes in cell phase shift that occur during mitotic cell rounding. When applied using an image processing filter (e.g. imfilter in Matlab),
this kernel highlights regions of mitotic cells, without requiring any additional labels (Fig. S2A,B). To validate this method of automatically detecting mitosis, we used FUCCI green
fluorescence to mark mitotic cells (Fig. S2c). We observed>80% overlap between fluorescently labeled mitotic cells and cells with high values of the QPI mitosis filter, indicating robust
detection of mitosis. We then calculated true positive versus false positive rates for detection of images that contain a division event (Fig. S2d). This allowed us to determine a filter
threshold that gives a true positive rate of >0.95.
We then applied our label-free QPI mitotic filter to our autocovariance analysis. We calculated autocovariance on all possible 5 h subsets of each cell cluster dataset. Any subset that was
determined to contain images with a mitotic event were removed from the analysis. This automatic filtering eliminates cells in mitosis from QPI data to enable biomass-density decorrelation
rate measurements for interphase cells only.
We performed QPR with filtered elimination of mitotic events for MCF-7 (Fig. 2a), HeLa (Fig. 2b), and BT-474 (Fig. 2c) cells. These curves display significant heterogeneity as detected by
the variable periods and amplitudes of oscillation seen in the autocovariance curves of individual clusters. For example, BT-474 cells displayed the highest frequency of oscillation (b =
0.46 ± 0.07) and steepest exponential decay (a = 0.63 ± 0.05) (Fig. 2c) compared to the other two cell lines, whereas HeLa cells appear to have the lowest oscillation frequency and
exponential decay (b = 0.24 ± 0.11 and a = 0.52 ± 0.12) (Fig. 2b). These qualitative differences correspond to a predicted lowest effective elasticity (aka stiffness) and viscosity for HeLa
cells and a highest effective stiffness and viscosity for BT-474 cells. The standard deviation for stiffness from repeated measurements of single cells and clusters was 7–10%. The population
standard deviation, however, was significantly larger, approximately 100%., indicating significant biological heterogeneity within each cell population.
Autocovariance of QPI data from individual clusters and cells indicates significant heterogeneity. (a) Autocovariance of MCF-7 (n = 31), (b) HeLa (n = 12), and (c) BT-474 (n = 51) cells in 0
μM cytochalasin B with individual cell or cluster traces shown.
To induce a change in cellular stiffness and viscosity, we used the actin polymerization inhibitor cytochalasin B to disrupt the cell cytoskeleton over a drug concentration range of 0–5 μM51
and measured effective stiffness and viscosity with QPR (Fig. 3). These data display both significant cell-to-cell heterogeneity as well as the expected trend of decreasing stiffness and
viscosity with increasing cytochalasin B concentrations. This is most easily detected in the population averaged autocovariance signal between control (R2 = 0.99 ± 0.01) and 5 μM (R2 = 0.99
± 0.01) cytochalasin B treated MCF-7 cells (Fig. S3a), where the decay of the autocovariance for 5 μM treated cells is more rapid than the control, indicating a decrease in viscoelasticity.
This result is consistent with similar data obtained using dynamic light scattering by others for the effect of lowered viscoelasticity on autocovariance values52. The stiffness change
detected for HeLa (Fig. S3b) and BT-474 (Fig. S3c) cells was less dramatic under these cytochalasin B treatment conditions. Therefore, there are lower differences between the control (HeLa
R2 = 0.98 ± 0.01, BT-474 R2 = 0.98 ± 0.01) and 5 μM perturbation autocovariance values (HeLa R2 = 0.99 ± 0.01, BT-474 R2 = 0.99 ± 0.01) for these cells than for MCF-7 cells. The individual
autocovariance values for both control and 5 μM cytochalasin B treated cells fits the damped harmonic oscillation equations well, as quantified by average R2 > 0.98 for all perturbations in
all 3 cell types.
Population average QPR stiffness and viscosity values decrease with increasing cytochalasin B concentration. (a) QPR stiffness and (b) QPR viscosity of MCF-7, HeLa, and BT-474 over various
0-10 μM cytochalasin B concentration. QPR samples were collected at 0 μM (n = 12), 1.25 μM (n = 20), 2.5 μM (n = 14), and 5 μM (n = 25) for HeLa, at 0 μM (n = 31), 1.25 μM (n = 11), 2.5 μM
(n = 22), and 5 μM (n = 34) for MCF-7, and at 0 μM (n = 51) and 5 μM (n = 31) for BT-474 cells. Error bars represent SD. * p
:max_bytes(150000):strip_icc():focal(639x0:641x2)/416418724_5134985609001_brad-kids-1280-032390da726246dabce815f6c2051fd7.jpg)
:max_bytes(150000):strip_icc():focal(319x0:321x2)/people_social_image-60e0c8af9eb14624a5b55f2c29dbe25b.png)
:max_bytes(150000):strip_icc():focal(599x0:601x2)/wendi-miller-darren-partch-5d4f214ed23146baa663a3d0ce780451.jpg)


:max_bytes(150000):strip_icc():focal(739x120:741x122)/henry-winkler-rollout-102423-new-1-6f965aadc48c4d6681d0e0178d9f9189.jpg)