- Select a language for the TTS:
- UK English Female
- UK English Male
- US English Female
- US English Male
- Australian Female
- Australian Male
- Language selected: (auto detect) - EN
Play all audios:
Cell-free transcription-translation (TXTL) is expanding as a polyvalent experimental platform to engineer biological systems outside living organisms. As the number of TXTL applications and
users is rapidly growing, some aspects of this technology could be better characterized to provide a broader description of its basic working mechanisms. In particular, developing simple
quantitative biophysical models that grasp the different regimes of in vitro gene expression, using relevant kinetic constants and concentrations of molecular components, remains
insufficiently examined. In this work, we present an ODE (Ordinary Differential Equation)-based model of the expression of a reporter gene in an all E. coli TXTL that we apply to a set of
regulatory elements spanning several orders of magnitude in strengths, far beyond the T7 standard system used in most of the TXTL platforms. Several key biochemical constants are
experimentally determined through fluorescence assays. The robustness of the model is tested against the experimental parameters, and limitations of TXTL resources are described. We
establish quantitative references between the performance of E. coli and synthetic promoters and ribosome binding sites. The model and the data should be useful for the TXTL community
interested either in gene network engineering or in biomanufacturing beyond the conventional platforms relying on phage transcription.
In this work, we present a simple non-stochastic ODE (Ordinary Differential Equation) model of an all-E. coli TXTL system6, for which we previously described its coarse-grained dynamics18.
The biophysical model reported in the present article is suitable for cell-free reactions performed in batch mode in volumes on the order of a few microliters. It is the case for a majority
of TXTL applications, carried out at the microliter scale or above in well-mixed reactions. This model is applied to a set of three promoters specific to the primary sigma factor 70 (rpoD)
in combination with a set of three untranslated regions (UTRs), both spanning a strength of about two orders of magnitude. We determine the rates of protein synthesis in the steady state for
the nine combinations with respect to the plasmid concentrations, and to the concentrations of TX and TL molecular components. We test the robustness of the model against several key
biochemical constants experimentally determined to constrain the model fitting and simulations. We demonstrate that our model captures the major TXTL regimes and saturations, which are
predominantly due to the depletion of ribosomes on the messenger RNAs. Finally, we compare the synthetic sets of promoters and UTRs to a set of natural regulatory parts from E. coli so as to
establish a reference table of the performances of regulatory elements between TXTL and in vivo. In addition to being accessible, the model should facilitate tuning, setting and choosing
the strengths and stoichiometry of regulatory parts making circuits.
The transcription of the all-E. coli TXTL toolbox relies on the core RNA polymerase and the primary sigma factor 70 (RpoD), as discussed previously in several articles6,19. All the circuits
executed in this system, commercialized under the name myTXTL, are booted up through this transcription mechanism. In our reference plasmid P70a-deGFP, the gene degfp encoding the reporter
protein deGFP is cloned under the promoter P70a, specific to sigma 70 (Fig. S1). P70a, derived from the phage lambda, is one of the strongest E. coli promoters reported so far. The
untranslated region (UTR), located between the promoter and the ATG, is the UTR downstream of promoter 14 from the phage T720. It is the strongest bacterial UTR reported so far, and used in
many standard plasmids to overexpress proteins in E. coli. It is defined as UTR1 in this work. The synthetic transcription terminator T500 is cloned downstream of the degfp gene. P70a-deGFP
is designated as our reference plasmid because it delivers the strongest gene expression in vitro. We compare the performance of single regulatory elements (promoters, UTR, terminators) and
of other plasmids to P70a-deGFP.
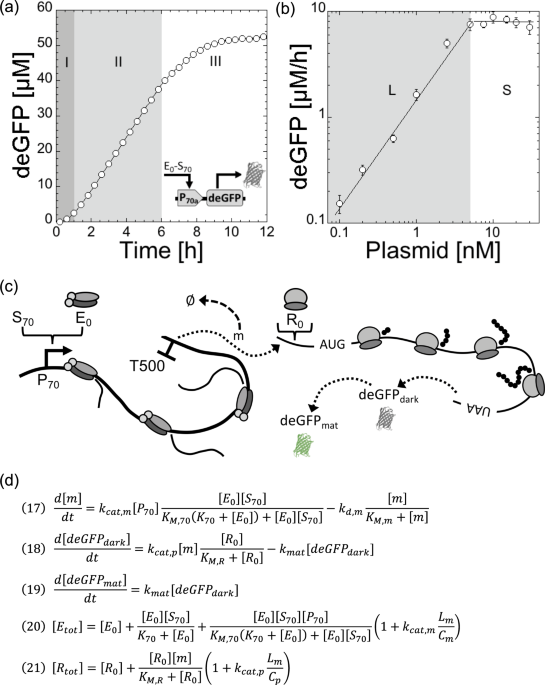
The typical kinetics of deGFP synthesis in a TXTL reaction, using P70a-deGFP as template, shows three phases (Fig. 1a). The first regime, that lasts 30 min to 1 h, is a transient regime when
gene expression starts. The second regime, between 1–6 h, corresponds to a steady state. The reporter protein deGFP, which does not degrade in our study, accumulates linearly in time
because the concentration of degfp messenger RNA (mRNA) is constant. The last regime, typically observed after 6 hours of incubation, is when gene expression curves towards a plateau. This
regime is complex to interpret because it corresponds to a depletion of the biochemical building blocks (amino acids, ribonucleosides) and to a change of the biochemical conditions (pH drop
for example, see21). When the concentration of plasmid P70a-deGFP is varied, the maximum rate of deGFP synthesis in steady state is linearly proportional to the plasmid concentration below 5
nM (Fig. 1b). We observe a saturation of the rate above 5 nM of template. The transition from the linear to the saturated regime is sharp. The linear and saturated regimes observed for the
rate of deGFP synthesis are also observed for the protein synthesis yield (Fig. S2). We performed the same experiments with the plasmid P70a-mCherry and observed the same trends for a
different reporter protein (Fig. S2). It is this phenomenological observation that we model in this article. We hypothesize that this saturation occurs when either the transcription
machinery (core RNA polymerase) or the translation machinery as suggested before7, or both, are entirely depleted. For instance, at a sufficiently large concentration of synthesized mRNA,
all the ribosomes are performing translation. Therefore, adding more DNA template to the reaction does not convert to more protein produced. As we shall see, transcription in this system
never saturates. Our goal is to (i) derive a simple model that captures this hypothesis, (ii) constrain the model by determining experimentally some of the kinetics constants and
concentrations, (iii) and test the sensitivity of the model with respect to biochemical parameters.
Cell-free expression of the reporter protein deGFP in the all-E. coli TXTL system using the plasmid P70a-deGFP. (a) Kinetics of deGFP synthesis at 5 nM plasmid showing three regimes: (I)
transient regime, (II) steady state, (III) plateau (gene expression stops). (b) Maximum rate of deGFP synthesis as a function of the plasmid concentration. Two regimes are observed: linear
(L) at low plasmid concentration, saturated (S) at high plasmid concentration. (c) Schematic of the model showing most of the components included in the model. (d) Final equation set of the
model. Equations 20 and 21 have to be solved for E0 and R0 respectively.
The schematic of TXTL of a reporter gene under a constitutive promoter (P70a-deGFP) (Fig. 1c), shows most of the major biochemical species that we include in the model:
The model is based on only three ordinary differential equations (ODEs) and two equations for conservation: the total concentrations of RNA polymerases and ribosomes are constant (Fig. 1d).
The biochemical constants and concentrations for our best fit are summarized in the Table Fig. 2. The model is derived using the following appropriate assumptions:
quasi-steady state for Michaelis-Menten terms. KM,70, KM,m, and KM,R are the Michaelis-Menten constants for transcription, mRNA degradation and translation respectively.
nutrients necessary for gene expression (tRNA, amino acids, ribonucleosides) are in infinite supply during the steady state.
the concentration of holoenzyme RNA polymerase-Sigma 70 is larger than the concentration of template (i.e. larger than the concentration of promoter P70).
Sigma 70 is not limiting for transcription, which is confirmed by the sensitivity assay.
the concentration of ribonucleases is smaller than the concentration of synthesized mRNA (m).
the concentration of ribosomes (R0) is larger than the concentration of synthesized mRNA (m).
the maturation of deGFPdark to deGFPmat is modeled by a first order kinetics, which fits very well to the data in the maturation assay (Supplementary Information).
Maximum rate of deGFP synthesis in the all-E. coli TXTL system as a function of plasmid concentration (P70a-deGFP). (a) Data versus model. (b) Biochemical constants for the best fit, shown
in (a).
Using these assumptions, the set of three ODEs that describes the kinetics of deGFP synthesis is the following:
The term of mRNA degradation is re-written by taking k [Rnase] = kd,m (Eq. 4). Based on our previous work6,22, mRNA degradation in our system behaves as a first order kinetics which means
that KM,m ≫ [m]. The mRNA degradation term is not written as a first order kinetics, however, for modeling purposes (to avoid a negative mRNA concentration in the execution of the Matlab
program). The constants kd,m (6.6 nM s−1) and KM,m (8000 nM) were chosen so as to obtain kdeg,m determined by the assay later described and so that KM,m ≫ [m], which is the case because [m]
at the transition from the linear to saturated regimes (5 nM P70a-deGFP) is on the order of 100 nM (Fig. S3). The model is independent from the numerical values of kd,m and KM,m as long as
their ratio is equal to kdeg,m and KM,m ≫ [m].
In the next step we build two equations of conservation for the core RNA polymerases and ribosomes. The sigma factor 70 has two forms, free (S70free) or complexed with the core RNA
polymerase (E70):
We consider that the following biochemical reaction is at equilibrium all the time (i.e. it is a fast biochemical reaction with respect to the others): We call K70 the dissociation constant:
The core RNA polymerase has three forms: free (E0), complexed with S70 (E70), or performing transcription on mRNA (Em). Etot is constant:
The number of core RNA polymerases that are bound to DNA is (see)23:
The first term in Eq. 12 corresponds to the core RNA polymerase on the promoter and the other term the core RNA polymerases that have engaged in transcription. We then get the conservation
equation, Eq. 13, that has to be solved for E0:
We proceed in a similar manner to construct the conservation of ribosomes. Note that here we assume that the translation initiation and termination factors are not limiting the process of
translation. Ribosomes can be in two forms, free (R0), and performing translation on mRNA (Rm):
The first term in Eq. 15 corresponds to the ribosomes on the ribosome binding site and the other term is for the ribosomes that have engaged into translation. Eq. 16 that has to be solved
for R0:
The final system of equations (using Eqs (5–7) and 10) is (also shown in Fig. 1d):
We did not include protein degradation in the experiments. There are two reasons for this. First, protein degradation, achieved by the ClpXP complex in TXTL, is a zeroth order kinetic
reaction that does not allow a steady state for proteins6. Consequently, the analysis is less interesting. Second, the concentration of ClpXP complex does not seem to remain constant in the
TXTL reaction (data not shown), presumably due to the well-established instability of ClpX24. That would make the analysis and modeling complicated and phenomenological.
The mRNA steady state [m]SS (Eq. 23) is found by setting Eq. 17 to zero (Eq. 22). For low plasmid concentration (in the linear regime), one can assume that E70 ≫ KM,70 (or that K70 ≪ E0) and
therefore kcat,m ≈ kTX. The mRNA mean lifetime 1/kdeg,m for the malachite green aptamer (MGapt) was estimated using an assay (Fig. S6): 1/kdeg,m ≈ 27 min. Our measurements of [m]SS at low
plasmid concentration, using the malachite green aptamer as an RNA probe (Fig. S7), gives us a value of kcat,m ≈ kTX = 1.5 10−2 s−1 using [m]SS = 25 nM at 1 nM plasmid. This experiment,
however, can only provide a low estimation for this constant (i.e. the value for kTX can only be underestimated because the assay may not report all the malachite green aptamers synthesized
or fluorescent). In our simulations, we found that the best fit was obtained with kcat,m ≈ kTX = 6.5 10−2 s−1 (Fig. 2).
Note that for the deGFP mRNA, 1/kdeg,m ≈ 20 min (Fig. S4), using kcat,m ≈ kTX = 6.5 10−2 s−1, we get that [m]SS ≈ 80 nM at 1 nM plasmid. A maximum theoretical value (1 nM plasmid ≈ 1 copy
per E. coli) of [m]SS ≈ 600 nM in TXTL is obtained by taking kcat,m ≈ kTX = 0.5 s−1 and a 1/kdeg,m ≈ 20 min. Experimentally, one can see that the TX machinery is never limiting in the system
because the rate of mRNA synthesis keeps increasing even at plasmid (P70a-deGFP-MGapt) concentrations larger than 5 nM (Fig. S8). As we shall see below, it is the TL machinery that is
limiting in the system, i.e. ribosomes are entirely depleted onto the mRNA at plasmid concentrations above 5 nM (P70a-deGFP). Because it is the strongest promoter-UTR pair, the protein
synthesis rate or yield for any other promoter-UTR regulatory element is linear with respect to plasmid concentration up to 5 nM or more; saturation of the protein synthesis rate cannot be
observed below 5 nM plasmid.
For low plasmid concentrations [P70] P70b > P70c) and two other untranslated regions, UTR2 and UTR3, derived from UTR1 (strengths: UTR1 > UTR2 > UTR3) to create a set of nine combinations
(sequences in Supplementary Information). The −35 and −10 of P70a were mutated to get P70b and P70c. The ribosome binding site in UTR1 was mutated to get UTR2 and UTR3. These sets span two
orders of magnitude in strengths. By changing the promoter and UTR strengths, we change the value of kcat,m and kcat,p, and of KM,70 and KM,R. Many kcat,m-KM,70 and kcat,p-KM,R pairs can be
found to fit the results. However, because the system is only weakly sensitive to changes in the magnitude of the Michaelis-Menten contants KM,70 and KM,R (see thereafter), we only changed
the value of kcat,m and kcat,p that we determined through the simulations to get the best fits (Fig. 3). We experimentally determined the rate of protein synthesis for the nine combinations
with respect to plasmid concentration and performed sensitivity analysis on six biochemical parameters. The sensitivity analysis comprised of varying each of the six biochemical constants,
while keeping all the others constants at their best numerical fit values, by one order of magnitude above and below the best fit value. As discussed for P70a-UTR1, translation is the
limiting process responsible for saturation of the protein synthesis rate as plasmid concentration is increased. Consequently, the model and data are most sensitive to the ribosome
concentration, especially for strong promoters (Fig. 3). As expected, for weak promoters and/or UTRs (e.g. P70c), the response is linear for any plasmid concentration (up to 30 nM tested in
this work). In addition to the ribosome concentration, high sensitivity is observed for kdeg,m (Fig. S12). As expected, if kdeg,m is larger, the system does not saturate and the response
remains linear. Conversely, if kdeg,m is smaller, the systems saturates more quickly with respect to plasmid concentration. Some sensitivity is observed for kmat (Fig. S13) and for Etot
(Fig. S14). Note that for Etot, saturation is not observed in the experiments (Fig. S8) as captured by the model. Limitations due to Etot in the plasmid range 0–30 nM (P70a-deGFP) would be
observed if E0


![[Withdrawn] Withdrawn regulatory judgement: Mount Green Housing Association Limited (14 December 2022) - GOV.UK](https://www.gov.uk/assets/static/govuk-opengraph-image-03837e1cec82f217cf32514635a13c879b8c400ae3b1c207c5744411658c7635.png)
