- Select a language for the TTS:
- UK English Female
- UK English Male
- US English Female
- US English Male
- Australian Female
- Australian Male
- Language selected: (auto detect) - EN
Play all audios:
We report changes in the genomic landscape in the development of head and neck squamous cell carcinomas HNSCC from potentially premalignant lesions (PPOLS) to malignancy and lymph node
metastases. Likely pathological mutations predominantly involved a relatively small set of genes reported previously (TP53, KMT2D, CDKN2A, PIK3CA, NOTCH1 and FAT1) but also other predicted
cancer drivers (MGA, PABPC3, NR4A2, NCOR1 and MACF1). Notably, all these mutations arise early and are present in PPOLs. The most frequent genetic changes, which follow acquisition of
immortality and loss of senescence, are of consistent somatic copy number alterations (SCNAs) involving chromosomal regions enriched for genes in known and previously unreported
cancer-related pathways. We mapped the evolution of SCNAs in HNSCC progression. One of the earliest SCNAs involved deletions of CSMD1 (8p23.2). CSMD1 deletions or promoter hypermethylation
were present in all of the immortal PPOLs and occurred at high frequency in the immortal HNSCC cell lines. Modulation of CSMD1 in cell lines revealed significant suppression of proliferation
and invasion by forced expression, and significant stimulation of invasion by knockdown of expression. Known cancer drivers NOTCH1, PPP6C, RAC1, EIF4G1, PIK3CA showed significant increase
in frequency of SCNA in transition from PPOLs to HNSCC that correlated with their expression. In the later stages of progression, HNSCC with and without nodal metastases showed some clear
differences including high copy number gains of CCND1, hsa-miR-548k and TP63 in the metastases group.
Globally, head and neck carcinomas account for over 550,000 new cases per annum with a mortality of approximately 275,000 cases per year1. By far, the commonest site of cancer within this
region is the oral cavity and the commonest type of tumour is squamous cell carcinoma (SCC), which accounts for over 90% of all malignant tumours at this site. HNSCC is associated with high
mortality having an overall 5-year survival rate of less than 50%. Furthermore, both the disease and the multimodal treatments options involved are associated with high morbidity2.
The molecular pathology of head and neck squamous carcinoma has been extensively studied previously3 and the common somatic genetic changes have been characterised4,5,6,7,8. There have been
some studies of the multistage evolution of these tumours9 but this is less well characterised. A small number of tumours arise from pre-existing lesions (known as potentially malignant
lesions or PPOLs) such as leukoplakia or erythroplakia, which display variable epithelial dysplasia10. However, the vast majority are thought to arise de novo from macroscopically normal
appearing mucosa or possibly undiagnosed PPOLs. Support for the latter comes from data showing that the transcriptional signatures of PPOLs are retained in unrelated samples of SCC both in
vivo11 and in vitro12. Nevertheless, it is clear that tumours arise from within a wide field bearing the relevant genetic alterations and that there is a risk of synchronous or metachronous
tumours13,14. A fuller understanding of the events in evolution of these cancers may permit the development of biomarkers or effective therapeutic interventions possibly targeting not just
tumours but also the early changes in the field. The first multi-step model proposed for carcinogenesis in HNSCC15 suggested typical alterations associated with progression from normal
mucosa to invasive carcinoma, with dysplasia reflecting an earlier stage of cancer progression.
We, and others, have previously shown that both SCCs and PPOLs yield either mortal and immortal cells in vitro16,17 and sometimes, mixtures of the two16,17,18. The status of these mortal
cells is unclear. Unlike the immortal cells, they lack inactivation of TP53 and CDKNA, but our limited previous investigations show that they are genetically stable. Nevertheless, they often
have extended replicative lifespans16,17, possess neoplastic phenotypes, such as resistance to suspension-induced terminal differentiation16 and have expression signatures which are
distinct from both immortal cells and normal cells12. Furthermore, these characteristics are present in mortal cells from both PPOLs and SCCs12 suggesting the presence of distinct pathways
for the development of mortal and immortal SCC. Our preliminary work established that the mortal PPOL were cytogenetically diploid and had low levels of LOH16 but the immortal PPOLs have
never been subjected to extensive genomic analysis. In addition, whilst extensive genetic analysis of HNSCC has been carried out in recent years4,5,6,8, including the identification of key
driver mutations, the stages in the cancer progression, at which they occur and the resulting phenotypes are still unknown. There are numerous previous studies of PPOLs limited to
determining the frequency of alterations in specific gene or specific genetic regions. Exceptions to this are the study by Bhattacharya and colleagues9 and Wood and colleagues19, which
reported a comprehensive analysis of copy number variation in primary PPOLs and HNSCC although in the later study, the PPOL analyses was confined to metachronous lesions. A very recent study
reported the status of SCNAs and common driver mutations in several keratinocyte cultures derived from metachronous normal and dysplastic lesions characterised for replicative lifespan20.
Here we extend their findings by a combination of exome/targeted sequencing, methylation and SNP/CGH array analyses, using our unique panel of fully characterised mortal cultures and
immortal cell lines derived from both PPOLS and HNSCC, to show that these genetic alterations are mostly associated with cellular immortalisation and increase with the stage of tumour
progression in this class of SCC keratinocyte. The principal focus of this study is to characterise in detail changes in the evolution and progression of HNSCC rather than focussing on HNSCC
as a group which have already been well characterised with respect to mutation and genomic landscapes. In doing so we identify common alterations of the candidate tumour suppressor gene
CSMD1 not highlighted previously and provide preliminary evidence of its function. Furthermore, alterations of CSMD1 were common in PPOL cultures and therefore may be early events in SCC
development.
Several recent genomic sequencing studies have fully characterised mutations in HNSCC4,5,6,7. In order to map these previously identified mutations to progression of HNSCC, a small
previously well-characterised panel of samples consisting of 3 PPOL mortal cultures, 7 PPOL cell lines (from lesions known to have progressed as well as lesions that had not progressed) 1
mortal culture derived from HNSCC and 11 HNSCC cell lines17,21,22 were selected for exome-sequencing or targeted sequencing of the top 40 genes identified as altered in these cancers4 using
HaloPlex Target Enrichment System (Agilent, Santa Clara, CA, USA). The sample details are given in Supplementary Data S1.
For exome sequencing, approximately 6 gigabases of sequence mapped to the human genome with an average of 65.7% (Range 33.8% to 86.1%) of the targeted exome covered at twenty-fold or higher
(shown in Supplementary Data S2). For HaloPlex sequencing, approximately 800 megabases of sequence mapped to the human genome with an average of 94.8% of the targeted exons covered at
twenty-fold or higher (shown in Supplementary Data S3).
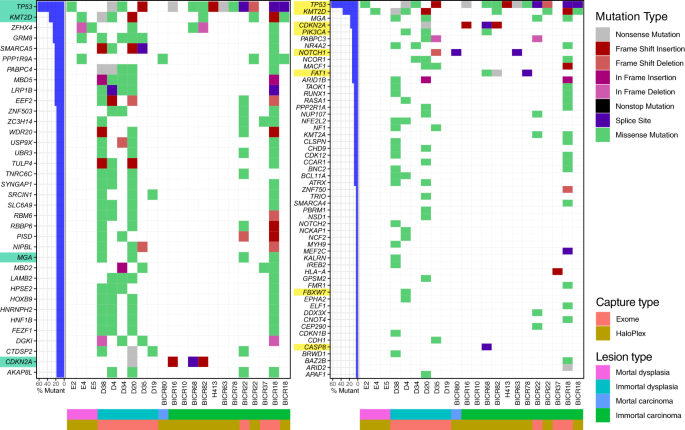
Mutation landscape plot of filtered variants present from exome and HaloPlex captures. On the left, the genes shown contain a distinct mutation in at least three samples, while for the plot
on the right, the genes shown are the genes known to be HNSCC drivers according to IntOGen. The bar plot on the left of both mutational landscape plot shows the percentage of samples that
contain a variant in the specified genes, with HNSCC drivers highlighted in green (left) and genes present in the HaloPlex capture highlighted in yellow (right). The waterfall plot
illustrates the single most damaging variant found per gene and per sample, with colors indicating mutation types. The order of the mutation type legend shows the priority of the mutation
selected when a gene contains multiple variants. M-PPOL: mortal potentially premalignant lesion cultures; IM-PPOL: immortal PPOL cell lines (progressive: P and non-progressive: NP); HNSCC:
Head and neck squamous-cell carcinoma cultures (mortal: M and immortal: IM).
For calling and filtering pathological mutations, we used the strategy described in Material and Methods. The filtering of the sequence variants is shown in Supplementary Data 4. The
filtering was stringent and therefore, it is possible that some genuine pathological mutations may have been excluded. However, the full dataset is available through Dryad Digitial
Repository (https://doi.org/10.5061/dryad.314k5k5).
Given the small numbers of samples examined in our study, we further targeted our analyses to cancer drivers identified by IntOGen (Release 2014.12) The HaloPlex sequencing panel included 8
of the 10 most frequently mutated HNSCC driver genes. Limiting analyses to known cancer drivers also effectively excluded possible false positives that can arise due to DNA replication
timing and low transcriptional activity23. Thus, our significant driver mutations (Fig. 1) mirror those identified by Lawrence and colleagues, 201323 following correction for these factors.
The mutational landscape of PPOL and HNSCC is shown schematically in Fig. 1. Full list of variants is provided in Supplementary Data S5.
Mutations were rare in mortal cultures (Fig. 1). One missense variant each of TP53 and KMT2D were observed in 2 PPOL cultures and one high impact NOTCH1 mutation was observed in HNSCC
culture BICR80.
As with previous studies4,5,6,7, the mutation analyses revealed a small set of genes (TP53, KMT2D CDKN2A, PIK3CA, NOTCH1, and FAT1) as the most common targets for likely deleterious sequence
mutations in immortal PPOL and HNSCC cell lines (Fig. 1). Mutation of TP53 and CDKN2A as an early event in head and neck carcinogenesis is well established17,24,25,26. In the present study,
however, we demonstrate for the first time that mutations of KMTD2, PIK3CA and NOTCH1 also occur early. Furthermore, except for NOTCH1, the mutations are not only present in progressing
lesions (D19, D20, D35) but also in non-progressing lesions (D4, D34, D38). Relatively frequent mutations were also detected in several other IntOgen-defined cancer drivers such as MGA,
PABPC3, NR4A2, NCOR1 and MACF1 (Fig. 1); of these PABPC3, NR4A2, NCOR1 and MACF1 are detected as mutational cancer drivers in head and neck cancer in IntOgen.
Somatic copy number alterations in 7 PPOL cell lines, 11 mortal cell cultures derived from PPOL and 28 HNSCC cell lines (detailed in Supplementary Datas S1 and S6) were derived using array
based technologies. The full dataset of Nexus Copy Number v5.1 (BioDiscovery, Inc., CA, USA) data are available at Dryad Digital Repository (https://doi.org/10.5061/dryad.314k5k5).
Mortal cultures derived from PPOL were genetically stable, showed very few copy number changes and no significant differences compared to matched fibroblasts. These data that are consistent
with their diploid chromosome complement and previous limited loss of heterozygosity analysis16 (Fig. 2a and Supplementary Data S7).
Somatic copy number changes in evolution of HNSCC. (a) Density and frequency plots showing copy number gains (blue) and losses (red) in normal fibroblasts, mortal PPOLs (M-PPOL), immortal
PPOLs (IM-PPOL) and HNSCC cell lines with and without lymph node metastases (LN + ve and LN − ve respectively). (b) Subtraction frequency plots showing differences in copy number gains
(blue) and losses (red) between (i) normal fibroblasts, and mortal PPOLs (M-PPOL), (ii) immortal PPOLs (IM-PPOL) and all HNSCC cell lines and (iii) HNSCC cell lines with and without lymph
node metastases (LN + ve and LN − ve respectively). Both high and all copy number changes are shown for LN + ve and LN − ve HNSCC cell lines. Blue arrows on the right indicate lanes with
regions of difference showing statistical significance (p