- Select a language for the TTS:
- UK English Female
- UK English Male
- US English Female
- US English Male
- Australian Female
- Australian Male
- Language selected: (auto detect) - EN
Play all audios:
ABSTRACT Spending time in natural environments can benefit health and well-being, but exposure-response relationships are under-researched. We examined associations between recreational
nature contact in the last seven days and self-reported health and well-being. Participants (n = 19,806) were drawn from the Monitor of Engagement with the Natural Environment Survey
(2014/15–2015/16); weighted to be nationally representative. Weekly contact was categorised using 60 min blocks. Analyses controlled for residential greenspace and other neighbourhood and
individual factors. Compared to no nature contact last week, the likelihood of reporting good health or high well-being became significantly greater with contact ≥120 mins (e.g. 120–179
mins: ORs [95%CIs]: Health = 1.59 [1.31–1.92]; Well-being = 1.23 [1.08–1.40]). Positive associations peaked between 200–300 mins per week with no further gain. The pattern was consistent
across key groups including older adults and those with long-term health issues. It did not matter how 120 mins of contact a week was achieved (e.g. one long _vs_. several shorter
visits/week). Prospective longitudinal and intervention studies are a critical next step in developing possible weekly nature exposure guidelines comparable to those for physical activity.
SIMILAR CONTENT BEING VIEWED BY OTHERS LONGITUDINAL ASSOCIATIONS BETWEEN GOING OUTDOORS AND MENTAL HEALTH AND WELLBEING DURING A COVID-19 LOCKDOWN IN THE UK Article Open access 22 June 2022
WORKING HOURS INFLUENCE PREFERENCES OF RESIDENTS FOR MICRO FEATURES OF SMALL URBAN GREEN SPACES Article Open access 14 October 2024 ASSOCIATIONS BETWEEN GREEN/BLUE SPACES AND MENTAL HEALTH
ACROSS 18 COUNTRIES Article Open access 26 April 2021 INTRODUCTION A growing body of epidemiological evidence indicates that greater exposure to, or ‘contact with’, natural environments
(such as parks, woodlands and beaches) is associated with better health and well-being, at least among populations in high income, largely urbanised, societies1. While the quantity and
quality of evidence varies across outcomes, living in greener urban areas is associated with lower probabilities of cardiovascular disease2, obesity3, diabetes4, asthma hospitalisation5,
mental distress6, and ultimately mortality7, among adults; and lower risks of obesity8 and myopia9 in children. Greater quantities of neighbourhood nature are also associated with better
self-reported health10,11,12, and subjective well-being13 in adults, and improved birth outcomes14, and cognitive development15, in children. However, the amount of greenspace in one’s
neighbourhood (e.g. percent of land cover in a 1 km radius from the home), or the distance of one’s home to the nearest publically accessible green space or park16 is only one way of
assessing an individual’s level of nature exposure. An alternative is to measure the amount of time individuals actually spend outside in natural environments17,18, sometimes referred to as
‘direct’ exposure19. Both approaches are potentially informative. Residential proximity to nature may be related to health promoting factors such as reduced air and noise pollution (although
the relationships are complex20); and may also provide ‘indirect’ exposure via views from the property21. Residential proximity is also generally positively related to ‘direct’ exposure;
i.e. people in greener neighbourhoods tend to report visiting greenspace more often22. Yet many nature visits take place outside of the local neighbourhood23. Moreover, such visits may
compensate for a lack of nature in the neighbourhood24. In other words, direct exposure, or more specifically in the current context, recreational time spent in natural environments per
week, cannot accurately be inferred from neighbourhood greenspace near the home. Using data from a representative sample of the adult population of England, we aimed to better understand the
relationships between time spent in nature per week and self-reported health and subjective well-being. Our research builds directly on a small number of studies that have started to look
at similar issues17,18,25,26, and answers the call made in several recent reviews for more work in this area27,28. Quantification of these ‘exposure-response’ relationships can contribute to
the policy process, for example by providing evidence upon which to base recommendations regarding the amount of time required to be spent in nature per week to promote positive health and
well-being outcomes. A similar process was used to support development of guidelines on the amount of recommended weekly physical activity needed for health promotion and disease
prevention29. The research advances previous work in three key ways. First, to date, researchers have examined direct nature exposure-response relationships using either a specific visit
duration17, or nature visit frequency over a prolonged period26, or both independently18. By multiplying the duration of a representative visit within the last week by the number of visits
taken within the last week we were able to develop the first weekly exposure metric (i.e. minutes per week) for nature exposure, similar to those used in other health promotion contexts
(e.g. physical activity29). Second, by comparing the coefficients of other, well-established, predictors of health and well-being (e.g. area deprivation) with those for average time spent in
nature per week, we were able to assess the relative strength of any exposure-response relationship. Third, previous studies were constrained in their ability to look at the
generalisability of relationships across different socio-demographic groups due to relatively small, geographically constrained samples. In this study, the current, nationally representative
sample enabled us to stratify, _a priori_, on socio-demographic characteristics, such as age30, gender31, ethnicity32 and area deprivation33, which appeared to moderate the nature-health
association in previous studies22. RESULTS MODELS USING DURATION CATEGORIES Descriptive data on the relationships between time spent in nature in the last 7 days (in 60 min categories) and
self-reported health (Good _vs_. poor) and subjective well-being (High _vs_. low) are presented in Table 1. Percentages per category are presented for both the estimation sample (n =
19,806), and for the sample weighted to be representative of the adult population of England. Similar details for all covariates can be found in Appendix B, and relationships between our key
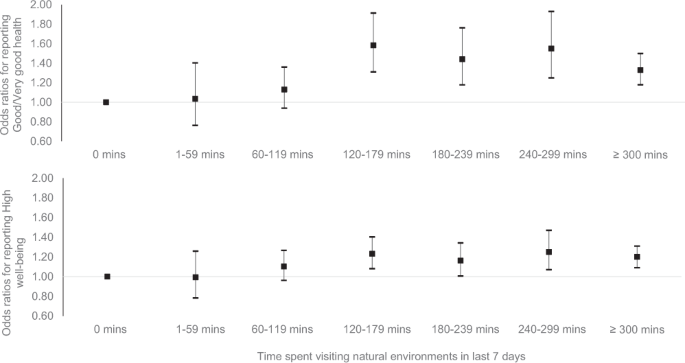
predictor, time in nature, and all other covariates in Appendix C. The odds ratios (ORs) and 95% confidence intervals (CIs) for the survey weighted binomial logistic regressions predicting
health and well-being are presented in Table 2 (full models in Appendix D). In the unadjusted models the odds ratios for reporting ‘good’ health and ‘high’ well-being were significantly
higher for all nature contact ≥60 mins per week compared to 0 mins. Contact of 1–59 mins per week was not associated with better outcomes than 0 mins, and there was also no linear increase
above 60 mins; longer durations were not associated with better outcomes. In the adjusted models, significance only emerged at the ≥120 mins per week category; and again additional duration
was not associated with improved outcomes. The relationship appeared somewhat stronger for health than well-being (Fig. 1). SENSITIVITY ANALYSIS We conducted three types of sensitivity
analysis. First we explored exposure-response relationships using time spent in nature as a continuous variable, and outcomes modelled as binary variables using splines (Fig. 2). The figures
suggested relatively steady increases in the positive relationships for both health and well-being up to around 120 mins, diminishing marginal returns from then until around 200 mins per
week for health and 300 mins for well-being, and then a flattening out or even decrease thereon (though note the very large CIs > 400 mins). Although Fig. 2 should be treated with
caution, due to hourly clustering (see Methods, and Appendix A, Figure C), results broadly support the categorical analyses, with some suggestion that nature exposure beyond 120 mins a week
may have some additional benefits that did not emerge when health and wellbeing were treated as binary variables. Second, we explored exposure-response relationships using time spent in
nature as a categorical variable and health and wellbeing modelled as ordinal variables. Results were again very similar (Appendix E). The only slight change was significance at the 60–119
min category for both outcomes, but this finding is not easily comparable to the binary logistic results for reasons explained in more detail in Appendix E. Our final sensitivity analysis
modelled both time and well-being as continuous variables (Appendix E, Figure D). Again the results were very similar to the original model (Fig. 2b). Due to the inherently ordinal structure
of the general health variable, we were unable to conduct a comparable sensitivity model for health. CONTEXTUALISATION OF RESULTS To contextualise the magnitude of the relationship between
weekly nature contact and health and well-being, Fig. 3 presents the relevant ORs (CIs) alongside those for selected predictors including: neighbourhood greenspace and deprivation; physical
exercise; individual SES; and relationship status (see Appendix D for details on all covariates). The figure highlights that 120–179 mins _vs_. 0 mins of nature contact per week was
associated with: (a) a similar likelihood of reporting good health as, living in an area of low _vs_. high deprivation; meeting _vs_. not meeting physical activity guidelines, and (c) being
in a high _vs_. low SES occupation. Although the association between nature contact at this level and wellbeing was similar to that between high _vs_. low: greenspace, deprivation and
physical activity; it was less important than SES and relationship status. GENERALISABILITY OF RESULTS Table 3 shows results of analyses stratified on key area and individual level factors
(see Appendix F for full details). For these analyses, nature contact was reconfigured into three duration levels reflecting: (a) ‘no exposure’ (0 minutes, ref); (b) ‘low exposure’, not
associated with significantly greater likelihood of good health and high wellbeing (1–119 mins); and (c) ‘high exposure’, i.e. all durations associated with significantly higher likelihood
of good health and high well-being combined (≥120 mins). Estimates from the models of health showed that the positive relationship found for ‘high’ but not ‘low’ exposure, compared to ‘no
exposure’, in the overall model was consistent across those living in urban and rural, and high and low deprivation, areas. It was also consistent for: both males/females; those above/below
65years old; those of high/low occupational social grade; those with/without a long-term illness/disability; and for those who did _vs_. did not meet physical activity recommendations.
Stratification on neighbourhood greenspace suggested those in areas of high (but not low) greenspace also had greater odds of good health if they spent any time in nature per week compared
to 0 mins, possibly reflecting the importance of indirect exposure among this cohort. Stratification on ethnicity showed the threshold was maintained amongst white British, but not ‘other’
respondents. Stratified models of well-being showed that ‘high’ but not ‘low’ exposure was associated with significantly greater odds of high wellbeing in all cases. Additional analyses
found no differences in health and well-being as a function of how ‘high’ exposure was achieved (a) one 120+ min visit; (b) two 60+ min visits; or (c) or three/more ≤ 40 min visits (see
Appendix G for details). DISCUSSION Growing evidence of a positive association between contact with natural environments and health and well-being has led to calls for improved understanding
of any exposure-response relationships27,28. The aim of the current study was to assess these relationships with a measure based on direct exposure to natural environments, rather than
residential proximity, using data from a large nationally representative sample in England. Exposure was defined in terms of the self-reported minutes spent in natural environments for
recreation in the last seven days; and outcomes were self-reported health and subjective well-being. After a range of covariates had been taken into account, individuals who spent between 1
and 119 mins in nature in the last week were no more likely to report good health or high well-being than those who reported 0 mins. However, individuals who reported spending ≥120 mins in
nature last week had consistently higher levels of both health and well-being than those who reported no exposure. Sensitivity analyses using splines to allow duration to be modelled as a
continuous variable suggested that beyond 120 mins there were decreasing marginal returns until around 200–300 mins when the relationship flattened or even dropped. We tentatively suggest,
therefore, that 120 mins contact with nature per week may reflect a kind of “threshold”, below which there is insufficient contact to produce significant benefits to health and well-being,
but above which such benefits become manifest. In terms of magnitude, the association between health, well-being and ≥120 mins spent in nature a week, was similar to associations between
health, well-being and: (a) living in an area of low _vs_. high deprivation; (b) being employed in a high _vs_. low social grade occupation; and (c) achieving _vs_. not achieving recommended
levels of physical activity in the last week. Given the widely stated importance of all these factors for health and well-being, we interpret the size of the nature relationship to be
meaningful in terms of potential public health implications. That the ≥120 mins “threshold” was present even for those who lived in low greenspace areas reflects the importance of measuring
recreational nature contact directly when possible, rather than simply using residential proximity as a proxy for all types of nature exposure. People travel beyond their local
neighbourhoods to access recreational nature experiences, and indeed in our own data those who lived in the least green areas had higher odds of spending ≥120 mins in nature than those
living in greener neighbourhoods (Appendix C). Impoverished local opportunities need not be a barrier to nature exposure23,24. That the “threshold” was also present for those with long-term
illnesses/disability, suggests that the positive overall association in the data was not simply due to healthier people visiting nature more often. One explanation for our findings might be
that time spent in nature is a proxy for physical activity, and it is this which is driving the relationship, not nature contact _per se_. In England, for instance, over 3 million adults
achieve recommended activity levels fully, or in part, in natural settings34. Although: (a) we tried to control for this by including physical activity over the last 7 days in our models;
and (b) the threshold applied to individuals who did not meet activity guidelines; we were unable to fully untangle these issues. Experimental research, however, indicates that some benefits
cannot be due solely to physical activity. Research into shinrin-yoku (Japanese “forest bathing”)35, for instance, suggested that various psycho-physiological benefits can be gained from
merely sitting passively in natural _vs_. urban settings. Moreover, physical activity conducted in nature may be more psychologically beneficial than in other locations36, suggesting a
complex interaction between the two which requires further research to fully understand20. The current results also suggested that it did not matter how the “threshold” was achieved. This
may be because individuals selected exposures to fit their personal preferences and circumstances. For instance, some may prefer long walks on the weekend in locations further from home;
while others may prefer regular shorter visits to parks in the local area. To recommend the former type of person stops their long weekly visit in favour of several shorter trips or _vice
versa_ may be misguided. Whilst this study deepens our understanding of the potential value of spending time outdoors in nature to health and well-being, it is too early to make specific
guidance due to several limitations. First, the data are observational and cross-sectional; and thus, notwithstanding the same pattern holding for those with a long-term illness/disability,
we are unable to rule out the possibility that the association is, at least in part, due to healthier, happier people spending more time in nature. Prospective longitudinal studies of the
kind used to help develop physical activity guidelines29, and nature-based intervention studies are needed to better understand causality. Cimprich and Ronis37, for instance, found that
women recently diagnosed with breast cancer scored higher on several attention tasks, compared to standard care controls, following a five-week period of spending _120 mins per week_ in
‘natural restorative environments’. The authors argued that the 120 mins per week of nature exposure helped the women restore cognitive resources depleted by the stress of their diagnoses
and early treatment. Although our sample was more heterogeneous, weekly nature exposure may work in a similar fashion by reducing generally high levels of stress38. Similar studies are
needed to see how generalizable any potential “threshold” is across a range of situations, and to see how long an individual needs to maintain a certain amount of weekly exposure to achieve
health and well-being gains. Although effects on attentional processes were observed after just 5 weeks in Cimprich and Ronis37, health effects may need longer; and it is also important to
see whether different types of nature contact might confer different benefits. We also note that, although significant, time in nature explained relatively little variance in either health
or wellbeing in these models based on cross-sectional data (approx. 1% in unadjusted models in both cases). It will therefore be important to explore effect sizes in prospective/experimental
studies to better understand the cost/benefit implications of any potentials interventions. Another limitation concerned our estimate of weekly exposure. As duration was asked about only a
single randomly selected visit in the last week, we assumed that at the population level this was representative of all visits. Although rigorous collection protocols meant that the effects
of a typical visit selection are likely to cancel out over a sample of nearly 20,000, we recognise that accuracy at the individual level would be improved if duration were asked about all
visits in the last week. We also acknowledge that our data rely on self-reports and thus results needed to be treated with caution. For instance, self-reported duration is likely to be less
accurate than measures obtained from geo-tracking individuals during specific visits39, or over several days40, and individuals may have been unsure about, or reluctant to discuss, certain
issues which were included as covariates (e.g. long standing illness/disability). Future studies would ideally collate as much data via non self-report measures as possible. We note,
moreover, that unlike exposure to often invisible environmental factors such as air pollution, we can potentially ‘re-live’ our experiences of the natural world in memory, for instance
during periods of ‘mind wandering’, and derive benefits from these recollections independent of those experienced _in situ_41. Thus, an exposure in this context may be considered as the time
_in situ_ plus all subsequent time spent thinking about the experience42. In short, we believe further work is needed to think more critically and creatively about what the term ‘exposure’
means in the current context. We also remain cautious about any potential ≥120 mins “threshold”. In part its emergence may be a consequence of the clustering of duration responses around the
hour mark and subsequent stratification, rather than anything materially different occurring at this level of exposure. The spline models, for instance, suggested a more nuanced pattern.
However, this smoothing of the data was still reliant on a highly non-normal distribution, suggesting that we need to be cautious about these analyses as well. Further work is also needed to
explore the ‘peak’ of returns at around 200–300 mins, to better understand why spending more time in nature is associated with little marginal gain. Thus, we see the tentative “threshold”
and “peak” discussed here more as a starting points for discussion and further investigation, than clearly established findings. Finally, our results say little about exposure ‘quality’.
Research considering the quality of the natural environment in terms of plant and/or animal species richness suggests that experiences may be better in more biodiverse settings25,43. Contact
with nature is more than just a complex multi-sensory experience, to varying degrees personal histories and meanings, longstanding cultural practices, and a sense of place play some role in
the benefits realised44,45,46, factors which may account for why we did not find the same pattern for health individuals not identifying as White British. In the current research, for
instance, exposure estimates relied upon visits undertaken voluntarily, presumably because they had features important to those individuals47 and these effects may not be found if
individuals were to regularly spend 120 mins a week in a natural environment of less personal relevance (e.g. those who self-identified as ‘White European’). Our estimates also explicitly
excluded time spent in one’s own garden which can be an important form of meaningful nature contact for many people48. All of these issues will need greater consideration in future research.
To conclude, although this research suggests that spending ≥120 mins a week in nature may be an important “threshold” for health and well-being across a broad range of the adult population
in England, we believe that more prospective cohort, longitudinal, and experimental studies are required before any clear conclusions can be drawn. In addition to improving the
duration-exposure estimates used here, more research is also needed to understand the impact of different activities undertaken, as well as the effect of environmental quality and personal
meaning. Nevertheless, we see our findings as an important starting point for discussions around providing simple, evidence-based recommendations about the amount of time spent in natural
settings that could result in meaningful promotion of health and well-being. METHODS PARTICIPANTS & PROCEDURE Participants were drawn from Waves 6 and 7 (2014–2015/2015–2016) of the
Monitor of Engagement with the Natural Environment (MENE) survey (the only Waves where our key outcomes were consistently measured). The survey, which is part of the UK government’s National
Statistics, is repeat cross-sectional (different people take part in each wave), and is conducted across the whole of England and throughout the year (approx. 4,000 people per week) to
reduce potential geographical and seasonal biases49. As part of the UK’s official statistics, sampling protocols are extensive, to ensure as representative a sample of the adult English
population as possible. Full details can be found in the annual MENE Technical Reports49 with key features including: (a) “a computerised sampling system which integrates the Post Office
Address file with the 2001 Census small area data at output area level. This enables replicated waves of multi-stage stratified samples”; (b) “the areas within each Standard Region are
stratified into population density bands and within band, in descending order by percentage of the population in socio-economic Grade I and II”; (c) “[in order to] maximise the statistical
accuracy of the sampling, sequential waves of fieldwork are allocated systematically across the sampling frame to ensure maximum geographical dispersion”; (d) “to ensure a balanced sample of
adults within the effective contacted addresses, a quota is set by sex (male, female housewife, female non-housewife); within the female housewife quota, presence of children and working
status and within the male quota, working status”; and (e) “the survey data is weighted to ensure that the sample is representative of the UK population in terms of the standard demographic
characteristics” (ref.49, p.5). Data is collected using in-home face-to-face interviews with responses recorded using Computer Assisted Personal Interviewing (CAPI) software. Although the
total sample for these years was n = 91,190, the health and well-being questions were only asked in every fourth sampling week (i.e. monthly, rather than weekly) resulting in a reduced
sample of n = 20,264. In order to account for any residual biases in sampling at this monthly level, special ‘month’ survey weights are included in the data set. These were applied in the
current analysis to ensure that results remained generalisable to the entire adult population of England. All data were anonymised by Natural England and are publically accessible at:
http://publications.naturalengland.org.uk/publication/2248731?category=47018. Ethical approval was not required for this secondary analysis of publically available National Statistics.
OUTCOMES: SELF-REPORTED HEALTH & SUBJECTIVE WELL-BEING Self-reported health (henceforth: _health_) was assessed using the single-item: ‘How is your health in general?’ (sometimes
referred to as ‘SF1’). Response options were: ‘Very bad’, ‘Bad’, ‘Fair’, ‘Good’ and ‘Very good’. Responses are robustly associated with use of medical services50 and mortality51; and
crucially, for current purposes, neighbourhood greenspace13. Following earlier work we dichotomised responses into ‘Good’ (‘Good/very good’, weighted = 76.5%) and ‘Not good’ (‘Fair/bad/very
bad’, 23.5%)52. Subjective well-being (henceforth: _well-being_) was assessed using the ‘Life Satisfaction’ measure, one of the UK’s national well-being measures53: ‘_Overall how satisfied
are you with life nowadays?’_ with responses ranging from 0 ‘Not at all’ to 10 ‘Completely’. Again, following earlier studies we dichotomised responses into ‘High’ (8–10, 60.2%) and Low
(0–7, 39.8%) well-being54. Histograms of the (non-normal) distributions for both outcome variables are presented in Appendix A. Of note although the dichotomisation points were based on
prior research, they are consistent with the current data; the 50th percentile for health was in the ‘good’ response and for wellbeing in ‘8’. Sensitivity analyses conducted on ordinal (both
health and wellbeing) and linear (wellbeing only) variations of these variables are presented in Appendix E. EXPOSURE: RECREATIONAL NATURE CONTACT IN LAST 7 DAYS Recreational nature
contact, or time spent in natural environments in the last week, was derived by multiplying the number of reported recreational visits per week by the length of a randomly selected visit in
the last week. Participants were introduced to the survey as follows: “_I am going to ask you about occasions in the last week when you spent your time out of doors_. _By out of doors we
mean open spaces in and around towns and cities_, _including parks_, _canals and nature areas; the coast and beaches; and the countryside including farmland_, _woodland_, _hills and rivers_.
_This could be anything from a few minutes to all day_. _It may include time spent close to your home or workplace_, _further afield or while on holiday in England_. _However this does not
include: routine shopping trips or; time spent in your own garden_.” Then they were asked “_how many times_, _if at all_, _did you make this type of visit yesterday/on_ <_DAY_> ” for
each of the previous seven days. Ninety-eight percent of respondents reported ≤7 visits last week. The remaining 2% were capped at 7 visits to avoid dramatically skewing weekly duration
estimates. After basic details of each visit (up to 3 per day) were recorded, a single visit was selected at random by the CAPI software, for the interviewer to ask further questions about,
including: _“How long did this visit last altogether?” (Hours & Minutes)_. Due to random selection, even if the selected visit was not necessarily representative for any given
individual, the randomisation procedure should reduce potential bias at the population level at which our analyses were conducted. Weekly duration estimates were thus derived by multiplying
the duration for this randomly selected visit by the number of stated visits in the last seven days (capped at 7). Following the approach of earlier exposure-response studies in the field
(e.g. Shanahan _et al_., 2016), duration was categorised into 7 categories: 0 mins (n = 11,668); 1–59 mins (n = 355); 60–119 mins (n = 1,113); 120–179 mins (n = 1,290); 180–239 mins (n =
1,014); 240–299 mins (n = 882); ≥300 mins (n = 3,484). An alternative banding at 30 minutes was problematic because of very low Ns for some bands (e.g. 1–29 mins, n = 85), reflecting the
fact that weekly duration estimates clustered around the hour marks, e.g. 78% of the unweighted observations within the 120–179 mins band were precisely 120 mins (See Appendix A, Figure C
for duration histogram). The highest band was capped at ≥300 mins due to the large positive skew of the data. CONTROL VARIABLES Health and well-being are associated with socio-demographic
and environmental characteristics at both neighbourhood (e.g. area deprivation) and individual (e.g. relationship status) levels55. As many of these variables may also be related to nature
exposure they were controlled for in the adjusted analyses. AREA LEVEL CONTROL VARIABLES Area level covariate data was assigned on the spatial level of the Census 2001 Lower-layer Super
Output Areas (LSOAs) in which individuals lived. There were 32,482 LSOAs in England, each containing approximately 1,500 people within a mean physical area of 4km2. NEIGHBOURHOOD GREENSPACE
In order to understand how much greenspace is in an individual’s neighbourhood, we derived an area density metric using the Generalised Land Use Database (GLUD)56. The GLUD provides, for
each LSOA in England, the area covered by greenspace and domestic gardens. These were summed and divided by the total LSOA area to provide the greenspace density metric. This metric was
allocated to each individual in the sample, based on LSOA of residence. Following previous literature, individuals were assigned to one of five quintiles of greenspace based on this
definition (ranging from least green to most green)33. Rather than derive quintiles of greenspace from the current sample (i.e. divide the current sample into five equal parts based on the
percentage of greenspace in their LSOA), we assigned individuals instead to one of five pre-determined greenspace quintiles based on the distribution of greenspace across all 32,482 LSOAs in
England. Although this meant that we did not get exactly equal 20% shares of our current sample across greenspace quintiles (although due to the sampling protocol we were still very close
to this, see Appendix B) this approach allowed inferences to be made across the entire country, rather than simply to the current sample. In exploratory sensitivity analyses we defined
greenspace as the GLUD category ‘greenspace’ only, with the GLUD category ‘gardens’ excluded. This produced very similar results, so we focused on the more inclusive definition including
both aspects. In further exploratory sensitivity analyses, we assigned individuals to five greenspace categories defined by equal ranges of greenspace coverage (e.g. 0–20%, 21–40%, 41–60%
etc.) rather than quintiles based on percentages of the population. This also produced very similar results, so again we decided to go with the most common approach. In subsequent analyses
the least green quintile acted as the reference category. AREA DEPRIVATION Each LSOA in England is assessed in terms of several parameters of deprivation, including unemployment and crime,
levels of educational, income, health metrics, barriers to housing and services, and the living environment. A total Index of Multiple Deprivation (IMD) score is derived from these
subdomains57. Following previous studies52, we assigned individuals into deprivation quintiles based on the LSOA in which they lived. As with greenspace, the cut points for area deprivation
quintiles were also based on all LSOAs in England, rather than those in the current sample, to allow inference to the population as a whole (most deprived quintile = _ref_). AIR POLLUTION An
indicative measure of air pollution was operationalised as LSOA background PM10 assigned to tertiles of all LSOAs in England (lowest particulate concentration = _ref_). PM10 concentrations,
based on Pollution Climate Mapping (PCM) model simulations58, were averaged over the period 2002–2012, and aggregated from 1 km square resolution to LSOAs. INDIVIDUAL LEVEL CONTROLS
Individual level controls comparable to earlier studies in this area6,7,12,13,15 included: sex (male = _ref_); age (categorised as 16–64 = _ref_; 65+); occupational social grade (AB
(highest, e.g. managerial), C1, C2 and DE (lowest, e.g. unskilled labour, = _ref_) as a proxy for individual socio-economic status (SES); employment status (full-time, part-time, in
education, retired, not working/unemployed = _ref_); relationship status (married/cohabiting; single/separated/divorced/widowed = _ref_); ethnicity (White British; other = _ref_); number of
children in the household (≥1 _vs_. 0 = _ref_); and dog ownership (Yes; No = _ref_). Two further control variables were particularly important. First, the survey asked: ‘_Do you have any
long standing illness_, _health problem or disability that limits your daily activities or the kind of work you can do?_’ (‘Restricted functioning’: Yes; No = _ref_). Including this
variable, at least in part, controls for reverse causality. If similar associations between nature exposure and health and well-being are found for both those with and without restricted
functioning, this would support the notion that the associations are not merely due to healthier, more mobile people visiting nature more often. We also controlled for the number of days per
week people reported engaging in physical activity >30 mins; in the current analysis dichotomised as either meeting or not meeting guidelines of 150 mins per week (i.e. 5 days in the
week with physical activity >30 mins). Some people achieve this guideline though physical activity in natural settings35, thus, any association between time spent in nature and health may
simply be due to the physical activity engaged in these settings. We believe this is not the case in the current context because the (rank order) correlation between weekly nature contact
and the number of days a week an individual engaged in >30 mins of physical activity was just rs = 0.27. Nevertheless, by controlling for weekly activity levels, modelled relationships
between time in nature and health have less bias from this source, and, therefore, improved estimates of association with nature exposure _per se_. TEMPORAL CONTROLS Due to the multi-year
pooled nature of the data, year/wave was also controlled for. Preliminary analysis found no effect of the season in which the data were collected so this was excluded from final analyses.
ANALYSIS STRATEGY Survey weighted binomial logistic regressions were used to predict the relative odds that an individual would have ‘Good’ health or ‘High’ well-being as a function of
weekly nature exposure in terms of duration categories per week. Model fit was provided by pseudo R2; here the more conservative Cox and Snell estimate. The outcome binary variables were
first regressed against the exposure duration categories to test direct relationships; adjusted models were then specified to include the individual and area level control variables. Due to
missing area level data for a small minority of participants (n = 456), our estimation samples for these adjusted models were n = 19,808. Preliminary analysis found that the weighted
descriptive proportions among this reduced estimation sample differed only negligibly from those among all available observations in the wider MENE sample, suggesting our complete case
analysis approach did not distort the population representativeness of the estimation sample. The full n = 20,264 sample was maintained for the unadjusted model to provide the most accurate,
weighted representation of the data, as reducing unadjusted models to n = 19,808 produced practically identical results. Although our main analyses used duration _categories_ of weekly
nature contact, an exploratory analysis used generalized additive models incorporating a penalized cubic regression spline of duration as a continuous variable (adjusting for the same set of
covariates). This enabled us to produce a ‘smoother’ plot of the data. Analyses and plotting was done using R version 3.4.1, using packages mgcv and visreg59. To explore the
generalisability of any pattern across different socio-demographic groups, we also _a priori_ stratified the analyses on several area and individual covariates (as defined above) which have
been found to be important in previous studies: (a) Urbanicity; (b) Neighbourhood greenspace; (c) Area deprivation; (d) Sex; (e) Age; (f) Restricted functioning; (g) Individual
socio-economic status (SES); (f) Ethnicity; and (g) Physical activity. In the case of the three multi-category predictors (area greenspace/deprivation, individual SES), binary
classifications were derived for the stratified analyses to maintain robust sample sizes in each category. In the case of LSOA greenspace and deprivation binary splits were made based on the
median cut-point for all LSOAs in England; SES was dichotomised by collapsing the social grade categories in the standard way, A/B/C1 _vs_. C2/D/E. REFERENCES * Hartig, T. & Kahn, P. H.
Living in cities, naturally. _Science_ 352, 938–940 (2016). Article CAS ADS PubMed Google Scholar * Kardan, O. _et al_. Neighborhood greenspace and health in a large urban center. _Sci
Rep_ 5, 11610 (2015). Article ADS PubMed PubMed Central Google Scholar * Halonen, J. I. _et al_. Green and blue areas as predictors of overweight and obesity in an 8‐year follow‐up
study. _Obesity_ 22, 1910–1917 (2014). Article PubMed Google Scholar * Astell-Burt, T., Feng, X. & Kolt, G. S. Is neighborhood green space associated with a lower risk of type 2
diabetes? Evidence from 267,072 Australians. _Diabetes Care_ 37, 197–201 (2014). Article PubMed Google Scholar * Alcock, I. _et al_. Land cover and air pollution are associated with
asthma hospitalisations: A cross-sectional study. _Environ Int_ 109, 29–41 (2017). Article CAS PubMed Google Scholar * Mitchell, R. J., Richardson, E. A., Shortt, N. K. & Pearce, J.
R. Neighborhood environments and socioeconomic inequalities in mental well-being. _Am J Prev Med_ 49, 80–84 (2015). Article PubMed Google Scholar * Gascon, M. _et al_. Residential green
spaces and mortality: a systematic review. _Environ Int_ 86, 60–67 (2016). Article PubMed Google Scholar * Wood, S. L. _et al_. Exploring the relationship between childhood obesity and
proximity to the coast: A rural/urban perspective. _Health Place_ 40, 129–136 (2016). Article PubMed Google Scholar * Dadvand, P. _et al_. Green spaces and spectacles use in
schoolchildren in Barcelona. _Environ Res_ 152, 256–262 (2017). Article CAS PubMed Google Scholar * Dadvand, P. _et al_. Surrounding greenness and pregnancy outcomes in four Spanish
birth cohorts. _Environ Health Persp_ 120, 1481 (2012). Article Google Scholar * Dadvand, P. _et al_. Green spaces and cognitive development in primary schoolchildren. _PNAS_ 112,
7937–7942 (2015). Article CAS ADS PubMed PubMed Central Google Scholar * Maas, J., Verheij, R. A., Groenewegen, P. P., De Vries, S. & Spreeuwenberg, P. Green space, urbanity, and
health: how strong is the relation? _J Epidemiol Commun H_ 60, 587–592 (2006). Article Google Scholar * Mitchell, R. & Popham, F. Greenspace, urbanity and health: relationships in
England. _J Epidemiol Commun H_ 61, 681–683 (2007). Article Google Scholar * Seresinhe, C. I., Preis, T. & Moat, H. S. Quantifying the impact of scenic environments on health. _Sci
Rep_, _5_, https://doi.org/10.1038/srep16899 (2015). * White, M. P., Alcock, I., Wheeler, B. W. & Depledge, M. H. Would you be happier living in a greener urban area? A fixed-effects
analysis of panel data. _Psychol Sci_ 24, 920–928 (2013). Article PubMed Google Scholar * Ekkel, E. D. & de Vries, S. Nearby green space and human health: Evaluating accessibility
metrics. _Landscape Urban Plan_ 157, 214–220 (2017). Article Google Scholar * Barton, J. & Pretty, J. What is the best dose of nature and green exercise for improving mental health? A
multi-study analysis. _Environ Sci Technol_ 44, 3947–3955 (2010). Article CAS ADS PubMed Google Scholar * Shanahan, D. F. Health benefits from nature experiences depend on dose. _Sci
Rep_ 6, 28551 (2016). Article ADS PubMed PubMed Central Google Scholar * Keniger, L. E., Gaston, K. J., Irvine, K. N. & Fuller, R. A. What are the benefits of interacting with
nature? _Int J Environ Res Pub He_ 10, 913–935 (2013). Article Google Scholar * Hartig, T., Mitchell, R., de Vries, S. & Frumkin, H. Nature and health. _Annu Rev Publ Health_ 35,
207–228 (2014). Article Google Scholar * Nutsford, D., Pearson, A. L., Kingham, S. & Reitsma, F. Residential exposure to visible blue space (but not green space) associated with lower
psychological distress in a capital city. _Health Place_ 39, 70–78 (2016). Article PubMed Google Scholar * Grahn, P. & Stigsdotter, U. A. Landscape planning and stress. _Urban For
Urban Gree_ 2, 1–18 (2003). Article Google Scholar * Hillsdon, M., Coombes, E., Griew, P. & Jones, A. An assessment of the relevance of the home neighbourhood for understanding
environmental influences on physical activity: how far from home do people roam? _Int J Behav Nutr Phy_ 12, 100 (2015). Article Google Scholar * Sijtsma, F. J., de Vries, S., van Hinsberg,
A. & Diederiks, J. Does ‘grey’ urban living lead to more ‘green’ holiday nights? A Netherlands Case Study. _Landscape Urban Plan_ 105, 250–257 (2012). Article Google Scholar * Cox, D.
T. _et al_. Doses of nearby nature simultaneously associated with multiple health benefits. _Int J Environ Res Pub He_ 14, 172 (2017). Article Google Scholar * Flowers, E. P., Freeman, P.
& Gladwell, V. F. A cross-sectional study examining predictors of visit frequency to local green space and the impact this has on physical activity levels. _BMC Public Health_ 16, 420
(2016). Article PubMed PubMed Central Google Scholar * Shanahan, D. F., Fuller, R. A., Bush, R., Lin, B. B. & Gaston, K. J. The health benefits of urban nature: how much do we need?
_Bioscience_ 65, 476–485 (2015). Article Google Scholar * Frumkin, H. _et al_. Nature contact and human health: A research agenda. _Environ Health Persp_ 125, 075001–1 (2017). Article
Google Scholar * Haskell, W. L. _et al_. Physical activity and public health: updated recommendation for adults from the American College of Sports Medicine and the American Heart
Association. _Circulation_ 116, 1081–93 (2007). Article PubMed Google Scholar * Astell-Burt, T., Mitchell, R. & Hartig, T. The association between green space and mental health varies
across the lifecourse. A longitudinal study. _J Epidemiol Commun H_ 68, 578–583 (2014). Article Google Scholar * Richardson, E. A. & Mitchell, R. Gender differences in relationships
between urban green space and health in the United Kingdom. _Soc Sci Med_ 71, 568–575 (2010). Article PubMed Google Scholar * Gentin, S. Outdoor recreation and ethnicity in. _Europe—A
review. Urban For Urban Gree_ 10, 153–161 (2011). Article Google Scholar * Mitchell, R. & Popham, F. Effect of exposure to natural environment on health inequalities: an observational
population study. _Lancet_ 372, 1655–1660 (2008). Article PubMed Google Scholar * White, M. P. _et al_. Recreational physical activity in natural environments and implications for health:
A population based cross-sectional study in England. _Prev Med_ 91, 383–388 (2016). Article CAS PubMed Google Scholar * Park, B. J., Tsunetsugu, Y., Kasetani, T., Kagawa, T. &
Miyazaki, Y. The physiological effects of Shinrin-yoku (taking in the forest atmosphere or forest bathing): evidence from field experiments in 24 forests across Japan. _Environ Health Prev_
15, 18–26 (2010). Article Google Scholar * Thompson Coon, J. _et al_. Does participating in physical activity in outdoor natural environments have a greater effect on physical and mental
wellbeing than physical activity indoors? A systematic review. _Environ Sci Tech_ 45, 1761–1772 (2011). Article CAS Google Scholar * Cimprich, B. & Ronis, D. L. An environmental
intervention to restore attention in women with newly diagnosed breast cancer. _Cancer Nurs_ 26, 284–292 (2003). Article PubMed Google Scholar * Ward Thompson, C. _et al_. More green
space is linked to less stress in deprived communities: Evidence from salivary cortisol patterns. _Landscape Urban Plan_ 105, 221–229 (2012). Article Google Scholar * Doherty, S. T.,
Lemieux, C. J. & Canally, C. Tracking human activity and well-being in natural environments using wearable sensors and experience sampling. _Soc Sci Med_ 106, 83–92 (2014). Article
PubMed Google Scholar * Cooper, A. R. _et al_. Patterns of GPS measured time outdoors after school and objective physical activity in English children: the PEACH project. _Int J Behav Nutr
Phy_ 7, 31 (2010). Article Google Scholar * Smallwood, J. & Schooler, J. W. The science of mind wandering: empirically navigating the stream of consciousness. _Annu Rev Psychol_ 66,
487–518 (2015). Article PubMed Google Scholar * Clawson, M. & Knetsch, J. L. _Economics of outdoor recreation_: Washington, DC: Resources for the Future (1966). * de Vries, S., van
Dillen, S. M., Groenewegen, P. P. & Spreeuwenberg, P. Streetscape greenery and health: stress, social cohesion and physical activity as mediators. _Soc Sci Med_ 94, 26–33 (2013). Article
PubMed Google Scholar * Bell, S. L., Phoenix, C., Lovell, R. & Wheeler, B. W. Using GPS and geo‐narratives: a methodological approach for understanding and situating everyday green
space encounters. _Area_ 47, 88–96 (2015). Article Google Scholar * Hartig, T. _et al_. Health benefits of nature experience: Psychological, social and cultural processes. In Nilsson, K.
_et al_. (Eds), _Forests_, _trees_, _and human health_ (pp. 127–168). Dordrecht: Springer (2011). * Völker, S. & Kistemann, T. Developing the urban blue: comparative health responses to
blue and green urban open spaces in Germany. _Health Place_ 35, 196–205 (2015). Article PubMed Google Scholar * Korpela, K. M., Ylén, M., Tyrväinen, L. & Silvennoinen, H. Favorite
green, waterside and urban environments, restorative experiences and perceived health in Finland. _Health Promot Int_ 25, 200–209 (2010). Article PubMed Google Scholar * Stigsdotter, U.
& Grahn, P. What makes a garden a healing garden. _J Thera Hort_ 13, 60–69 (2002). Google Scholar * Natural England. Monitor of Engagement with the Natural Environment: the national
survey on people and the natural environment. _Technical Report to the 2009-16 Surveys_. Natural England Joint Report JP023 (2017). * Miilunpalo, S., Vuori, I., Oja, P., Pasanen, M. &
Urponen, H. Self-rated health status as a health measure: the predictive value of self-reported health status on the use of physician services and on mortality in the working-age population.
_J Clin Epidemiol_ 50, 517–528 (1997). Article CAS PubMed Google Scholar * Kyffin, R. G., Goldacre, M. J. & Gill, M. Mortality rates and self-reported health: database analysis by
English local authority area. _Brit Med J_ 329, 887–888 (2004). Article PubMed PubMed Central Google Scholar * Wheeler, B. W. _et al_. Beyond Greenspace: An ecological study of
population general health and indicators of natural environment type and quality. _Int J Health Geogr_ 14, 17, https://doi.org/10.1186/s12942-015-0009-5 (2015). Article PubMed PubMed
Central Google Scholar * Office of National Statistics (ONS). _Measuring Subjective Well-being_. London: Office of National Statistics (2011). * White, M. P., Pahl, S., Wheeler, B. W.,
Depledge, M. H. & Fleming, L. E. Natural environments and subjective wellbeing: Different types of exposure are associated with different aspects of well-being. _Health Place_ 45, 77–84
(2017). Article PubMed Google Scholar * Nan, L., Jeffrey, A. J., James, W. S., David, F. & Joel, S. C. Self-Reported Health Status of the General Adult U.S. Population as Assessed by
the EQ-5D and Health Utilities Index. _Med Care_ 43, 1078–1086 (2005). Article Google Scholar * Office of the Deputy Prime Minister (OPDM). _Generalised Land Use Database Statistics for
England_. London: ODPM Publications (2005). * Department of Communities and Local Government (DCLG). _The English Indices of Deprivation 2007_. London: Communities and Local Government
(2008). * Brookes, D. M. _et al_. Technical report on UK supplementary assessment under the Air Quality Directive (2008/50/EC), the Air Quality Framework Directive (96/62/EC) and Fourth
Daughter Directive (2004/107/EC) for 2014 (2016). * R Core Team. R: A language and environment for statistical computing. R Foundation for Statistical Computing, Vienna, Austria,
https://www.R-project.org/ (2017). Download references ACKNOWLEDGEMENTS This work was supported by the National Institute for Health Research Health Protection Research Unit (NIHR HPRU) in
Environmental Change and Health at the London School of Hygiene and Tropical Medicine in partnership with Public Health England (PHE), and in collaboration with the University of Exeter,
University College London, and the Met Office. The funders had no role in the study design, analysis, interpretation of data, or decision to submit the article for publication. The views
expressed are those of the author(s) and not necessarily those of the NHS, the NIHR, the Department of Health, or Public Health England. We would like thank an earlier reviewer and the
editorial board team for suggestions on how to improve an earlier version of this manuscript. AUTHOR INFORMATION AUTHORS AND AFFILIATIONS * European Centre for Environment and Human Health,
University of Exeter Medical School, Exeter, UK Mathew P. White, Ian Alcock, James Grellier, Benedict W. Wheeler, Sara L. Warber, Angie Bone, Michael H. Depledge & Lora E. Fleming *
Institute for Housing and urban Research, Uppsala University, Box 514, SE-75120, Uppsala, Sweden Terry Hartig * Department of Family Medicine, University of Michigan Medical School, Ann
Arbor, MI, USA Sara L. Warber Authors * Mathew P. White View author publications You can also search for this author inPubMed Google Scholar * Ian Alcock View author publications You can
also search for this author inPubMed Google Scholar * James Grellier View author publications You can also search for this author inPubMed Google Scholar * Benedict W. Wheeler View author
publications You can also search for this author inPubMed Google Scholar * Terry Hartig View author publications You can also search for this author inPubMed Google Scholar * Sara L. Warber
View author publications You can also search for this author inPubMed Google Scholar * Angie Bone View author publications You can also search for this author inPubMed Google Scholar *
Michael H. Depledge View author publications You can also search for this author inPubMed Google Scholar * Lora E. Fleming View author publications You can also search for this author
inPubMed Google Scholar CONTRIBUTIONS M.W. conceived of the study in discussion with T.H., M.D. and L.E.F.; M.W., I.A. and J.G. conducted the analyses; B.W., S.W. and A.B. made additional
analysis suggestions and provided text/references on specific sections. All authors contributed to the text of the manuscript and reviewed the final submission. CORRESPONDING AUTHOR
Correspondence to Mathew P. White. ETHICS DECLARATIONS COMPETING INTERESTS The authors declare no competing interests. ADDITIONAL INFORMATION PUBLISHER’S NOTE: Springer Nature remains
neutral with regard to jurisdictional claims in published maps and institutional affiliations. SUPPLEMENTARY INFORMATION SUPPLEMENTARY MATERIALS RIGHTS AND PERMISSIONS OPEN ACCESS This
article is licensed under a Creative Commons Attribution 4.0 International License, which permits use, sharing, adaptation, distribution and reproduction in any medium or format, as long as
you give appropriate credit to the original author(s) and the source, provide a link to the Creative Commons license, and indicate if changes were made. The images or other third party
material in this article are included in the article’s Creative Commons license, unless indicated otherwise in a credit line to the material. If material is not included in the article’s
Creative Commons license and your intended use is not permitted by statutory regulation or exceeds the permitted use, you will need to obtain permission directly from the copyright holder.
To view a copy of this license, visit http://creativecommons.org/licenses/by/4.0/. Reprints and permissions ABOUT THIS ARTICLE CITE THIS ARTICLE White, M.P., Alcock, I., Grellier, J. _et
al._ Spending at least 120 minutes a week in nature is associated with good health and wellbeing. _Sci Rep_ 9, 7730 (2019). https://doi.org/10.1038/s41598-019-44097-3 Download citation *
Received: 08 May 2018 * Accepted: 08 May 2019 * Published: 13 June 2019 * DOI: https://doi.org/10.1038/s41598-019-44097-3 SHARE THIS ARTICLE Anyone you share the following link with will be
able to read this content: Get shareable link Sorry, a shareable link is not currently available for this article. Copy to clipboard Provided by the Springer Nature SharedIt content-sharing
initiative