- Select a language for the TTS:
- UK English Female
- UK English Male
- US English Female
- US English Male
- Australian Female
- Australian Male
- Language selected: (auto detect) - EN
Play all audios:
ABSTRACT Volcanic activity is often preceded or accompanied by different types of seismo-volcanic signals. Among these signals, the so-called tornillo (Spanish for “screw”) events are
considered to belong to a unique class of volcano-seismicity characterised by a long-duration coda, amplitude modulation and high-quality factor. These data constitute important evidence for
the gas fraction inside magmatic fluids. However, the mechanism behind this unique signal remains not fully understood. Here we report new laboratory evidence showing that two different
processes have either scale-invariant or scale-dependent effects in generating tornillo-like events. These processes are respectively the gas pressure gradient, which triggers the event and
regulates the slow decaying coda, and the fluid resonance into small scale structures which, in turn, control the frequency content of the signal. Considering that the gas pressure gradient
is proportional to the fluid flow, these new findings, as applied to volcanoes, provide new information to better quantify both gas rate and volume, and the dimension of the resonator.
SIMILAR CONTENT BEING VIEWED BY OTHERS MAGMA PRESSURE DISCHARGE INDUCES VERY LONG PERIOD SEISMICITY Article Open access 08 October 2021 DEFORMATION-CONTROLLED LONG-PERIOD SEISMICITY IN
LOW-COHESION VOLCANIC SEDIMENTS Article 29 November 2021 A REVIEW FRAMEWORK OF HOW EARTHQUAKES TRIGGER VOLCANIC ERUPTIONS Article Open access 12 February 2021 INTRODUCTION TORNILLO SEISMIC
EVENTS Interpreting the diverse seismological signals generated by active volcanoes is fundamental in order to better understand the physics of the underlying process. Among these signals,
the class of volcano-tectonic (VT) earthquakes are connected to the stability of the local volcanic system and thought to be diagnostic of deformation processes within it1, particularly of
rock shear failure2. Conversely, seismo-volcanic signals resonating at lower frequencies, and hence known as Low Frequency Seismicity (LFS) events, are linked to fluid-movement processes1.
The LFS class contains a number of sub-classes, with one particular type having a unique waveform: due to its screw-like shape, known as tornillo, Spanish for screw3,4,5. These signals have
been observed on many different volcanoes around the world such as Galeras4, Puracé6, Asama-yama7, Tongariro8, Mt. Griggs9, Kelut10, Lokon Volcano11, and Vulcano12. Historically, LFS events
were originally included in the Long Period (LP) signal sub-class due to their similar shallow location (up to 1.5 km depth), with effective monitoring only achieved by seismic stations near
the active craters6,8,10,12. Tornillo’s recent classification as standalone class has evolved due to their characteristic waveform12 and their source mechanism13, due in part to more
effective near-field instrumentation. They have been observed either as individual events or in swarms5 and in different regimes of volcanic activity, i.e. either pre-, co- and post-eruptive
phases and in quiescence5,6. A good example of the significance of the tornillo class is that of Galeras (Colombia), where the choked volcanic conduit caused the pressurization of the
volcanic system and the following explosive activity in 1992–1993. Tornillos were recorded before the explosive volcanic events and were linked to the steadily decreasing gas emissions as
the eruption approached14. Tornillo-shaped infrasound events have also been recorded, most recently at Cotopaxi volcano (Ecuador) as described by Johnson _et al_.15. Tornillos are
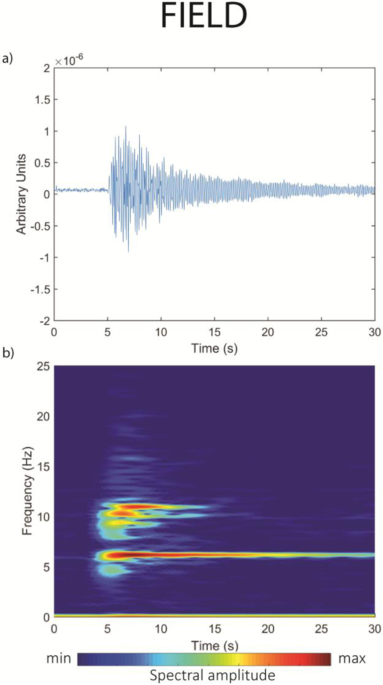
characterized by a combination of an impulsive/emergent excitation, a resonant vibrator with a characteristic amplitude modulation feature12 and an exponentially decaying Hilbert envelope16
causing a long (up to several minutes) quasi-linear slowing decaying coda12 (Fig. 1a). Their onset is emergent or impulsive, often with a positive first arrival5 and waveforms recorded at
different sites have a high degree of similarity17. In terms of frequency content, tornillos have a quasi-monochromatic waveform or few (1–3) narrow spectral peaks (Fig. 1b), which are
preserved at different seismic stations4,5, although some multichromatic events have been observed at Galeras16. Similarly to LPs and volcanic tremor, the generation of tornillos was thought
to be due to the resonance of a fluid-filled crack or a conduit in response to a pressure transient12,18,19, with the higher quality factor (Q) compared to LP signals attributed to
water-filled cracks10, a higher gas fraction2,20, or the small aspect ratio cracks21. Other theories include the lumped-parameter model3 and a model based on the self-excitation of flow,
yielding eddy shedding and turbulent (slug flow) oscillations22. However, none of these models could account for all available observations and incorporate tornillo characteristics16.
Therefore, the appearance of tornillo events may be an indication of physical interaction (and conditions) between fluid flow and the surrounding conduit material. In particular, an increase
in signal’s duration and a decrease in the dominant frequency preceding an eruption is frequently observed, likely due to an increase in gas fraction4,5,10,12. Tornillos at Tongariro have
been localized just below the condensate layer, where a gas-filled region is known to be present8. However, a pure gas phase or gas-liquid mixture is not able to generate a sufficient
impedance contrast between the fluid and the conduit (hence large Q) and instead a gas-ash mixture is considered as the oscillating fluid8,20. While several authors2,17,20 assigned a major
role to the interaction between the gas fraction and the solid walls in generating these unique seismic events, this relationship was never quantified. Therefore, to investigate and to
better understand these fluid-induced signals, we have developed a laboratory setup enabling us to measure and control parameters such as temperature, axial and confining stresses, and pore
pressure. We use Nitrogen gas as the key phase, deliberately venting the highly-pressurized gas stored within a borehole and a highly cracked region naturally formed from a shear/damage zone
of basalt (Mt. Etna, Italy), rapidly to atmosphere. METHODS The rock used for this study was an alkali, porphyritic basalt collected from the southern flank of Mt. Etna (Italy). Basalt
cylindrical samples (100 mm in length and 40 mm in diameter) were drilled with an axial conduit (3 mm in diameter) using a diamond core drill. Density and porosity were measured on 29
specimens (before being axially drilled), yielding a density of 2860 kg/m3 ± 10 and porosity of 2.05% ± 0.23. Triaxial deformation experiments were performed at the Rock Mechanics Laboratory
at the University of Portsmouth (UK), using a conventional servo-controlled triaxial apparatus23 (Sanchez Technologies, Fig. 2) in dry conditions, with confining pressure (pc) of 30 MPa and
temperature of 25 °C. Deformation was imposed at a constant strain rate of 10−5 s−1, up to and 1 minute beyond the dynamic failure. At this point the differential stress was removed to
reach hydrostatic stress conditions and lock the newly created damage zone. Following this stage, nitrogen gas was injected inside the sample and pressurized up to 10 MPa. To maintain the
same effective pressure of 30 MPa, the hydrostatic stress was brought to 40 MPa (corresponding to a depth of 1.4 km), at the same rate of the gas pressure. Once equilibrium was reached, gas
pressure was released by a solenoid valve, placed beneath the lower end of the sample. The triaxial apparatus was equipped with external displacement and pressure transducers, connected to a
high-speed data logger, in order to record the mechanical data at high sampling frequency (5 kHz). For the pore pressure, two transducers were used, connected to the upper and lower end of
the sample respectively, with the latter being close to the solenoid valve. Microseismic events, known as Acoustic Emissions (AE) in a laboratory context, were recorded by 12 custom-made PZT
transducers (Roditi 5A compressional crystals), with central frequency at 1 MHz, at a sampling frequency of 10 MHz. The transducers were installed in an engineered FKM-B rubber jacket24, in
which the cylindrical sample was held. Output from the sensors was first band-pass filtered (40 kHz–1 MHz), to remove low frequency noise (<40 kHz) and high frequency electrical
interferences (>1 MHz), and amplified with a gain of 30 dB. Using a bespoke AE data digitization system (ITASCA-Image) AE data (voltages) were recorded continuously around the time of
pore pressure (pp) release and stopped once AE activity had ceased. Complementing the laboratory dataset we present waveform data of a tornillo event recorded by the IVCR permanent seismic
station on Vulcano Island on November 7, 200812. This station is part of the Vulcano seismic network run by the Istituto Nazionale di Geofisica e Vulcanologia, Osservatorio Etneo - Sezione
di Catania, Italy and composed of broad-band 3-component digital seismometers recording at a sampling rate of 100 Hz12,17. To compare with our 1-component (vertical) sensors, only the
waveform recorded by the vertical component was processed. To determine the relationship between pore pressure difference and fluid flow speed, we first apply Newton’s second law of motion
and the pressure-gradient force equations. The pressure difference between the two ends of the sample generates a pressure-gradient force, which considering the Newton’s second law of motion
gives: $$F=m\cdot a$$ (1) where _F_ is the force, _m_ is the mass of a cubic fluid parcel of a fluid and _a_ is the acceleration. The mass of the cubic parcel can be written in terms of the
product between the density (_ρ_), the surface area (_dA_) and the height (_dz_): $$m=\rho \cdot dz\cdot dA$$ (2) The pressure-gradient force can now be written as the product of the pore
pressure difference (_dP_) and the surface area (_dA_): $$F=dP\cdot dA$$ (3) Combining Eqs 2 and 3, Eq. 1 can be expressed as: $$dP\cdot dA=\rho \cdot dz\cdot dA\cdot a$$ (4) Rearranging Eq.
4: $$a=\frac{dP}{\rho \cdot dz}$$ (5) Equation. 5 shows that the acceleration of a parcel of fluid is directly proportional to the pressure difference across a surface. By integrating the
acceleration over time, we now calculate the flow speed of the moving fluid, allowing a direct correlation to be made to the measured pressure difference. RESULTS AND DISCUSSION During
pressure release in experiment EB31, a characteristic AE is recorded (Fig. 3a,b). The onset of this AE event occurs at the time of the gas pressure release (t = 2 s), generating two
short-lived pulses before generating a screw-like shaped waveform lasting approximately 15 s. Each pulse was concurrent with a short-lived increase in pore pressure recorded at the bottom of
the sample, while both top and bottom pore pressure continuously decreased (at different decaying rate) during the long-duration signal. Qualitatively, there is a high degree of similarity
between the continuous AE signal and that of a tornillo event. As an example, we report an event recorded at Vulcano Island, Italy12 (Fig. 1a,b). Both show durations of some tens of seconds,
meaning that the AE signal has a remarkably long-duration (AE signals typically range from microseconds to milliseconds25,26), with a exponentially-decaying coda, giving both waveforms the
characteristic screw-like tornillo shape. However, a clear difference between the two signals is also evident: while the waveform of the tornillo event appears to be a single event, the
waveform of the AE event is characterized by the concurrent presence of numerous transients. These do not modify the overall shape of the continuous signal, and are likely explained in terms
of sampling frequency (100 Hz in the field and 10 MHz in the laboratory), which allows short-duration events to be recorded in the laboratory experiment but are naturally filtered out in
the field. Although the tornillo event (Fig. 1a) and its laboratory analogue (Fig. 3a) originated at very different scales, they are in general agreement when applied to a simple size (_d_)
– frequency (_f_) scaling law25,26. And, although the resonating frequency is scale-dependent, the similar duration for both field and laboratory signals suggests a scale-invariant process
behind the slowly decaying coda. We also note that AE signals lasting for tens of seconds has never been reported. SCALE-INVARIANT PROCESS To understand the key links between pore pressure,
signal duration and the associated slowly decaying coda, comparison is made to a second experiment run at the same pressure conditions (experiment EB35, pc = 40 MPa, pp = 10 MPa, Fig. 3c,d).
In this case no long-duration AE activity was recorded. However a short-lived signal, visible in the spectrogram around t = 2 s (Fig. 3d), occurs concurrently with a sudden decrease in the
lower pore pressure, and not followed immediately by the top pore pressure. Within approximately 1 second, the signal weakens concurrently with both pore pressure curves, reaching similar
values and decaying at similar rate. Again taking a simple qualitative comparison, we note that: (1), the gas pressure release is necessary but not sufficient to generate long-duration AE
activity on its own and (2), a pore pressure difference is a fundamental requirement to generate long-duration AE activity. This trend was evident across 4 experiments run with Nitrogen
(Figs 3 and 4a,b) and even during the pressurization stage (Fig. 4c). Here, also experiment EB32 (Fig. 4a) and EB33 (Fig. 4b) do not show enough pore pressure difference to generate a
continuous signal, although a short-lived high difference is linked to transients signals in EB33 (Fig. 4b, see inset). Conversely during the pressurization stage in EB31 (Fig. 4c), one
observes a faster increase of the top pore pressure evolution compared to the bottom pore pressure. This is then accompanied by a 1-second period where the waveform amplitude fades out as
the pore pressure approaches equilibrium. Similar behaviour was observed across 10 experiments with the release of either liquid water or superheated water due to steam forming as a result
of the depressurization27. However, as reported in Fazio _et al_.27, the signals generated at elevated temperatures had duration in the order of tens of milliseconds in both scenarios,
almost 1000 times shorter than the events reported here (Fig. 3a). Previous studies14,20 found that a longer signal is expected when dusty gases are involved, followed by mixtures of ash and
SO2 and finally using mixtures of H2O and water droplets. In addition, by looking at the quality factor (Q) of LP events induced by the different fluid mixtures20,21, it is shown that
ash-gases mixture are responsible for the highest Q (followed by H2O and water droplets) while bubbly water accounts for the lowest Q. Therefore we assume that the duration of the signal
increases with decreasing liquid water content, in agreement with the results of this study and Fazio _et al_.27. Finally, we note that as the Nitrogen flows through the fractured rock, it
is likely that the finest comminuted material is incorporated in the flowing fluid, hence forming a dusty gas. Although the fluid type is important, it is clear that this is not sufficient
on its own to generate long-lasting signals (e.g. in EB35, Fig. 3c,d). The same applies for the highest compressibility of the gas phase, which is responsible for slower pore pressure decay
(tens of seconds), but not sufficient to cause sustained AE activity (Fig. 3). Instead, the key to understand the long signal recorded in EB31 (Fig. 3a,b) is the pore pressure difference.
Although a fully-quantitative comparison of the energy in these cases, compared to the field scenario, is beyond this paper, we have instead developed a semi-quantitative model to evaluate
the relative importance of the pore pressure difference (Δ_P_, measured between the top and bottom end of the sample) on the characteristic long-duration waveform. This is achieved by taking
the normalized AE signal envelope and the normalized Δ_P_ over the entire 20-s-long window (Fig. 5). These data show an excellent agreement with a correlation coefficient of 0.94. Each
spike in the normalized Δ_P_ curve was picked by the signal envelope, as well as maintaining the proportion between them. The same analysis has been applied on the shorter signal acquired
during the pressurization stage (Fig. 4d), also returning a correlation coefficient of 0.94. By using Newton’s second law of motion and pressure-gradient force equations (see Eq. 5) we then
link the acceleration of a moving fluid to Δ_P_ acting on the surface area of the fluid itself. Integrating the acceleration over time, we retrieve a proxy for fluid flow speed which is
directly proportional to Δ_P_. In this way, the AE sensors are essentially acting as flowmeters, recording the flow speed of the fluid as the gas is vented out of the sample, with the
decaying envelope of the signal mirroring the variation in fluid slow speed. Dinardo _et al_.28 came to a similar conclusion, finding linear relation between the flow rate of water pumped
into a pipe and the vibration of the pipe wall itself. The correlation between acoustic emission activity and flow rate is analogous to the relationship between the seismic eruption tremors
and the magma discharge rate found by Ichihara29 in sub-Plinian eruptions at Shinmoe-dake volcano, Japan. Although this relationship is not fully explained by current models, Ichihara29
postulates that the source of tremor cannot lie in the atmosphere but rather at the fragmentation level within the conduit. Therefore free gas, subject to a differential pressure, is likely
to be present in this scenario, similarly to our laboratory experiments. In particular, since our pressure conditions are equivalent to a depth of 1.4 km, close to the source of the deepest
tornillo recorded on Vulcano, we generate analogue pressure differences which, in turn, are known to cause vibrations of similar duration. This approach led us to develop the hypothesis that
the duration of a tornillo event does not depend on the size of the source, but it is rather a scale-invariant feature, which depends on the fluid flow rate. SCALE-DEPENDENT PROCESS
Analysing the frequency content of EB31 (Fig. 6a) (see methods), we observe that when sustained AE activity is generated two dominant frequency peaks (a narrow peak at 60 kHz and a broader
peak between 100 and 200 kHz) characterize the spectrum. This is similar to the case of the tornillo event at Vulcano (Fig. 6b) where two spectral peaks (with a broad higher frequency peak
and a narrower lower frequency peak) also characterize the spectrum. To understand the frequencies recorded at the laboratory scale, we model the source of the AE signal by taking into
account three distinct resonance mechanisms of the sample fractures where the fluids move: Helmholtz, tube and rectangular cavity (Fig. 7). The Helmholtz resonator has been widely used to
model the source of infrasonic and seismic signals recorded in volcanic environments30,31,32,33, as well as for tornillo events14,16. This source mechanism allows wavelengths to be generated
that much larger than the physical dimensions of the resonator used 31. A Helmholtz resonator, consisting of a rigid walled cavity with a neck, reverberates with a single frequency34:
$${f}_{H}=\frac{c}{2\pi }\sqrt{\frac{S}{Vk^{\prime} }}$$ (6) where: _c_ is the sound speed, _S_ is the area of the neck, _V_ is the cavity volume, and _k_′ is the neck effective length
calculated as _k_′ = _l_ + 1.45 * _r_ where _l_ is the neck length and _r_ is the neck radius (Fig. 7a). _V_ was estimated as the volume of the cylinder of height _L__H_ and radius _R__H_.
The sound velocity _c_ of nitrogen at ~300° K is approximately 354 m/s. To test if the Helmholtz resonator can be responsible for the peak frequencies observed in the laboratory tornillo (60
kHz peak and a broadband 100 and 200 kHz), we systematically changed _l_ and _r_ within the ranges 0.1 mm–100 mm (the length of the axial conduit, i.e. the cavity) and 0.1–1.5 mm (the
radius of the cavity), respectively. Both _L__H_ and _R__H_ were fixed to 100 − _l_ (i.e. _l_ + _L__H_ = 100 mm) and 1.5 mm respectively. We also assume that during the release of the
pressurized gas, the fluid flow along the 100-mm-long, 3-mm-wide axial conduit was impeded by rock particles as observed post-test due to the main fracture geometry27, forming the neck of
the Helmholtz resonator. Using these boundary conditions, it is evident that the Helmholtz resonance frequency is too low to explain the observed peak frequencies of the laboratory tornillo
(Fig. 8a). This model has been used to explain the resonator at Galeras responsible for the generation of tornillos, with two crucial caveats: (1) a steady and slow gas accumulation and (2)
a fluid pressure above a certain threshold14. However neither are applicable for our laboratory-analogue tornillo events. In fact gas pressure discharge (or accumulation for the
pressurization stage of EB31, Fig. 4c) was not steady but decelerating in all cases (Figs 3a,c and 4a,b), the same fluid pressure was present in EB31 and EB35 (Fig. 3a,c respectively) and
only in EB31 was a tornillo-like event generated. Therefore, in addition to the frequency analysis, the Helmholtz resonator cannot explain our longer-lasting AE signals. A tube or conduit,
considered as a 1D resonant source (Fig. 7b), has been used by several authors to model the generation mechanisms of volcano seismic and acoustic signals35,36,37,38,39. In the
conduit-resonator case, the resonating frequencies depend on the boundary conditions. In particular, a conduit with both open ends reverberates with frequencies:
$${f}_{T1}=\frac{nc}{2({L}_{C}+\delta L)}$$ (7) where _n_ is the mode index (_n_ = 1, 2, …), _L__c_ is the length of the conduit and _δL_ is the open end correction, approximately equal to
0.6 times the conduit radius _R__c_. Focusing on the fundamental mode, _n_ was fixed to unity. Considering the 100 mm-long, 3 mm-wide axial conduit as an open-open tube, this would resonate
at 1746 Hz, lower than the observed frequencies. However, if we assume that the conduit had a closed end (similarly to that assumed for the Helmholtz resonator), we calculate:
$${f}_{T0}=\frac{(2n+1)c}{4({L}_{C}+\delta L)}$$ (8) where _n_ is the mode index (_n_ = 0, 1, 2, …), which was fixed to 0 to represent the fundamental mode. _L__c_ and _R__c_ are set to the
ranges 0.1–100 mm and 0.1–1.5 mm, respectively. It is now evident that both frequency peaks measured in the experiment can be generated, assuming open-closed cylindrical cavities with
sub-millimetric dimensions (Fig. 8b). The last resonance mechanism option is the resonating rectangular cavity, or fluid-filled crack, commonly used to explain all types of LFS2, but also
tornillo specifically10,40 and infrasonic harmonic tremor31. The resonance frequencies within the cavity are defined here as31:
$${f}_{lmn}=\frac{c}{2}\sqrt{{(\frac{l}{{L}_{x}})}^{2}+{(\frac{m}{{L}_{y}})}^{2}+{(\frac{n}{{L}_{z}})}^{2}}$$ (9) where _l_, _m_, _n_ are the mode indices (_l_, _m_, _n_ = 0, 1, 2, …),
_L__x_, _L__y_, and _L__z_ are the dimensions of the rectangular cavity (Fig. 7c). The standing waves in a rectangular cavity can be divided into three categories41: (i) axial waves,
characterized by two mode indices equal to zero; (ii) tangential waves, characterized by a mode index equal to zero; (iii) oblique waves, characterized by all indices nonzero. The axial
modes have higher amplitude than the tangential modes, that are more energetic than the oblique modes31,41. Assuming _L__x_ = 3 * _L__y_42, we systematically changed _L__x_ (and consequently
_L__y_) in the range 0.1–100 mm and _L__z_ in the range 1–1.5 mm. The range in values of _L__z_ represents the damage zone maximum width, as confirmed via a thin section of the post-test
sample, considering the further aperture due to the pressurized gas. Focusing on the fundamental oblique mode _f_111, only the peak frequency at 150 kHz, as measured in the experiment, is
consistent with standing waves in a millimetric size cavity (Fig. 8c). While the frequency peak at 60 kHz can only be explained by the vibration of an open-closed conduit (or a segment of
it), both the rectangular cavity and the open-closed conduit can justify the frequency peak at 150 kHz. However, we rule out the rectangular cavity source model for the following reasons:
firstly, although we observed fracture aperture up to 1.5 mm, this happened for a very short portion of the fracture (1–2 mm), with the majority of the fracture showing aperture less than 1
mm; secondly, even considering the smallest possible aperture responsible for the 150 kHz frequency peak, the cavity should be 10 mm long. The observed fracture appeared highly irregular
over such length, therefore not being represented by a rectangular cavity. In addition a high amount of comminuted particles (with particles long up to 0.5 mm) were found within the
fracture. Instead, the axial conduit, which originally had smooth surfaces, contained fewer particles and maintained smooth surfaces even after the formation of the damage zone. Taking these
observations and results together, it is likely that the source of tornillo-like events in our experiments is not the vibration of the rectangular cavity representing the fracture zone but
instead multiple open-closed sections within the centrally pre-drilled conduit, which cannot be modelled as a Helmholtz resonator. Due to the protocol used, these open-closed sections of the
conduit were formed after the formation of damage zone, during the triaxial deformation phase. Although it appears that the shear fracture is not directly responsible in generating the
tornillo-like event, the deformation and the failure of the sample provided the material to choke the conduit (closed end) or to obstruct the flow of gas through it (open end). This occurred
during experiment EB31, allowing the build-up of pressure difference and in turn the generation of tornillo-like events. Conversely, during experiment EB35 the conduit was relatively free,
no significant pressure difference was observed, and no long-duration AE signal. The role of the fracture is also confirmed by previous data23, showing that the presence of the conduit alone
is not sufficient to generate long-lasting signals. These results explain the occurrence of tornillos with multiple spectral peaks, which are explained in terms of vibration of multiple
proximal open-closed conduits subject to a critical flow speed of a gas-rich phase. Our model of an open-closed conduit characterized by a critical flow rate of magmatic fluids is in partial
agreement with the observations at Galeras. Although we have identified a resonator mechanism different from the Helmholtz resonator and different pressurization rate, key roles in
generating tornillos are played by a choking conduit and a high magmatic pressure gradient, which in turn generates a critical flow rate. We may further speculate that the increased signal
duration, followed by a decrease just before eruption27 may indicate an increased flow rate due to a higher pressure gradient within the conduit, followed by the breech in the obstructed
conduit, leading to a temporary release of the internal pressure before the eruption commences. Therefore, our findings can be applied in understanding magmatic pressure gradients and flow
rate within open-closed conduit as tornillo events are observed and this information can be used to understand whether the eruption is explosive and the rate at which magmatic fluids are
ejected. As previously demonstrated3, flow speed is of critical importance in triggering a sustained seismic response, supported experimentally by our laboratory data: long-duration
microseismicity occurs only when the flow speed exceeds a critical threshold. In addition we proved here that a critical flow speed, theorized for laminar fluid3, is also required for
non-laminar fluid. CONCLUSIONS In this study, gas depressurization experiments, through a fractured sample, were performed in order to study the fluid-induced AE activity and to compare such
activity to analogue field volcano-seismic events. In the presence of a relatively high and lasting pore pressure gradient between the two ends of the sample, a sustained AE signal was
recorded, with a waveform similar to the tornillo events found in several volcano settings. The duration of the laboratory signal is similar to that of its volcanic analogue, with the AE
signal’s envelope mirroring the pore pressure difference behaviour, which in turn is proportional to the fluid flow speed. Considering that the laboratory experiments simulate realistic
pressure conditions, it can be assumed that field flow speed were successfully reproduced in the laboratory environment and that, therefore, this is a scale-invariant process. The frequency
contents of the AE signal and the tornillo events are scale-dependent. On the basis of the theoretical fundamental frequencies computed for three representative models, Helmholtz, tube and
rectangular cavity, and by assuming reasonable dimensions for the reverberating fractures, the only model we find that is capable of reproducing the measured AE signal peak frequencies is
that of the open-closed conduit model. This study provides new insight and understanding of the source of volcanic fluid-induced seismicity and has potential implications for volcano
monitoring. Frequency domain analysis of tornillo waveforms data provide new information relating the shape and dimensions of the resonating crack while time-domain analysis reveals the gas
pressure gradient within the volcanic edifice and the gas flow rate. These are parameters particularly important to characterize the volcanic gas budget, the deep seated volcanic plumbing
system and ultimately the type and style of possible volcanic eruption. Future works are stile required, particularly the use of calibrated AE sensors and accurate measurement of the fluid
flow, so as to better estimate the minimum gas volume discharged and how this links to the characteristics of recorded volcanic seismicity on the field. REFERENCES * McNutt, S. R. Seismic
Monitoring and Eruption Forecasting of Volcanoes: a Review of the State-of-the-Art and Case Histories. In _Monitoring and Mitigation of Volcano Hazards_ (Springer-Verlag Berlin, 1996).
Chapter Google Scholar * Chouet, B. Long-period volcano seismicity: its source and use in eruption forecasting. _Nature_ 380, 309–316 (1996). Article ADS CAS Google Scholar * Julian,
B. R. Volcanic tremor: Nonlinear excitation by fluid flow. _J. Geophys. Res. Solid Earth_ 99, 11859–11877 (1994). Article Google Scholar * Torres, R. A., Gomez, D. M. & Narvaez, M. L.
Unusual seismic signals associated with the activity at Galeras volcano, Colombia, from July 1992 to September 1994. _Ann. Geofis._ 39, 299–310 (1996). Google Scholar * Gómez, M., Diego,
M., Torres, C. & Roberto, A. Unusual low-frequency volcanic seismic events with slowly decaying coda waves observed at Galeras and other volcanoes. _J. Volcanol. Geotherm. Res._ 77,
173–193 (1997). Article ADS Google Scholar * Gomez, D. M., Torres, R. A., Seidl, D., Hellweg, M. & Rademacher, H. Tornillo seismic events at Galeras volcano, Colombia: a summary and
new information from broadband three-component measurements. _Ann. Geofis._ 42, 365–378 (1999). Google Scholar * Hamada, N., Jingu, H. & Ikumoto, K. On the volcanic earthquakes with
slowly decaying coda wave. _Bull Volconol Soc Jpn_ 21, 167–183 (1976). Google Scholar * Hagerty, M. & Benites, R. Tornillos beneath Tongariro Volcano, New Zealand. _J. Volcanol.
Geotherm. Res._ 125, 151–169 (2003). Article ADS CAS Google Scholar * De Angelis, S. Analyses of unusual long-period earthquakes with extended coda recorded at Katmai National Park,
Alaska, USA. _Geophys_. _Res_. _Lett_. 33 (2006). * Surono, Ph. L. Seismic precursors of the February 10, 1990 eruption of Kelut volcano, Java. _J. Volcanol. Geotherm. Res._ 65, 135–146
(1995). Article ADS Google Scholar * Hasanah, I., Syahbana, D. K., Santoso, A. & Palupi, I. R. Complex frequency analysis Tornillo earthquake Lokon Volcano in North Sulawesi period 1
January-17 March 2016. In 070001, https://doi.org/10.1063/1.4987089 (2017). * Milluzzo, V. _et al_. Tornillos at Vulcano: Clues to the dynamics of the hydrothermal system. _J. Volcanol.
Geotherm. Res._ 198, 377–393 (2010). Article ADS CAS Google Scholar * Bean, C. J. _et al_. Long-period seismicity in the shallow volcanic edifice formed from slow-rupture earthquakes.
_Nat. Geosci._ 7, 71–75 (2014). Article ADS CAS Google Scholar * Konstantinou, K. I. Tornillos modeled as self-oscillations of fluid filling a cavity: Application to the 1992–1993
activity at Galeras volcano, Colombia. _Phys. Earth Planet. Inter._ 238, 23–33 (2015). Article ADS CAS Google Scholar * Johnson, J. B. _et al_. Infrasound Tornillos Produced by Volcán
Cotopaxi’s Deep Crater. _Geophys. Res. Lett._ 45, 5436–5444 (2018). Article ADS Google Scholar * Seidl, D. & Hellweg, M. Parameterization of multichromatic tornillo signals observed
at Galeras Volcano (Colombia). _J. Volcanol. Geotherm. Res._ 125, 171–189 (2003). Article ADS CAS Google Scholar * Alparone, S. _et al_. Time-space variation of volcano-seismic events at
La Fossa (Vulcano, Aeolian Islands, Italy): new insights into seismic sources in a hydrothermal system. _Bull. Volcanol._ 72, 803–816 (2010). Article ADS Google Scholar * Chouet, B. A
seismic model for the source of long-period events and harmonic tremor. In _Volcanic seismology_ 133–156 (Springer, 1992). * Molina, I., Kumagai, H., García-Aristizábal, A., Nakano, M. &
Mothes, P. Source process of very-long-period events accompanying long-period signals at Cotopaxi Volcano, Ecuador. _J. Volcanol. Geotherm. Res._ 176, 119–133 (2008). Article ADS CAS
Google Scholar * Kumagai, H. & Chouet, B. A. Acoustic properties of a crack containing magmatic or hydrothermal fluids. _J. Geophys. Res._ 105, 25493–25512 (2000). Article ADS CAS
Google Scholar * Kumagai, H. & Chouet, B. A. The dependence of acoustic properties of a crack on the resonance mode and geometry. _Geophys. Res. Lett._ 28, 3325–3328 (2001). Article
ADS Google Scholar * Hellweg, M. Physical models for the source of Lascar’s harmonic tremor. _J. Volcanol. Geotherm. Res._ 101, 183–198 (2000). Article ADS CAS Google Scholar * Fazio,
M. Dynamic laboratory simulations of fluid-rock coupling with application to volcano seismicity and unrest. (University of Portsmouth, 2017). * Sammonds, P. R. Understanding the fundamental
physics governing the evolution and dynamics of the Earth’s crust and ice sheets. _Phil Trans R Soc Lond_ 357, 3377–3401 (1999). Article MathSciNet Google Scholar * Burlini, L. _et al_.
Seismicity preceding volcanic eruptions: New experimental insights. _Geology_ 35, 183 (2007). Article ADS Google Scholar * Benson, P. M., Vinciguerra, S., Meredith, P. G. & Young, R.
P. Laboratory Simulation of Volcano Seismicity. _Science_ 322, 249–252 (2008). Article ADS CAS Google Scholar * Fazio, M., Benson, P. M. & Vinciguerra, S. On the generation
mechanisms of fluid-driven seismic signals related to volcano-tectonics: Experiments on Fluid-Induced Seismicity. _Geophys. Res. Lett._ 44, 734–742 (2017). Article ADS Google Scholar *
Dinardo, G., Fabbiano, L. & Vacca, G. Fluid flow rate estimation using acceleration sensors. In _2013 Seventh International Conference on Sensing Technology (ICST)_ 221–225 (IEEE),
https://doi.org/10.1109/ICSensT.2013.6727646 (2013). * Ichihara, M. Seismic and infrasonic eruption tremors and their relation to magma discharge rate: A case study for sub-Plinian events in
the 2011 eruption of Shinmoe-dake, Japan. _J. Geophys. Res. Solid Earth_ 121, 7101–7118 (2016). Article ADS Google Scholar * Vergniolle, S. & Caplan-Auerbach, J. Acoustic
measurements of the 1999 basaltic eruption of Shishaldin volcano, Alaska: 2. Precursor to the Subplinian phase. _J. Volcanol. Geotherm. Res._ 137, 135–151 (2004). ADS CAS Google Scholar *
Fee, D. _et al_. Infrasonic harmonic tremor and degassing bursts from Halema’uma’u Crater, Kilauea Volcano, Hawaii. _J_. _Geophys_. _Res_. 115 (2010). * Goto, A. & Johnson, J. B.
Monotonic infrasound and Helmholtz resonance at Volcan Villarrica (Chile). _Geophys_. _Res_. _Lett_. 38 (2011). * Sciotto, M., Cannata, A., Gresta, S., Privitera, E. & Spina, L. Seismic
and infrasound signals at Mt. Etna: Modeling the North-East crater conduit and its relation with the 2008–2009 eruption feeding system. _J. Volcanol. Geotherm. Res._ 254, 53–68 (2013).
Article ADS CAS Google Scholar * Kinsler, L. E., Frey, A. R., Coppens, A. B. & Sanders, J. V. Fundamentals of Acoustics, Third EditionJohn Wiley & Sons. _Inc NewYork_ (1982). *
Garcés, M. A. & McNutt, S. R. Theory of the airbone sound field generated in a resonant magma conduit. _J. Volcanol. Geotherm. Res._ 78, 155–178 (1997). Article ADS Google Scholar *
De Angelis, S. & McNutt, S. R. Observations of volcanic tremor during the January–February 2005 eruption of Mt. Veniaminof, Alaska. _Bull. Volcanol._ 69, 927–940 (2007). Article ADS
Google Scholar * Cannata, A. _et al_. Long period and very long period events at Mt. Etna volcano: Characteristics, variability and causality, and implications for their sources. _J.
Volcanol. Geotherm. Res._ 187, 227–249 (2009). Article ADS CAS Google Scholar * Kobayashi, T., Namiki, A. & Sumita, I. Excitation of airwaves caused by bubble bursting in a
cylindrical conduit: Experiments and a model. _J_. _Geophys_. _Res_. 115 (2010). * Spina, L. _et al_. Insights into Mt. Etna’s Shallow Plumbing System from the Analysis of Infrasound
Signals, August 2007–December 2009. _Pure Appl. Geophys._ 172, 473–490 (2015). Article ADS Google Scholar * Kumagai, H., Chouet, B. A. & Nakano, M. Waveform inversion of oscillatory
signatures in long-period events beneath volcanoes. _J_. _Geophys_. _Res_. _Solid Earth_ 107, ESE 7-1-ESE 7–13 (2002). * Morse, P. M. & Ingard, K. U. Theoretical Acoustics (Princeton U.
P., Princeton, N. J.). _Google Sch_. 175–191 (1968). * Doglioni, C., Carminati, E., Petricca, P. & Riguzzi, F. Normal fault earthquakes or graviquakes. _Sci_. _Rep_. 5 (2015). Download
references ACKNOWLEDGEMENTS The authors acknowledge Emily Butcher and Stephan Gehne for technical support in the Rock Mechanics Laboratory, and Dr. Peter Rowley (UoP) for thoughtful
discussions. The data used are listed in the references, figure and supplements. This research was funded by a University Graduate Bursary grant to MF during his PhD project. The
experimental data presented are part of Fazio’s PhD thesis42, here discussed more thoroughly and provided with source mechanism modelling. We acknowledge support by the German Research
Foundation and the Open Access Publication Funds of the Göttingen University. AUTHOR INFORMATION Author notes * Andrea Cannata Present address: Dipartimento di Scienze Biologiche, Geologiche
e Ambientali – Sezione di Scienze della Terra, Universita’ degli Studi di Catania, 95129, Catania, Italy AUTHORS AND AFFILIATIONS * Rock Mechanics Laboratory, University of Portsmouth,
Portsmouth, PO1 3QL, UK Marco Fazio & Philip M. Benson * Department of Applied Geology, University of Göttingen, Göttingen, 37077, Germany Marco Fazio * Istituto Nazionale di Geofisica e
Vulcanologia, Osservatorio Etneo - Sezione di Catania, 95125, Catania, Italy Salvatore Alparone & Andrea Cannata * Department of Physics and Geology, University of Perugia, Perugia,
06123, Italy Andrea Cannata * Department of Earth Sciences, University of Turin, Turin, 10125, Italy Sergio Vinciguerra Authors * Marco Fazio View author publications You can also search for
this author inPubMed Google Scholar * Salvatore Alparone View author publications You can also search for this author inPubMed Google Scholar * Philip M. Benson View author publications You
can also search for this author inPubMed Google Scholar * Andrea Cannata View author publications You can also search for this author inPubMed Google Scholar * Sergio Vinciguerra View
author publications You can also search for this author inPubMed Google Scholar CONTRIBUTIONS M.F. performed the experiments, analysed the data, wrote the manuscript and, together with S.A.,
who also provided field data, initiated the concepts. P.B. and S.V. helped develop the concepts. A.C. carried out the source mechanism modelling and together with S.A., P.B. and S.V.
provided intellectual input. CORRESPONDING AUTHOR Correspondence to Marco Fazio. ETHICS DECLARATIONS COMPETING INTERESTS The authors declare no competing interests. ADDITIONAL INFORMATION
PUBLISHER’S NOTE: Springer Nature remains neutral with regard to jurisdictional claims in published maps and institutional affiliations. RIGHTS AND PERMISSIONS OPEN ACCESS This article is
licensed under a Creative Commons Attribution 4.0 International License, which permits use, sharing, adaptation, distribution and reproduction in any medium or format, as long as you give
appropriate credit to the original author(s) and the source, provide a link to the Creative Commons license, and indicate if changes were made. The images or other third party material in
this article are included in the article’s Creative Commons license, unless indicated otherwise in a credit line to the material. If material is not included in the article’s Creative
Commons license and your intended use is not permitted by statutory regulation or exceeds the permitted use, you will need to obtain permission directly from the copyright holder. To view a
copy of this license, visit http://creativecommons.org/licenses/by/4.0/. Reprints and permissions ABOUT THIS ARTICLE CITE THIS ARTICLE Fazio, M., Alparone, S., Benson, P.M. _et al._ Genesis
and mechanisms controlling tornillo seismo-volcanic events in volcanic areas. _Sci Rep_ 9, 7338 (2019). https://doi.org/10.1038/s41598-019-43842-y Download citation * Received: 05 October
2018 * Accepted: 29 April 2019 * Published: 14 May 2019 * DOI: https://doi.org/10.1038/s41598-019-43842-y SHARE THIS ARTICLE Anyone you share the following link with will be able to read
this content: Get shareable link Sorry, a shareable link is not currently available for this article. Copy to clipboard Provided by the Springer Nature SharedIt content-sharing initiative