- Select a language for the TTS:
- UK English Female
- UK English Male
- US English Female
- US English Male
- Australian Female
- Australian Male
- Language selected: (auto detect) - EN
Play all audios:
ABSTRACT Patients affected by retinitis pigmentosa, an inherited retinal disease, experience a decline in vision due to photoreceptor degeneration leading to irreversible blindness.
Rod-derived cone viability factor (RdCVF) is the most promising mutation-independent treatment today. To identify pathologic processes leading to secondary cone photoreceptor dysfunction
triggering central vision loss of these patients, we model the stimulation by RdCVF of glucose uptake in cones and glucose metabolism by aerobic glycolysis. We develop a nonlinear system of
enzymatic functions and differential equations to mathematically model molecular and cellular interactions in a cone. We use uncertainty and sensitivity analysis to identify processes that
have the largest effect on the system and their timeframes. We consider the case of a healthy cone, a cone with low levels of glucose, and a cone with low and no RdCVF. The three key
processes identified are metabolism of fructose-1,6-bisphosphate, production of glycerol-3-phosphate and competition that rods exert on cone resources. The first two processes are
proportional to the partition of the carbon flux between glycolysis and the pentose phosphate pathway or the Kennedy pathway, respectively. The last process is the rods’ competition for
glucose, which may explain why rods also provide the RdCVF signal to compensate. SIMILAR CONTENT BEING VIEWED BY OTHERS A MATHEMATICAL MODEL OF GLUT1 MODULATION IN RODS AND RPE AND ITS
DIFFERENTIAL IMPACT IN CELL METABOLISM Article Open access 23 June 2022 SELECTIVE KNOCKDOWN OF HEXOKINASE 2 IN RODS LEADS TO AGE-RELATED PHOTORECEPTOR DEGENERATION AND RETINAL METABOLIC
REMODELING Article Open access 20 October 2020 PHOTOTOXIC DAMAGE TO CONE PHOTORECEPTORS CAN BE INDEPENDENT OF THE VISUAL PIGMENT: THE PORPHYRIN HYPOTHESIS Article Open access 29 August 2020
INTRODUCTION Rods and cones are photoreceptor cells located in the retina, which play a central role in the vision process. Light photons are detected by the photoreceptors and processed
into electrical signals in the retina. In mammals, rods are much more numerous than cones existing at a ratio of about 20 rods per cone. The rods are responsible for night vision while the
cones are responsible for color vision and visual acuity. The photoreceptors are the most metabolically demanding cells in the body and are in constant need of nutrients, glucose, lipids,
and metabolites for maintenance1. As part of that maintenance, the photoreceptors undergo renewal and periodic shedding of their outer segment (OS) discs to prevent the toxic effects of
accumulated photo-oxidative products. Following shedding, photoreceptors regenerate about the same amount of cellular material each day maintaining a relatively constant length of their
outer segments2,3. When photoreceptor degeneration occurs, rod and cone OS begin to shorten as a result of disruptions in the renewal and underlying metabolic processes. These disruptions,
if magnified, can lead to eventual death of the photoreceptors. In the mature human retina (by about age 5 or 6), there are no spontaneous births of photoreceptors. Thus, when a
photoreceptor dies, there is no new photoreceptor created. As photoreceptor death continues due to degeneration, loss of vision progresses resulting in blindness. Apart from anti vascular
endothelial growth factor (anti-VEGF) medications that can limit progression of choroidal neovascularisation, a clinical form of age-related macular degeneration, there are no cures for
diseases, such as retinitis pigmentosa (RP), that are linked to photoreceptor degeneration4. Typically, RP is characterized by the death of rods due to some genetic mutation followed by the
death of cones. The peculiarity is that the cones die after the rods even if the cones are genetically healthy. Understanding what caused the secondary wave of cone death following rod
degeneration in RP was for many years the driving force behind numerous studies. In 2004, Léveillard _et al_. identified and characterized a protein they coined the rod-derived cone
viability factor (RdCVF). Their experiments showed that RdCVF significantly preserves cone function and vitality. A 40% rescue effect in the presence of RdCVF was observed experimentally and
confirmed _in silico_5,6. Understanding the mechanisms by which RdCVF preserves cones’ function is essential because maintaining functional cones even when 95% are gone may prevent
blindness7,8. We know that RdCVF promotes cone survival by stimulating aerobic glycolysis in cones. The process of aerobic glycolysis allows for energy production and phospholipid synthesis,
which is needed for the renewal of cone OS9,10. Basigin-1 (BSG1) forms a complex, GLUT1/BSG1, with glucose transporter 1 (GLUT1, SLC2A1). RdCVF triggers aerobic glycolysis by binding to the
GLUT1/BSG1 complex and accelerates the entry of glucose into the cell. Using a model of aerobic glycolysis in a single cone cell embedded in a cell population, we investigate the
interrelated and feedback dynamics from the molecular to the population level and vice versa. The population component describes the dynamics at the cellular level, and it has been
extensively developed and analyzed11,12,13. We model explicitly the mode of action of RdCVF and glucose uptake with the goal of understanding the key mechanisms that drive cone OS renewal in
a healthy retina so that these conclusions may guide experimental work and identify key processes. The purpose of this study is to mathematically analyze the molecular and cellular level
interactions that occur in a non-diseased retina with the goal of gaining insight into an understanding of photoreceptor vitality so that our findings may contribute to the development of
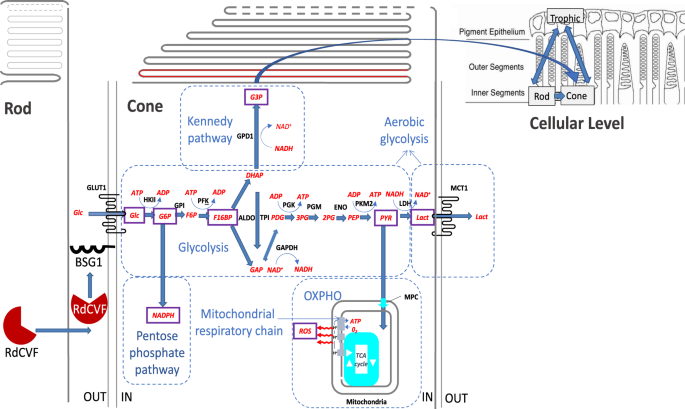
therapies that can stop cone photoreceptor degeneration. RESULTS MODELING REACTION RATES In our mathematical model, represented by a set of nonlinear ordinary differential equations (ODEs)
in section 4.1, we focus on the critical metabolic steps triggered by the uptake of glucose into the cones. We model three phases of glucose catabolism and their interplay in order to better
illustrate the mediated survival exerted by the rods on the cones. The three metabolic phases include aerobic glycolysis, oxidative phosphorylation (OXPHO), and the pentose phosphate
pathway (PPP); see Fig. 1. The term aerobic glycolysis means that glucose produces lactate even in the presence of oxygen. Cone photoreceptors will not survive without mitochondria and
oxygen. There is a partitioning in the cone photoreceptors between glucose going through aerobic glycolysis for cone OS renewal and glucose going through OXPHO, the main adenosine
triphosphate (ATP) production step. RdCVF stimulates glucose going through aerobic glycolysis, while reactive oxygen species (ROS) favors glucose leading to the production of carbon dioxide
(CO2) and the reduced form of nicotinamide adenine dinucleotide phosphate (NADPH), CO2 + NADPH, through the PPP and inhibits both glucose flowing through aerobic glycolysis and OXPHO. In the
case of too much ROS, the requirement for more NADPH to cope with the stress results in the oxidation of all 6 carbon atoms of glucose into 6 CO2 molecules through the PPP. In healthy
conditions, ROS is a function of glucose metabolized through OXPHO and the percent of leakage of the mitochondrial respiratory chain. Our model does not include a complete mathematical
representation of OXPHO and the PPP. Currently, certain processes in these metabolic phases are not completely known; therefore, there is no way to obtain certain measurements necessary to
validate a model consisting of a complete representation of all the reactions of these phases. Thus in considering the PPP and OXPHO, we focus on the mechanisms affecting ROS inhibition or
production which are key to cones’ vitality and for which we have a better handle on particular quantities. We incorporate the dominant divergence of pyruvate into this pathway, and a means
to create ROS through the leakage in the mitochondrial respiratory chain14. We also illustrate the detoxification of ROS that results from the production of NADPH through the PPP by
including an equation for the reaction rate of NADPH production15. Glucagon is not included in our model. This peptide hormone produced by pancreatic cells raises the concentration of
glucose in the bloodstream. The expression of the glucagon-like peptide-1 receptor (GLP1R) is downregulated in the retinal pigment epithelium (RPE) in a model of chemically induced diabetic
retinopathy16. Since this phenomenon is taking place at the opposite side of the outer blood retinal barrier, the basal side of the RPE, we do not include glucagon as an inhibitor of
glycolysis. Additionally, we were unable to find data showing that cone photoreceptors express GLP1R. We model aerobic glycolysis starting with the binding of RdCVF to the BSG1/GLUT1 complex
and ending with production of lactate (LACT). The carbon flux is diverted from aerobic glycolysis at some specific point in the reaction and the 6 carbons of glucose are not entirely
metabolized into 2 molecules of lactate (3 carbons) so that an unknown proportion of carbon is transferred from glucose to phospholipids to form the cone OS. In our mathematical model, we
will take this into account in the amount of glucose the cones uptake to produce new cone OS. We let [_δR__n_] represent the free unbound RdCVF concentration which eventually binds to the
BSG1/GLUT1 complex to activate GLUT1 and initiate the biochemical cascade leading to the production of LACT as well as the production of ROS through OXPHO. Our mathematical model consists of
a system of nonlinear ODEs that describes the molecular and cellular level photoreceptor interactions. Below, we first consider the reaction rate equations for for eight biochemical
molecules (see Fig. 1), and then use those equations to construct the molecular level ODEs; see Section 2.2. Considering _δR__n_ to be the substrate, _g_ the glucose inside the cell, and _G_
the glucose outside the cell, in the chemical transformation of active GLUT1, we have the chemical reactions $$[\delta {{\rm{R}}}_{{\rm{n}}}]+[{\rm{BSG}}1/\mathrm{GLUT}1]\leftrightharpoons
[\delta {{\rm{R}}}_{{\rm{n}}}/\mathrm{BSG}1/\mathrm{GLUT}1]$$ $${\rm{and}}$$ $$[{\rm{G}}]+[\delta {{\rm{R}}}_{{\rm{n}}}/\mathrm{BSG}1/\mathrm{GLUT}1]\to [{\rm{g}}]+[\delta
{{\rm{R}}}_{{\rm{n}}}/\mathrm{BSG}1/\mathrm{GLUT}1].$$ When the 3-protein complex _δR__n_/BSG1/GLUT1 is formed, an allosteric regulation leads to the activation of GLUT1, a facilitated
transporter15. The only backward reaction is the dissociation of RdCVF and BSG1/GLUT1. The reaction then goes only forward. In this allosteric regulation, RdCVF stimulates the transport
activity of GLUT1 by triggering its tetramerization which relies on a reversible redox-dependent interconversion. Accessible cysteine residues in GLUT1 would be oxidized by the extracellular
and oxidized form of RdCVF (RdCVFox) that would act as a prooxidant. Oxidized thioredoxins are prooxidant as is the protein disulfide isomerase, another thioredoxin enzyme that catalyzes
the formation of disulfide bridges (oxidation of two cysteines) in proteins transiting through the endoplasmic reticulum13,17,18. GLUT1 accelerates the rate of glucose intake by cones. It
does not require energy for transporting glucose and the rate of transport is a function of the gradient of the concentration of glucose outside the cell, [_G_], versus the concentration of
glucose inside the cell, [g] and the limiting value of the transport rate of glucose, represented by \({V}_{{{\rm{\max }}}_{[{\rm{g}}]}}\). Given this, at a certain glucose concentration in
the retina (interphotoreceptor space), the amount of glucose transport depends on the rate of metabolism of glucose by the respective photoreceptors. The cell viability, which depends on
glucose uptake and metabolism through aerobic glycolysis, is stimulated by RdCVF10. We model the effects of these chemical reactions that accelerate the rate of glucose intake by cones as
$${\nu }_{[{\rm{g}}]}=\lambda ([G]-[{\rm{g}}])\,(\frac{{V}_{{{\rm{\max }}}_{[{\rm{g}}]}}{(\delta {R}_{n})}^{2}}{{K}_{{m}_{[{\rm{g}}]}}^{2}+{(\delta {R}_{n})}^{2}}+p)$$ where [_G_], which is
between 3.3 to 7 mM, represents the total glucose concentration outside the cell, [g] is the glucose concentration inside the cell, \({V}_{{{\rm{\max }}}_{[{\rm{g}}]}}\) is the limiting
value (i.e., the saturation value) of the transport rate of glucose, _λ_ is a conversion factor, and _p_ is the glucose uptake of cones in the absence of RdCVF. The parameter
\({K}_{{m}_{[{\rm{g}}]}}\) is equal to the substrate concentration that gives half the limiting value of the transport rate of glucose, \({V}_{{{\rm{\max }}}_{[{\rm{g}}]}}\). Experimental
work of 10 indicated that \(\frac{{V}_{{{\rm{\max }}}_{[{\rm{g}}]}}{(\delta {R}_{n})}^{2}}{{K}_{{m}_{[{\rm{g}}]}}^{2}+{(\delta {R}_{n})}^{2}}\gg p\) where \(\frac{{V}_{{{\rm{\max
}}}_{[{\rm{g}}]}}{(\delta {R}_{n})}^{2}}{{K}_{{m}_{[{\rm{g}}]}}^{2}+{(\delta {R}_{n})}^{2}}\) represents the glucose uptake in the presence of RdCVF. When there is an allosteric regulation
in the production [i], there is a binding time requirement for the enzyme to catalyze the formation of the product. In this case, the plot of each \({\nu }_{[i]}\) vs. [_i_] would be
sigmoidal. To model this mathematically, we use a Holling’s type III functional response equation instead of the Holling’s type II functional response which is used in the formulation of the
Michaelis-Menten equation. The next committed step we model is the production of glucose-6-phosphate (G6P), where _g_ is the substrate and hexokinase 2 (HKII) is the enzyme in the reaction,
$$[{\rm{g}}]+[{\rm{HKII}}]\leftrightharpoons [g/\mathrm{HKII}]\to [{\rm{G}}6{\rm{P}}]+[{\rm{HKII}}].$$ The irreversible step in this reaction is the formation of G6P: the conversion of
glucose to G6P catalyzed by the enzyme hexokinase 2 requires ATP as a high-energy phosphoryl donor. Phosphorylation of the primary hydroxyl group at C-6 yields a negatively charged
derivative whose phosphate group will be used to generate ATP from adenosine diphosphate (ADP) later in the pathway19. Phosphorylation also prevents glucose from escaping from the cell
cytosol. The reaction rate of G6P is governed by $${\nu }_{[{\rm{G}}6{\rm{P}}]}=\frac{{V}_{{{\rm{\max
}}}_{[{\rm{G}}6{\rm{P}}]}}{[{\rm{g}}]}^{2}}{{K}_{{m}_{[{\rm{G}}6{\rm{P}}]}}^{2}+{[{\rm{g}}]}^{2}},$$ where [G6P] is the concentration of G6P, \({V}_{{{\rm{\max }}}_{[\mathrm{G6P}]}}\) is the
limiting value of the reaction rate of G6P, and \({K}_{{m}_{[{\rm{G6P}}]}}\) is the substrate concentration that gives half the maximal rate. We will assume the intermediate step between
G6P and fructose-6-phosphate (F6P) takes place. This assumption allows us to move on and model the production of fructose-1,6-bisphosphate (F16BP), the next committed step of glycolysis. We
let G6P be the substrate and phosphofructokinase (PFK) be the enzyme in the reaction rate of F16BP such that $$[{\rm{G}}6{\rm{P}}]+[{\rm{PFK}}]\leftrightharpoons [{\rm{G}}6P/\mathrm{PFK}]\to
[{\rm{F}}16{\rm{BP}}]+[{\rm{PFK}}].$$ This chemical reaction is governed by $${\nu }_{[{\rm{F}}16{\rm{BP}}]}=(\frac{{V}_{{{\rm{\max
}}}_{[{\rm{F}}16\mathrm{BP}]}}{[{\rm{G}}6{\rm{P}}]}^{2}}{{K}_{{m}_{[{\rm{F}}16{\rm{BP}}]}}^{2}+{[{\rm{G}}6{\rm{P}}]}^{2}})\,{{\rm{\Omega }}}_{[\mathrm{PYR}]},$$ (1) where $${{\rm{\Omega
}}}_{[{\rm{PYR}}]}=\frac{{[{\rm{PEP}}]}_{eq}^{4}}{{[{\rm{PEP}}]}_{eq}^{4}+{[{\rm{PYR}}]}^{4}},$$ \({V}_{{{\rm{\max }}}_{[{\rm{F}}16{\rm{BP}}]}}\) is the limiting value of the reaction rate
of F16BP, \({K}_{{m}_{[{\rm{F}}16{\rm{BP}}]}}\) is the substrate concentration that gives half the maximal rate, \([\mathrm{F16BP}]\) is the concentration of F16BP, \([{\rm{PYR}}]\)
represents pyruvate (PYR) concentration, and \({[{\rm{PEP}}]}_{eq}\) is the switch that redirects glucose either to the PPP or down the aerobic glycolysis pathway to produce lactate. Since
we are not modeling all intermediate chemical reactions involved in aerobic glycolysis, we take \({[{\rm{PEP}}]}_{eq}\) in relation to \([{\rm{PYR}}]\) as a proxy for accumulation of
phosphoenol pyruvate (PEP) due to oxidation of cysteine (358), a residue on pyruvate kinase. Therefore, we have \({[{\rm{PEP}}]}_{eq}\) explicit in equation (1). For \([{\rm{PYR}}]\) levels
below \({[{\rm{PEP}}]}_{eq}\), G6P leads to an increase in PYR and the production of lactate through various biochemical steps in glycolysis. When \([{\rm{PYR}}] < {[{\rm{PEP}}]}_{eq}\),
G6P encourages the production of F16BP. This process is illustrated by \({{\rm{\Omega }}}_{[{\rm{PYR}}]}\) in equation (1). When \([{\rm{PYR}}] > {[{\rm{PEP}}]}_{eq}\) the production of
F16BP is inhibited and G6P diverts glucose into the PPP. The inclusion of \({[{\rm{PEP}}]}_{eq}\) redirects glucose into the PPP as illustrated with \({{\rm{\Phi }}}_{[{\rm{PYR}}]}\) in
equation (2) below. Thus, in our mathematical model \([{\rm{PYR}}]\) together with \({[{\rm{PEP}}]}_{eq}\) serve a dual role regulating PYR production: acting as a proxy of glycolysis rate
and the initiation of PPP. Glucose metabolism through the PPP reduces nicotinamide adenine dinucleotide phosphate (NADP+) to NADPH. A first molecule of NADPH results from the action of the
glucose-6-phosphate dehydrogenase by reducing one molecule of NADP+. A second molecule of NADPH results from the action of the 6-phosphogluconate dehydrogenase by reducing a second molecule
of NADP+. The resulting 2 moles of NADPH allow for the detoxification of ROS and repair of oxidative damage in cones15. We incorporate the production of NADPH into our model by the following
equation, $${\nu }_{[{\rm{NADPH}}]}=(\frac{2{V}_{{{\rm{\max }}}_{[{\rm{NADPH}}]}}{[{\rm{G6P}}]}^{2}}{{K}_{{m}_{[{\rm{NADPH}}]}}^{2}+{[{\rm{G}}6{\rm{P}}]}^{2}})\,{{\rm{\Phi
}}}_{[{\rm{PYR}}]}$$ (2) where $${{\rm{\Phi }}}_{[{\rm{PYR}}]}=\frac{{[{\rm{PYR}}]}^{4}}{{[{\rm{PEP}}]}_{eq}^{4}+{[{\rm{PYR}}]}^{4}},$$ \({V}_{{{\rm{\max }}}_{[{\rm{NADPH}}]}}\) is the
limiting value of the reaction rate of NADPH, \([{\rm{NADPH}}]\) is the concentration of NADPH, and \({K}_{{m}_{[{\rm{NADPH}}]}}\) is the substrate concentration that gives half the maximal
rate. The parameter \({[{\rm{PEP}}]}_{eq}\) is the critical level of pyruvate necessary to initiate the PPP. The graphs of \({{\rm{\Omega }}}_{[{\rm{PYR}}]}\) and \({{\rm{\Phi
}}}_{[{\rm{PYR}}]}\) are shown in Fig. 2 below. Branching from aerobic glycolysis, dihydroxyacetone phosphate (DHAP) is providing triglycerides via glycerol-3-phosphate (G3P), the precursors
of phospholipids that are necessary for OS renewal. A portion of F16BP, _q_, is converted from DHAP to G3P and the remaining portion of F16BP, \((1\,-\,q)\), is converted from DHAP back to
glyceraldehyde-3-phosphate (GAP). Aldolase splits one 6-carbon molecule of F16BP into two 3-carbon molecules: GAP and DHAP. GAP is entirely converted into lactate and CO2 by aerobic
glycolysis and OXPHO, while a portion of DHAP is used for G3P and consequently cone OS renewal. Thus, _q_ is proportional to the activity of _V_max and _K__m_ of triose phosphate isomerase
(TPI). It is also the case that TPI activity is inhibited by PEP20 which accumulates in the presence of ROS. Thus for the production of G3P, we take F16BP as a substrate, and cytoplasmic
glycerol-3P-dehydrogenase (GPD1) as the enzyme in the production of G3P, such that $$[{\rm{F}}16{\rm{BP}}]+[{\rm{GPD}}1]\leftrightharpoons [{\rm{F}}16\mathrm{BP}/\mathrm{GPD}1]\to
[{\rm{G}}3{\rm{P}}]+[{\rm{GPD}}1].$$ The reaction rate of G3P in the model is governed by $${\nu }_{[{\rm{G}}3{\rm{P}}]}=\frac{q{V}_{{{\rm{\max
}}}_{[{\rm{G}}3{\rm{P}}]}}{[{\rm{F}}16{\rm{BP}}]}^{2}}{{K}_{{m}_{[{\rm{G3P}}]}}^{2}+{[{\rm{F16BP}}]}^{2}}.$$ where \({V}_{{{\rm{\max }}}_{[{\rm{G}}3{\rm{P}}]}}\) is the limiting value of the
reaction rate of G3P, \({K}_{{m}_{[{\rm{G3P}}]}}\) is the substrate concentration that gives half the maximal rate, \([{\rm{G}}3{\rm{P}}]\) is the concentration of G3P, and _q_ is the
portion of F16BP that is used in the production of G3P. Down the lactate producing pathway in glycolysis, we move from modeling the reaction resulting in F16BP to the next committed step,
the production of pyruvate. To simplify things, we take F16BP as a substrate and pyruvate kinase denoted by PK as the enzyme in the production of pyruvate, PYR, such that
$$[{\rm{F}}16{\rm{BP}}]+[{\rm{PK}}]\leftrightharpoons [{\rm{F}}16\mathrm{BP}/\mathrm{PK}]\to [{\rm{PYR}}]+[{\rm{PK}}].$$ The reaction rate of pyruvate in the model is governed by $${\nu
}_{[{\rm{PYR}}]}=\frac{(1-q)\,{V}_{{{\rm{\max }}}_{[{\rm{PYR}}]}}{[{\rm{F}}16{\rm{BP}}]}^{2}}{{K}_{{m}_{[{\rm{PYR}}]}}^{2}+{[{\rm{F}}16{\rm{BP}}]}^{2}}$$ where \({V}_{{{\rm{\max
}}}_{[{\rm{PYR}}]}}\) is the limiting value of the reaction rate of PYR, \({K}_{{m}_{[{\rm{PYR}}]}}\) is the substrate concentration that gives half the maximal rate, and \((1\,-\,q)\) is
the portion of F16BP that eventually leads to the production of PYR. Finally the last step of aerobic glycolysis is the production of lactate, LACT, where lactate dehydrogenase (LDH) is the
enzyme and PYR the substrate21: $$[{\rm{PYR}}]+[{\rm{LDH}}]\leftrightharpoons [\mathrm{PYR}/\mathrm{LDH}]\leftrightharpoons [{\rm{LACT}}]+[{\rm{LDH}}].$$ The reaction rate of lactate is
governed by $${\nu }_{[{\rm{LACT}}]}=\frac{(1-\rho )\,{V}_{{{\rm{\max }}}_{[\mathrm{LACT}]}}[{\rm{PYR}}]}{{K}_{{m}_{[{\rm{LACT}}]}}+[{\rm{PYR}}]}.$$ where \([{\rm{LACT}}]\) is the
concentration of lactate, \(\rho \) is the percent of ROS produced by leakage of the mitochondrial respiratory chain, \({V}_{{{\rm{\max }}}_{[{\rm{LACT}}]}}\) is the limiting value of the
reaction rate of LACT, and \({K}_{{m}_{[{\rm{LACT}}]}}\) is the substrate concentration that gives half the maximal rate. During aerobic glycolysis, the 6-carbon atoms of glucose are not
transformed entirely into lactate. Some are diverted to DHAP to produce triglycerides that are finally incorporated into phospholipids of the cone OS. There is no oxidative stress resulting
from the production of lactate. Lactate dehydrogenase produces lactate from pyruvate by transferring the electron from the reduced form of nicotinamide adenine dinucleotide (NADH) to the
oxidized form of nicotinamide adenine dinucleotide (NAD+) which is reused upstream in the glycolysis pathway. The conversion of pyruvate to lactate is reversible and the direction of the
reaction depends on lactate dehydrogenase subtypes. Photoreceptors express the subtype A which favors the production of lactate from pyruvate and the RPE expresses the subtype B which favors
the production of pyruvate from lactate22. This is necessary for the astrocyte neuronal lactate shuttle (ANLS). Nevertheless, lactate does not protect cone photoreceptors _in vitro_10 and
retinal ANLS is debated23. In the healthy retina, ROS are produced from glucose through glycolysis and mitochondrial OXPHO as well as from photo-oxidation9. In a rod-less retina, the cones
are under hyperoxia due to the fact that choroid circulation is not regulated by the reduction of photoreceptors15,24. There is a partitioning in the cone between glucose going through
aerobic glycolysis (for cone OS renewal) and glucose going through oxidative phosphorylation (main ATP production step). RdCVF stimulates glucose through aerobic glycolysis, while ROS favors
glucose via CO2 + NADPH and inhibits both glucose via aerobic glycolysis and glucose through oxidative phosphorylation. In the PPP, we mathematically consider the production of NADPH
described in equation (2), and the inhibition of ROS, illustrated by the second term in the \(\frac{d[{\rm{ROS}}]}{dt}\) equation in Section 2.2 below. ROS are inhibited by rod-derived cone
viability factor long (RdCVFL) in its reduced form, through the production of NADPH via the PPP14. RdCVFL is expressed by the rods and the cones. RdCVF is a splicing variant of the
nucleoredoxin-like-1 (_NXNL1_) gene corresponding to intron retention and a conserved in-frame stop codon. Splicing of that unique intron produces a messenger ribonucleic acid (mRNA)
encoding an active thioredoxin enzyme, RdCVFL, L for the extension in the C-terminal part of the protein25. ROS is generated from glucose, through glycolysis and pyruvate which is
transferred to the mitochondria by the mitochondrial pyruvate carrier (MPC). We model the rate of production of ROS with respect to time as $${\nu }_{[{\rm{ROS}}]}=\frac{\rho
[{\rm{PYR}}]}{1+\omega [{\rm{NADPH}}]}+r$$ (3) where \(\rho \) is the percentage of ROS produced by leakage of the mitochondrial respiratory chain while \(\omega \) measures the amount of
ROS detoxified/reduced in this process. The parameter _r_ is the contribution to ROS by photo-oxidation and other damaging mechanisms. MOLECULAR DYNAMICS The following set of differential
equations describes the time-dependent behavior of the system at the molecular level. For [g], [G6P], [F16BP], and [PYR], the change in the concentration of substrate with respect to time is
equal to the reaction rate for that concentration of substrate minus the reaction rate of the concentration of product resulting from catabolizing that substrate with an enzyme. For [NADPH]
and [LACT], the change in the concentration of substrate with respect to time is equal to the reaction rate of the substrate concentration minus the loss of substrate concentration due to
natural processes that oxidize or degrade these molecules. The loss of substrate concentration in this instance is represented by \(\tau \) and \(\psi \), where \(\tau \) is the rate at
which [NADPH] is lost and \(\psi \) is the rate at which [LACT] is lost. The rate of change of [G3P] is the difference between the reaction rate for [G3P] and the amount of [G3P] removed for
the renewal of cone OS due to phospholipid synthesis. The latter process is described by \(\eta \), the fraction of G3P removed for phospholipid synthesis and _α_, the utilization of G3P by
a single cone for OS production. The rate of change of [ROS] with respect to time is equal to the reaction rate of [ROS] minus the reduction of [ROS] due to RdCVFL, where _δ__L_ is the rate
at which ROS is reduced due to RdCVFL. $$\begin{array}{rcl}\frac{d[{\rm{g}}]}{dt} & = & {\nu }_{[{\rm{g}}]}-{\nu }_{[{\rm{G}}6{\rm{P}}]}\\ \frac{d[{\rm{G}}6{\rm{P}}]}{dt} & =
& {\nu }_{[{\rm{G}}6{\rm{P}}]}-{\nu }_{[{\rm{F}}16{\rm{BP}}]}-{\nu }_{[{\rm{NADPH}}]}\\ \frac{d[{\rm{F}}16{\rm{BP}}]}{dt} & = & {\nu }_{[{\rm{F}}16{\rm{BP}}]}-{\nu
}_{[{\rm{PYR}}]}-{\nu }_{[{\rm{G}}3{\rm{P}}]}\\ \frac{d[{\rm{G}}3{\rm{P}}]}{dt} & = & {\nu }_{[{\rm{G}}3{\rm{P}}]}-\alpha \eta C[{\rm{G}}3{\rm{P}}]\\ \frac{d[{\rm{NADPH}}]}{dt} &
= & {\nu }_{[{\rm{NADPH}}]}-\tau [{\rm{NADPH}}]\\ \frac{d[{\rm{PYR}}]}{dt} & = & {\nu }_{[{\rm{PYR}}]}-{\nu }_{[{\rm{LACT}}]}\\ \frac{d[{\rm{LACT}}]}{dt} & = & {\nu
}_{[{\rm{LACT}}]}-\psi [{\rm{LACT}}]\\ \frac{d[{\rm{ROS}}]}{dt} & = & {\nu }_{[{\rm{ROS}}]}-{\delta }_{L}[{\rm{ROS}}]\end{array}$$ CELLULAR DYNAMICS Following the models
in5,7,11,12,13, the new equation describing the change in _C_ with respect to time is $$\frac{dC}{dt}=CT{a}_{c}([{\rm{G}}3{\rm{P}}])-C{\mu }_{c}-C{\mu }_{[{\rm{ROS}}]}[{\rm{ROS}}],$$ where
_C_ represents the sum of the proportion of full length of each cone OS in the retina, _μ__c_ is the metabolism associated with OS shedding of _C_, and _μ_[ROS] is the rate of cone
degeneration due to ROS. The cellular metabolism in cones associated with their OS renewal is described by $${a}_{c}([{\rm{G}}3{\rm{P}}])=\epsilon \alpha [{\rm{G}}3{\rm{P}}]$$ (4) where _α_
is the utilization of G3P for phospholipid synthesis. The parameter \(\epsilon \) is the conversion factor of G3P into cone OS discs in the renewal process. We define the proportion of full
length of an OS to be its current length divided by the maximum OS length. The proportion of full length of each OS fluctuates throughout the day due to periodic shedding and continuous
renewal such that at any time it can take any value between 0 and 1. In a healthy retina this value would be far away from zero. Thus, we let _C_ represent the sum of the proportion of full
length of each cone OS in the retina. Similarly, we let _R__n_ represent the sum of the proportion of full length of each rod OS in the retina. Initially, we assume that some portion of OS
are not at full length because of periodic shedding. We let _T_ represent the retinal pigment epithelium (RPE) supplied neuroprotective factors, growth factors, and nutrients. We refer to
_T_ as the trophic pool mediated by the RPE. The equations modeling the sum of the proportion of full length of each rod OS in the retina, _R__n_, and the tropic pool mediated by the RPE,
_T_, take the form $$\begin{array}{rcl}\frac{d{R}_{n}}{dt} & = & {R}_{n}T{a}_{n}-{R}_{n}{\mu }_{n},\\ \frac{dT}{dt} & = & T({\rm{\Gamma }}-kT-{\beta }_{n}{R}_{n}-\gamma
C),\end{array}$$ where _μ__n_ is the metabolism associated with OS shedding of _R__n_, \({\rm{\Gamma }}\) is the total inflow rate into the trophic pool, \(\kappa \) is the limiting capacity
of trophic factors, _β__n_ is the removal of nutrients from _T_ by _R__n_, _γ_ is the removal of nutrients from _T_ by _C_, _a__n_ is the metabolism associated with OS renewal of _R__n_.
SIMULATION RESULTS In our analysis, we consider four cases, the latter two involving RdCVF: (i) the first case is when all process and mechanisms, defined by the parameters, are functioning
properly; (ii) another is when the cones do not efficiently utilize the glucose that enters the cell for phospholipid synthesis, i.e., OS renewal (illustrated by a small \(\epsilon \) value
in (4)); (iii) a third case is one in which the rods are not synthesizing enough RdCVF needed in a healthy retina (illustrated by a small _δ_ value in (5)); and (iv) the final case is where
there is no RdCVF (_δ_ = 0); these results are summarized in Table 1. In order to isolate the specific mechanisms driving these cases, the initial amounts of _C_, _R__n_, and _T_ as well as
the various parameter values were maintained at the same values in all four cases; see Table 2. Simulations of our mathematical model show that qualitatively the behavior of the system is as
expected with oscillations both at the cell population and molecular level. See Figs 3 and 4 where the long term dynamics are plotted. In Fig. 3, the outputs for _C_ qualitatively represent
the sum of the proportion of full length of each cone OS, and the outputs for _R__n_ qualitatively represent the sum of the proportion of full length of each rod OS. In the long run, the
peaks and valleys of the oscillations in Fig. 3 reach the same maximum and minimum value, respectively, which implies that the number of OS is staying approximately constant over time. Thus,
the rods and cones are not dying (as expected when all processes are functioning properly). In Fig. 3 we also see that the trophic pool, which is mediated by the RPE, oscillates. The
trophic pool contains nutrients necessary for cone and rod survival. Thus, the level of the trophic pool should increase as nutrients are replenished and decrease as the rods and cones take
nutrients. The interactions at the cellular level have been extensively studied using mathematical models in12,13. Following the assumptions of these models, the rods and the cones take more
nutrients from the trophic pool than they contribute (as recycled products), and the production of the trophic factors is logistic in nature. Thus, the trophic pool, with its carrying
capacity of \({\rm{\Gamma }}\)/\(\kappa \), will reach an equilibrium in the absence of photoreceptors instead of growing without bound, which we confirmed with simulation and _in silico_
experiments. Biological experiments suggest that the ratio of rods to cones should be approximately 20:1 and the model simulations agree with this when all processes are functioning
properly. (See Supplemental Information A.4). Simulations for the molecular outputs are presented in Fig. 4. Here the concentrations of biochemical quantities (in mM) with respect to time
(in minutes) are displayed. These quantities are the outputs of the chemical reactions mainly involved in the committed steps of the aerobic glycolysis process within a single cone cell; see
Fig. 1. After a very short period of transience, the solutions approach the inherent oscillatory behavior observed in the real system. Thus oscillations can be interpreted as being
consistent with circadian rhythms of photoreceptor OS phagocytosis/shedding and expression of _NXNL1_26,27. Very few experiments have begun to isolate the effect of circadian rhythm on
specific components of the system although there is evidence in some of circadian rhythm (where oscillations persist even under constant dark conditions). To demonstrate the presence of a
circadian rhythm in our model compared with experimental data, we utilize RdCVF and RdCVFL expression data from our experiments; see Fig. 5 below and Fig. 10 in Supplemental Material A.3.
RdCVF and RdCVFL expression data points were recorded at times 0, 4, 8, 12, 16, and 20 hours on Zeitgeber time. Neural retina of wild-type mice were dissected and the ribonucleic acid (RNA)
was purified using cesium chloride (CsCl) ultracentrifugation28. 500 ng of RNA were used for complementary deoxyribonucleic acid (cDNA) reverse transcription (Superscript III enzyme) with
random hexamer, and quantitative reverse transcription polymerase chain reaction (RT-PCR) was performed; see Supplemental Material A.3. RdCVF is expressed exclusively by the rods whereas
RdCVFL is expressed by both the rods and the cones. The expression of RdCVF and RdCVFL is gradually increased after light onset which follows the phagocytosis of photoreceptor OS29.
Interestingly, increased RdCVF expression by rods corresponds to the need to synthesize triglycerides from glucose through the Kennedy pathway to renew cone OS9. When all process are
functioning properly, we anticipate oscillations in order for the rods and cones to be thriving. The rods are synthesizing RdCVF, which binds to the BSG1/GLUT1 complex accelerating the entry
of glucose into the cone cell, and thereby stimulating aerobic glycolysis. As glucose enters the cell triggering aerobic glycolysis, glucose may either travel down the lactate producing
pathway, the Kennedy pathway in the direction of phospholipids synthesis, or be diverted to the PPP for the reduction of ROS, illustrated in Fig. 1. During the aerobic glycolysis process,
the product from a previous reaction is used as the substrate for the following reaction. Thus the concentrations are expected to oscillate in coordination. As further validation of our
model, we compare the output for _C_ with the series 1 _rd1_ global automated data found in Additional File 3 of 30. The data represents the cone density in the _rd1_ mouse using the global
automated method for cone quantification. The _rd1_ mouse model is one in which recessive RP is present and thus the rods die due to a mutation in the rod photoreceptors. This data shows
that the loss of rods and RdCVF leads to cone degeneration and renewal/shedding of cone OS is disrupted. In our mathematical model this translates to reducing _δ_, the RdCVF synthesized by
rods, as well as _μ__c_, the metabolism associated with OS shedding of cones, while keeping all other parameter values the same as in Table 2. Simulating our model for 90 days we see an
exponential decay in _C_ comparable to the death kinetics of cones in the _rd1_ data; see Fig. 6 below. For small _δ_ and _μ__c_ values the model decreases rapidly and then settles down to a
very small _C_-value or zero for extremely small _δ_ values. In Fig. 6 the _C_-value decreases rapidly for the first 30 days, due to lack of RdCVF. In the model output, the disruption in
the metabolism associated with OS shedding is observed through the small amplitude in the oscillations of _C_; see panel B in Fig. 6. UNCERTAINTY AND SENSITIVITY ANALYSES In the work
presented here, we focus on understanding the driving mechanisms involved in cone metabolism and degeneration. Uncertainty analysis (UA) allows us to determine the uncertainty in analytical
or numerical results that comes from uncertainty in input parameters31,32. Sensitivity analysis (SA) quantifies the contributions of individual inputs to model outputs, indicating the
parameters that have the most significant affect on the output variables. We limit our sensitivity analysis to the effect on the cones by changes in the parameter inputs. We performed UA and
SA in MATLAB using Latin Hypercube Sampling (LHS) followed by partial rank correlation coefficient (PRCC) analysis; see Section 4.2. This allowed us to conduct a global sensitivity analysis
of _C_. We conducted these analyses using 500 runs, meaning that the parameter sample space for each parameter in the mathematical model was partitioned into 500 equiprobable intervals that
were sampled to create the LHS matrix. We ran the simulations for each case (discussed in Section 2.4) using \({t}_{0}=0\) and \({t}_{f}=2,000\), and then used the final output values of
the simulations as the initial conditions in the code for the UA and SA. We did this to remove any effect of the initial transients in the computation of the PRCC values. Results are
presented in two different forms in this section. One is a PRCC bar graph that gives the sensitivity of the output, _C_, to changes in the parameters. The PRCC bar graphs contain only the
parameters with significant PRCC values at a specific time point; see Section 4.2. The second form is the flow chart of our molecular model with the significant mechanisms defined by the
parameters and given by the PRCC plots superimposed on it. These results are presented at \(t=60\,{\rm{\min }}\), 1 day, 7 days, and 14 days; see Table 1. When all the processes are
functioning properly (i.e., in a healthy retina), the analysis reveals that cone OS production is driven by three key sets of processes, two at the molecular level within the cones and the
third at the population (of cells) level; see Fig. 7. The first is the contribution of F16BP to DHAP and GAP that ensure the reactions down the glycolysis pathway; see Fig. 1. The second set
of processes involve the availability of G3P and the efficiency to utilize G3P to make phospholipids. The third set involves the competition of cones and rods for resources. These processes
are highlighted in panels B, D, F, and H of Fig. 7 in green (for changes in processes that result in an increase in _C_ when everything is held fixed except for the particular
parameter/process in question) and red (for changes in processes that lead to a decrease in _C_ when everything is held fixed except for the particular parameter/process in question). At day
14, the three sets of key processes remain but the macroscopic influence of the rod cells is only in regards to their rate of energy uptake and metabolism associated with their OS renewal
since enough trophic factors are assumed to be available for a healthy retina. The analysis reveals that any desire to increase OS disc production of the cones when the system is operating
at or near healthy levels would require focusing on one of these three key sets of processes mentioned above. In the first set of processes of this case, for all time snapshots considered,
lesser amounts of F16BP inciting PYR and LACT production, leads to better cone OS renewal. This is reflected in the sensitivity of the cone OS to the parameters _V_max and _K__m_ involved in
the production of PYR and LACT. Changes in these processes (defined by _V_max and _K__m_) that lead to a larger production of PYR and slower catalytic reaction to LACT result in less cone
OS renewal. In our model the relation of [PEP]_eq_ to [PYR] determines if PEP and PYR accumulate and if glucose is rerouted into the PPP and interrupts the catalytic reaction of G3P and
production of phospholipids; see Fig. 2, right panels in Fig. 7, and Supplemental Information Table 15. The second set of key processes is responsible for the availability of G3P and the
efficiency to renew OS discs. The latter is quantified by, \(\epsilon \), the conversion factor of G3P into OS disc renewal. The former is quantified by parameters involved in the production
of G3P, specifically _q_, \({V}_{{{\rm{\max }}}_{[{\rm{G}}3{\rm{P}}]}}\), \({K}_{{m}_{[{\rm{G}}3{\rm{P}}]}}\), and the fraction of G3P removed for phospholipid synthesis, \(\eta \); see
Fig. 7. An increase in \({V}_{{{\rm{\max }}}_{[{\rm{G}}3{\rm{P}}]}}\) and _q_, the proportion of F16BP leading to an increase in [G3P], (as illustrated in Fig. 1) as well as a decrease in
\({K}_{{m}_{[{\rm{G}}3{\rm{P}}]}}\) and \(\eta \) results in more [G3P] that can be utilized for phospholipid synthesis and OS renewal. All these effects involving the second set of
processes are observed for all times considered. The third set of key processes ties into the trophic factors available to both cones and rods as well as their metabolism associated with
shedding and renewal at the population (of cells) level. Reduced availability of trophic factors (due to greater use by the rods) can slow production of the cone OS discs. At 60 minutes,
increases in the initial amount of trophic pool mediated by the RPE, _T_0, and the _C_, _C_0, lead to more cone OS; an increase in the cone metabolism associated with shedding, _μ__c_,
results in a reduction of cone OS, as one would expect. By 24 hours, the cone OS are no longer sensitive to changes in _T_0 and _C_0. However, an increase in the total inflow rate of trophic
factors, \({\rm{\Gamma }}\), and metabolism associated with rod OS renewal, _a__n_, favor the rods and negatively affect cones. Changes in the metabolism associated with shedding of cones,
_μ__c_, and of rods, _μ__n_, have opposite effects in the cone OS with the negative effect of _μ__c_ persisting; see Fig. 7 and Supplementary Information Table 15. At 7 days, the sensitivity
of cone OS to the metabolism associated with shedding of both cones and rods and that of rod renewal remain with the effect of \({\rm{\Gamma }}\) gone. By day 14, the effect of changes in
_μ__n_ on _C_ disappears. When glucose is used inefficiently (illustrated by an extremely small \(\epsilon \)), our analysis demonstrates that the influence on _C_ comes from the same three
key sets of processes as in the healthy retina case. The strength of their respective contributions, as measured by the PRCC values, is approximately the same as in the healthy case. The
results are given in Fig. 12 and Table 16 (both in Supplemental Information). However, there is a rapid decrease in _C_ due to this inefficient use of glucose. Decreasing \(\epsilon \) to 3%
of its regular value, _C_ decreased significantly from \(1.5\times {10}^{5}\) at time \(t=60\,{\rm{minutes}}\) to \(5.7\times {10}^{3}\) at time \(t=14\,{\rm{days}}\). The drastic reduction
but not elimination of RdCVF fundamentally affects the system in a different way because the amount of F16BP available is altered. Two of the three processes, efficiency of making
phospholipids and competition by the rods for resources remain. However, instead of the influence by PYR (because of its effect on the glycolysis pathway vs. PPP), we see that it is the
intracellular level of glucose (before the G6P reaction and potential PPP selection) that significantly affects the system. In this case, the limiting value of the chemical reaction \({\nu
}_{[{\rm{g}}]}=\frac{{V}_{{{\rm{\max }}}_{[{\rm{g}}]}}{(\delta {R}_{n})}^{2}}{{K}_{{m}_{[{\rm{g}}]}}^{2}+{(\delta {R}_{n})}^{2}}\) is much less than \({V}_{{{\rm{\max }}}_{[{\rm{g}}]}}\) in
the long run, indicating that at equilibrium glucose is not entering the cell near its maximum rate. Biologically, the depletion or lack of RdCVF has only been associated with degenerating
rods or rod-less retinas, respectively, such as the case of RP6,8,9,33,34. Thus in this disease-free mathematical model, it is safe to associate the depletion of RdCVF with rod degeneration
(rather than other potential factors that might affect RdCVF but are not currently known or identified). If the rods are dying, then there is further reduction of RdCVF as time goes on,
which results in a magnification of the decrease of glucose entering the cone cell to be metabolized via aerobic glycolysis. Interestingly, the significance of \(\epsilon \), which
represents the efficiency of the cones to use G3P to make phospholipids, decreases over time and it is the overall RdCVF levels, _δ_, and the effectiveness of the rods utilizing trophic
factors, _β__n_, that have the most significant impact. Thus, making sure sufficient levels of RdCVF and trophic factors are available will be the best strategies to increase cone OS
renewal; see Fig. 8 and Supplementary Information Table 17. With no RdCVF available, two of the three processes (efficiency of OS disc production and competition by the rods for trophic)
remain but the system is additionally influenced by upstream products. It is worth noting that _C_ degenerates rapidly in this scenario and only a few cone OS remain by day 7 (from an
initial level of 180,000). For early times (24 hours), it is the initial amount of G6P that matters together with the initial amount of F16BP and the _K__m_ value of F16BP. At seven days,
the initial amount of F16BP no longer matters and by 14 days, nothing within the production or use of F16BP has a large effect (with the Km value of F16BP no longer mattering); see Fig. 9
and Supplemental Information Table 18. It is important to keep in mind that the analysis performed here looked at parameter ranges generated by considering ±10% changes from the parameter
baseline values given in Table 2 with the exception of parameters that did not meet the monotonicity requirement; see Section 4 and Supplemental Information A.5. The only drastic changes in
parameters were those that made the three cases: inefficient G3P use (\(\epsilon \) is 3% of its normal value), drastically reduced RdCVF levels (_δ_ is 0.1% of its normal value), and the
absence of RdCVF (\(\delta =0\)). DISCUSSION The results presented here can be used to asses the biological significance of the parameters in relation to the cones to understand the driving
mechanisms of cone viability in aerobic glycolysis within a cone photoreceptor. The developed mathematical model of the molecular and cellular level photoreceptor interactions consists of an
11-dimensional system of nonlinear ordinary differential equations. The 11-dimensional system is composed of two sub-systems; an 8-dimensional system that models the molecular level
interactions within a single cone photoreceptor, and a 3-dimensional system that models the cellular level interactions between the rods, cones, and trophic pool. Including only the
committed (biochemically irreversible) aerobic glycolysis steps, the PPP, OXPHO, and phospholipid synthesis allowed us to focus on the most essential mechanisms of cone metabolism. Equally
important was the incorporation of cellular level equations (describing the dynamics of cones, rods, trophic pool) that were modified and built from Camacho _et al_.7,11,12. Because the cell
populations and molecular concentrations interact with and rely on each other, we are able to better understand how molecular level interactions affect cellular level populations.
Mathematically, these interactions are illustrated via the equations where the outputs of each subsystem are included as inputs of the other system. Specifically, G3P is removed for
phospholipid synthesis resulting in the renewal of cone OS, and thus the _C_ equation depends on the concentration of G3P as the cone energy uptake, represented by equation (4), is a
function of G3P. Similarly ROS has its own equation at the molecular level but since accumulation of ROS negatively affects the cones, it’s output [ROS](_t_) is an input to the cone
equation, \(\frac{dC}{dt}\). As another example, the rods synthesize RdCVF, which triggers the process of aerobic glycolysis in the cone photoreceptors by binding to a BSG1/GLUT1 complex,
and accelerating the entry of glucose into the cell. To account for this, [_δR__n_], the concentration of free unbound RdCVF, is included in the glucose (GLc) equation, \(\frac{dg}{dt}\), in
the molecular level subsystem. Our model also includes two activation and inhibition functions, \({{\rm{\Omega }}}_{[{\rm{PYR}}]}\) and \({{\rm{\Phi }}}_{[{\rm{PYR}}]}\), at the molecular
level. In the model, pyruvate was used as a proxy for accumulation of PEP due to oxidation of cysteine (358), a residue on pyruvate kinase. Thus, as ROS accumulates, PYR gets backed up. Once
PYR reaches an equilibrium value, \({[{\rm{PEP}}]}_{eq}\), indicating that the concentration of ROS is too high, G6P re-routes glucose into the PPP and two molecules of NADPH are produced
to help with the reduction of ROS. If PYR remains below \({[{\rm{PEP}}]}_{eq}\), F16BP is produced as glucose continues to travel down the lactate producing pathway. Thus, \({{\rm{\Omega
}}}_{[{\rm{PYR}}]}\) and \({{\rm{\Phi }}}_{[{\rm{PYR}}]}\) are included in our \(\frac{d[{\rm{G}}6{\rm{P}}]}{dt}\), \(\frac{d[{\rm{F}}16{\rm{BP}}]}{dt}\), and \(\frac{d[{\rm{NADPH}}]}{dt}\)
equations. When \([{\rm{PYR}}] > {[{\rm{PYR}}]}_{eq}\), \({{\rm{\Phi }}}_{[{\rm{PYR}}]}\) is activated and \({{\rm{\Omega }}}_{[{\rm{PYR}}]}\) is inhibited promoting the creation of two
NADPH molecules. When \([{\rm{PYR}}] < [{\rm{PYR}}{]}_{eq}\), \({{\rm{\Omega }}}_{[{\rm{PYR}}]}\) is activated and \({{\rm{\Phi }}}_{[{\rm{PYR}}]}\) is inhibited promoting the production
of F16BP. We considered the situation of a cone in which all processes were functioning properly and three different scenarios that showed various alterations from this. In the case of the
cone in which all processes were functioning properly, we determined that three key sets of processes have the most effect on the cone OS production. There are two molecular processes: the
contribution of F16BP to DHAP and GAP that ensure the reactions down the glycolysis pathway together with the availability of G3P and the efficiency to utilize G3P to make phospholipids.
There is also a population-level process and it involves the cones and rods competition for resources. When we considered the effect of an inefficient use of glucose to make cone OS, the
influence of the various parameters remained the same as in the case in which all processes were functioning properly. The other two scenarios involved RdCVF. In the extreme case of no
RdCVF, _C_ dies off as the cone OS production cannot be maintained by glucose uptake in the absence of RdCVF. When there is a limited amount of RdCVF, the efficiency of making phospholipids
and competition by the rods for resources remain important processes in cone OS production. Additionally, we found that the intracellular levels of glucose significantly affect the system.
Taken together, in situations in which there are low levels of rods as in the case of RP, it is crucial to ensure there are sufficient levels of RdCVF and trophic factors available in order
to maintain cone OS renewal. The Michaelis-Menten and allosteric kinetics are well-documented ways to observe individual chemical reactions as described in the manuscript. Thus, we believe
the predictions of strength and importance of various pathways suggested by our results can give important guidance to experimentalists trying to identify such key pathways. The goal of this
paper was to verify the reliance of rods on cones via RdCVF and understand which processes (represented by the parameters) contribute to the vitality of the cones using uncertainty and
sensitivity analysis. To the authors’ knowledge, this is the first time that an analysis of aerobic glycolysis in a cone photoreceptor has been conducted. We used the outcome of our
sensitivity analysis to help identify which parameters have the greatest affect on the cones. These results can lead to important insight into the design of new experiments and at what time
point a particular parameter’s affect on the cones should be considered. METHODS MATHEMATICAL MODEL Following the descriptions in Sections 2.1, 2.2, and 2.3, we have the following equations
that govern the dynamics of the system at the molecular and cellular levels. Molecular level: $$\frac{d[{\rm{g}}]}{dt}=\lambda ([G]-[{\rm{g}}])\,(\frac{{V}_{{{\rm{\max
}}}_{[{\rm{g}}]}}{(\delta {R}_{n})}^{2}}{{K}_{{m}_{[{\rm{g}}]}}^{2}+{(\delta {R}_{n})}^{2}}+p)-\frac{{V}_{{{\rm{\max
}}}_{[{\rm{G}}6{\rm{P}}]}}{[{\rm{g}}]}^{2}}{{K}_{{m}_{[{\rm{G}}6{\rm{P}}]}}^{2}+{[{\rm{g}}]}^{2}}$$ (5) $$\tfrac{d[{\rm{G}}6{\rm{P}}]}{dt}=\tfrac{{V}_{{{\rm{\max
}}}_{[\mathrm{G6P}]}}{[{\rm{g}}]}^{2}}{{K}_{{m}_{[{\rm{G}}6{\rm{P}}]}}^{2}+{[{\rm{g}}]}^{2}}-\tfrac{{V}_{{{\rm{\max
}}}_{[{\rm{F}}16{\rm{BP}}]}}{[{\rm{G6P}}]}^{2}}{{K}_{{m}_{[{\rm{F}}16{\rm{BP}}]}}^{2}+{[{\rm{G}}6{\rm{P}}]}^{2}}{{\rm{\Omega }}}_{[{\rm{PYR}}]}-\tfrac{2{V}_{{{\rm{\max
}}}_{[{\rm{NADPH}}]}}{[{\rm{G6P}}]}^{2}}{{K}_{{m}_{[{\rm{NADPH}}]}}^{2}+{[{\rm{G6P}}]}^{2}}{{\rm{\Phi }}}_{[{\rm{PYR}}]}$$ (6) $$\tfrac{d[{\rm{F}}16{\rm{BP}}]}{dt}=\tfrac{{V}_{{{\rm{\max
}}}_{[{\rm{F}}16{\rm{BP}}]}}{[{\rm{G}}6{\rm{P}}]}^{2}}{{K}_{{m}_{[{\rm{F}}16{\rm{BP}}]}}^{2}+{[{\rm{G}}6{\rm{P}}]}^{2}}{{\rm{\Omega }}}_{[{\rm{PYR}}]}-\tfrac{(1-q)\,{V}_{{{\rm{\max
}}}_{[{\rm{PYR}}]}}{[{\rm{F}}16{\rm{BP}}]}^{2}}{{K}_{{m}_{[{\rm{PYR}}]}}^{2}+{[{\rm{F}}16{\rm{BP}}]}^{2}}-\tfrac{q{V}_{{{\rm{\max
}}}_{[{\rm{G}}3{\rm{P}}]}}{[{\rm{F}}16{\rm{BP}}]}^{2}}{{K}_{{m}_{[{\rm{G}}3{\rm{P}}]}}^{2}+{[{\rm{F}}16{\rm{BP}}]}^{2}}$$ (7) $$\frac{d[{\rm{G}}3{\rm{P}}]}{dt}=\frac{q{V}_{{{\rm{\max
}}}_{[{\rm{G}}3{\rm{P}}]}}{[{\rm{F}}16{\rm{BP}}]}^{2}}{{K}_{{m}_{[{\rm{G}}3{\rm{P}}]}}^{2}+{[{\rm{F}}16{\rm{BP}}]}^{2}}-\eta \alpha C[{\rm{G}}3{\rm{P}}]$$ (8)
$$\frac{d[{\rm{NADPH}}]}{dt}=\frac{2{V}_{{{\rm{\max }}}_{[{\rm{NADPH}}]}}{[{\rm{G}}6{\rm{P}}]}^{2}}{{K}_{{m}_{[{\rm{NADPH}}]}}^{2}+{[{\rm{G}}6{\rm{P}}]}^{2}}{{\rm{\Phi
}}}_{[{\rm{PYR}}]}-\tau [{\rm{NADPH}}]$$ (9) $$\frac{d[{\rm{PYR}}]}{dt}=\frac{(1-q)\,{V}_{{{\rm{\max
}}}_{[{\rm{PYR}}]}}{[{\rm{F}}16{\rm{BP}}]}^{2}}{{K}_{{m}_{[{\rm{PYR}}]}}^{2}+{[{\rm{F}}16{\rm{BP}}]}^{2}}-\frac{(1-\rho )\,{V}_{{{\rm{\max
}}}_{[{\rm{LACT}}]}}[{\rm{PYR}}]}{{K}_{{m}_{[{\rm{LACT}}]}}+[{\rm{PYR}}]}$$ (10) $$\frac{d[{\rm{LACT}}]}{dt}=\frac{(1-\rho )\,{V}_{{{\rm{\max
}}}_{[{\rm{LACT}}]}}[{\rm{PYR}}]}{{K}_{{m}_{[{\rm{LACT}}]}}+[{\rm{PYR}}]}-\psi [{\rm{LACT}}]$$ (11) $$\frac{d[{\rm{ROS}}]}{dt}=\frac{\rho [{\rm{PYR}}]}{1+\omega [{\rm{NADPH}}]}+r-{\delta
}_{L}[{\rm{ROS}}]$$ (12) Cellular (population) level: $$\frac{dC}{dt}=CT\epsilon \alpha [{\rm{G}}3{\rm{P}}]-C{\mu }_{c}-C{\mu }_{[{\rm{ROS}}]}[{\rm{ROS}}]$$ (13)
$$\frac{d{R}_{n}}{dt}={R}_{n}T{a}_{n}-{R}_{n}{\mu }_{n}$$ (14) $$\frac{dT}{dt}=T({\rm{\Gamma }}-kT-{\beta }_{n}{R}_{n}-\gamma C)$$ (15) with variables and parameters previously defined and
parameter values given in Table 2 and Supplemental Information A.1 and A.2. UNCERTAINTY AND SENSITIVITY ANALYSIS Uncertainty and sensitivity analyses are necessary to explore how uncertainty
in the input parameter values affects the model outputs. In any mathematical model of a complex system one is bound to have uncertainties in the input parameters and these will be reflected
in the output of the model. This uncertainty can be attributed to errors, noise, or variability in the experimental data from which parameter values are inferred or due to the fact that
exact parameter values are unknown or cannot be inferred from the data. Sensitivity analysis (SA) measures the change in the output brought about by a unit change in a particular input
parameter or initial condition. It allows us to determine the contributions of the uncertain inputs to the uncertainty in the analysis results32. Both uncertainty and sensitivity analysis go
hand in hand because the analysis and results of the model outputs are functions of the input parameters and their respective uncertainties35,36. In our uncertainty analysis (UA), inputs
are generated by the Latin Hypercube Sampling (LHS) procedure. To implement LHS, all parameters were set to a baseline value (given in Table 2) and then the parameter sample space was
generated over a [−10%, +10%] variation from the baseline. For parameter values in which a change did not yield a monotonic change in the cone values, we restricted their respective ranges
as monotonicity is one of the criteria of the methodology; see Fig. 11 in the Supplemental Material. This occurred in one to three parameters in the SA for the three different cases we
investigated and is described in Supplemental Information A.5. Furthermore, there were a few other parameters held constant in the SA code because the corresponding percent change in cones
was insignificant; see Supplemental Information A.5. For LHS implementation every parameter space was partitioned into non-overlapping intervals of equal probability and assigned a
probability density function (pdf) according to a uniform probability distribution. Exactly one value was sampled/selected at random from each interval with respect to the pdf over the
parameter space. PRCC analysis is used when there exists a nonlinear, monotonic relationship between inputs and outputs35. Rather than measuring the correlation between the variable values,
the PRCC value measures the correlation of the ranked ordering of the variable values37. PRCC values are between −1 and 1. The magnitude of the PRCC indicates the sensitivity of the output
to the parameter value uncertainty, and the sign of the PRCC value indicates that either a positive or negative correlation exists. Using the standard threshold values, |PRCC| > 0.5 and
p-value < 0.05, where the p-value determines the significance of the PRCC value, we may say that the output is sensitive to the parameter35. This method described provides a global UA and
SA to understand the effect of the inputs into the system35. REFERENCES * Wong-Riley, M. Energy metabolism of the visual system. _Eye and Brain_ 2, 99 (2010). PubMed PubMed Central Google
Scholar * Young, R. The renewal of photoreceptor cell outer segments. _J. Cell Biol._ 33, 61–72 (1967). CAS PubMed PubMed Central Google Scholar * O’Day, W. & Young, R. Rhythmic
daily shedding of outer-segment membranes by visual cells in the goldfish. _J. Cell Biol._ 76, 593–604 (1978). PubMed Google Scholar * Zhang, Y., Chioreso, C., Schweizer, M. L. &
Abramoff, M. D. Effects of aflibercept for neovascular age-related macular degeneration: a systematic review and meta-analysis of observational comparative studies. _Invest. Ophth. Vis.
Sci._ 58, 5616–5627 (2017). CAS Google Scholar * Camacho, E. T., Melara, L. A., Villalobos, M. C. & Wirkus, S. Optimal control in the treatment of retinitis pigmentosa. _B. Math.
Biol._ 76, 292–313 (2014). MathSciNet CAS MATH Google Scholar * Léveillard, T. _et al_. Identification and characterization of rod-derived cone viability factor. _Nat. Genet._ 36, 755
(2004). PubMed Google Scholar * Camacho, E. T., Punzo, C. & Wirkus, S. A. Quantifying the metabolic contribution to photoreceptor death in retinitis pigmentosa via a mathematical
model. _J. Theor. Biol._ 408, 75–87 (2016). PubMed PubMed Central MATH Google Scholar * Léveillard, T. & Sahel, J.-A. Rod-derived cone viability factor for treating blinding
diseases: from clinic to redox signaling. _Sci. Transl. Med._ 2, 26ps16–26ps16 (2010). PubMed PubMed Central Google Scholar * Léveillard, T. & Sahel, J.-A. Metabolic and redox
signaling in the retina. _Cell. Mol. Life Sci._ 74, 3649–3665 (2017). PubMed Google Scholar * Aït-Ali, N. _et al_. Rod-derived cone viability factor promotes cone survival by stimulating
aerobic glycolysis. _Cell_ 161, 817–832 (2015). PubMed Google Scholar * Camacho, E. T. _et al_. A mathematical model for photoreceptor interactions. _J. Theor. Biol._ 21, 638–646 (2010).
MathSciNet Google Scholar * Camacho, E. T. & Wirkus, S. Tracing the progression of retinitis pigmentosa via photoreceptor interactions. _J. Theor. Biol._ 317C, 105–118 (2013). MATH
Google Scholar * Camacho, E. T., Léveillard, T., Sahel, J.-A. & Wirkus, S. Mathematical model of the role of RdCVF in the coexistence of rods and cones in a healthy eye. _B. Math.
Biol._ 78, 1394–1409 (2016). MathSciNet MATH Google Scholar * Nohl, H., Gille, L. & Staniek, K. Intracellular generation of reactive oxygen species by mitochondria. _Biochem.
Pharmacol._ 69, 719–723 (2005). CAS PubMed Google Scholar * Mei, X. _et al_. The thioredoxin encoded by the rod-derived cone viability factor gene protects cone photoreceptors against
oxidative stress. _Antioxid. Redox Sign._ 24, 909–923 (2016). CAS Google Scholar * Kim, D.-I. _et al_. Hyperglycemia-induced GLP-1R downregulation causes RPE cell apoptosis. _Int. J.
Biochem. Cell B._ 59, 41–51 (2015). CAS Google Scholar * Hebert, D. N. & Carruthers, A. Glucose transporter oligomeric structure determines transporter function. Reversible
redox-dependent interconversions of tetrameric and dimeric GLUT1. _J. Biol. Chem._ 267, 23829–23838 (1992). CAS PubMed Google Scholar * Moretti, A. I. S. & Laurindo, F. R. M. Protein
disulfide isomerases: Redox connections in and out of the endoplasmic reticulum. _Arch. Biochem. Biophys._ 617, 106–119 (2017). Google Scholar * Berg, J. M., L., T. J. & Stryer, L.
_Biochemistry_ (Palgrave MacMillan; 7th revised international ed edition, 2011). * Grüning, N.-M., Du, D., Keller, M. A., Luisi, B. F. & Ralser, M. Inhibition of triosephosphate
isomerase by phosphoenolpyruvate in the feedback-regulation of glycolysis. _Open Biol._ 4, 130232 (2014). PubMed PubMed Central Google Scholar * Chinchore, Y., Begaj, T., Wu, D.,
Drokhlyansky, E. & Cepko, C. L. Glycolytic reliance promotes anabolism in photoreceptors. _Elife_ 6, e25946 (2017). PubMed PubMed Central Google Scholar * Kanow, M. A. _et al_.
Biochemical adaptations of the retina and retinal pigment epithelium support a metabolic ecosystem in the vertebrate eye. _Elife_ 6, e28899 (2017). PubMed PubMed Central Google Scholar *
Hurley, J. B., Lindsay, K. J. & Du, J. Glucose, lactate, and shuttling of metabolites in vertebrate retinas. _J. Neurosci. Res._ 93, 1079–1092 (2015). CAS PubMed PubMed Central Google
Scholar * Stone, J. _et al_. Mechanisms of photoreceptor death and survival in mammalian retina. _Prog. Retin. Eye Res._ 18, 689–735 (1999). CAS PubMed Google Scholar * Fridlich, R. _et
al_. The thioredoxin-like protein rod-derived cone viability factor (RdCVFL) interacts with TAU and inhibits its phosphorylation in the retina. _Mol. Cell. Proteomics_ 8, 1206–1218 (2009).
CAS PubMed PubMed Central Google Scholar * Zhang, F., Liu, Z., Kurokawa, K. & Miller, D. T. _Tracking dynamics of photoreceptor disc shedding with adaptive optics_-_optical coherence
tomography_ in _Ophthalmic Technologies XXVII_ 10045, 1004517 (2017). * Wolloscheck, T., Kunst, S., Kelleher, D. K. & Spessert, R. Transcriptional regulation of nucleoredoxinlike genes
takes place on a daily basis in the retina and pineal gland of rats. _Visual Neurosci_. 32 (2015). * Delyfer, M.-N. _et al_. Transcriptomic Analysis of Human Retinal Surgical Specimens Using
jouRNAl. _Jove_-_J_. _Vis_. _Exp_. 78 (2013). * Law, A.-L. _et al_. Cleavage of mer tyrosine kinase (MerTK) from the cell surface contributes to the regulation of retinal phagocytosis. _J.
Biol. Chem._ 290, 4941–4952 (2015). CAS PubMed Google Scholar * Clérin, E. _et al_. E-conome: an automated tissue counting platform of cone photoreceptors for rodent models of retinitis
pigmentosa. _BMC Ophthalmol._ 11, 38 (2011). PubMed PubMed Central Google Scholar * Helton, J. C. & Davis, F. Illustration of sampling-based methods for uncertainty and sensitivity
analysis. _Risk Anal._ 22, 591–622 (2002). CAS PubMed Google Scholar * Helton, J. C., Johnson, J. D., Sallaberry, C. J. & Storlie, C. B. Survey of sampling-based methods for
uncertainty and sensitivity analysis. _Reliab. Eng. Syst. Safe._ 91, 1175–1209 (2006). Google Scholar * Byrne, L. C. _et al_. Viral-mediated RdCVF and RdCVFL expression protects cone and
rod photoreceptors in retinal degeneration. _J. Clin. Invest._ 125, 105–116 (2015). PubMed Google Scholar * Hanein, S. _et al_. In, 9–14 (Springer, 2006). * Marino, S., Hogue, I. B., Ray,
C. J. & Kirschner, D. E. A methodology for performing global uncertainty and sensitivity analysis in systems biology. _J. Theor. Biol._ 254, 178–196 (2008). MathSciNet PubMed PubMed
Central MATH Google Scholar * Blower, S. M. & Dowlatabadi, H. Sensitivity and uncertainty analysis of complex models of disease transmission: an HIV model, as an example. _Int_.
_Stat_. _Rev_. 229–243 (1994). * Conover, W. J. & Iman, R. L. Rank transformations as a bridge between parametric and nonparametric statistics. _Am. Stat._ 35, 124–129 (1981). MATH
Google Scholar * Carruthers, A. GLUT1 Structure, Function and Trafficking-Regulation by Cellular Redox and Metabolic Status. _Metabolic and Redox Signalling in the Retina and Central
Nervous System_, http://www.college-de-france.fr/site/en-jose-alain-sahel/studyday-2016-03-16-14h45.htm (Accessed: 10-27-2016). * Marín-Hernández, A. _et al_. Modeling cancer glycolysis
under hypoglycemia, and the role played by the differential expression of glycolytic isoforms. _FEBS J._ 281, 3325–3345 (2014). PubMed Google Scholar * Moreno-Sánchez, R. _et al_.
Phosphofructokinase type 1 kinetics, isoform expression, and gene polymorphisms in cancer cells. _J. Cell. Biochem._ 113, 1692–1703 (2012). PubMed Google Scholar * Rufino-Palomares, E. E.
_et al_. NADPH production, a growth marker, is stimulated by maslinic acid in gilthead sea bream by increased NADP-IDH and ME expression. _Comp. Biochem. Phys. C._ 187, 32–42 (2016). CAS
Google Scholar * Kashiwaya, Y. _et al_. Control of glucose utilization in working perfused rat heart. _J. Biol. Chem._ 269, 25502–25514 (1994). CAS PubMed Google Scholar * Zhang, L. _et
al_. A polymer-based ratiometric intracellular glucose sensor. _Chem. Commun._ 50, 6920–6922 (2014). CAS Google Scholar Download references ACKNOWLEDGEMENTS T.L., G.M.-P. and J.S.
gratefully acknowledge support from INSERM, Sorbonne University, ANR, Labex Lifesenses and Foundation fighting blindness. We acknowledge Christo Kole for help with day-time measurement of
RdCVF and RdCVFL messenger RNAs. We thank the two reviewers for their helpful comments and suggestions. AUTHOR INFORMATION AUTHORS AND AFFILIATIONS * School of Mathematical & Natural
Sciences, Arizona State University, Glendale, AZ, 85306, USA Erika T. Camacho & Tatyana Korneyeva * School of Mathematical & Statistical Sciences, Arizona State University, Tempe,
AZ, 85287, USA Danielle Brager * Institut de la Vision: Department of genetics Sorbonne Université, INSERM, CNRS, Institut de la Vision, 17 rue Moreau, F-75012, Paris, France Ghizlane
Elachouri, Géraldine Millet-Puel, José-Alain Sahel & Thierry Léveillard Authors * Erika T. Camacho View author publications You can also search for this author inPubMed Google Scholar *
Danielle Brager View author publications You can also search for this author inPubMed Google Scholar * Ghizlane Elachouri View author publications You can also search for this author
inPubMed Google Scholar * Tatyana Korneyeva View author publications You can also search for this author inPubMed Google Scholar * Géraldine Millet-Puel View author publications You can also
search for this author inPubMed Google Scholar * José-Alain Sahel View author publications You can also search for this author inPubMed Google Scholar * Thierry Léveillard View author
publications You can also search for this author inPubMed Google Scholar CONTRIBUTIONS E.C. and T.L. conceived the work, E.C., T.K. and T.L. derived the mathematical model, E.C. and D.B.
derived and analyzed the results, E.C., D.B. and T.L. interpreted the results, T.L., G.E. and G.M.-P. conducted the experiments, E.C., D.B. and T.L. wrote the paper, and all authors reviewed
the manuscript. CORRESPONDING AUTHOR Correspondence to Erika T. Camacho. ETHICS DECLARATIONS COMPETING INTERESTS The authors declare no competing interests. ADDITIONAL INFORMATION
PUBLISHER’S NOTE: Springer Nature remains neutral with regard to jurisdictional claims in published maps and institutional affiliations. SUPPLEMENTARY INFORMATION SUPPLEMENTARY INFO RIGHTS
AND PERMISSIONS OPEN ACCESS This article is licensed under a Creative Commons Attribution 4.0 International License, which permits use, sharing, adaptation, distribution and reproduction in
any medium or format, as long as you give appropriate credit to the original author(s) and the source, provide a link to the Creative Commons license, and indicate if changes were made. The
images or other third party material in this article are included in the article’s Creative Commons license, unless indicated otherwise in a credit line to the material. If material is not
included in the article’s Creative Commons license and your intended use is not permitted by statutory regulation or exceeds the permitted use, you will need to obtain permission directly
from the copyright holder. To view a copy of this license, visit http://creativecommons.org/licenses/by/4.0/. Reprints and permissions ABOUT THIS ARTICLE CITE THIS ARTICLE Camacho, E.T.,
Brager, D., Elachouri, G. _et al._ A Mathematical Analysis of Aerobic Glycolysis Triggered by Glucose Uptake in Cones. _Sci Rep_ 9, 4162 (2019). https://doi.org/10.1038/s41598-019-39901-z
Download citation * Received: 18 June 2018 * Accepted: 31 January 2019 * Published: 11 March 2019 * DOI: https://doi.org/10.1038/s41598-019-39901-z SHARE THIS ARTICLE Anyone you share the
following link with will be able to read this content: Get shareable link Sorry, a shareable link is not currently available for this article. Copy to clipboard Provided by the Springer
Nature SharedIt content-sharing initiative


![[withdrawn] qrops online service - country and currency codes](https://www.gov.uk/assets/static/govuk-opengraph-image-03837e1cec82f217cf32514635a13c879b8c400ae3b1c207c5744411658c7635.png)


