- Select a language for the TTS:
- UK English Female
- UK English Male
- US English Female
- US English Male
- Australian Female
- Australian Male
- Language selected: (auto detect) - EN
Play all audios:
ABSTRACT Digital holographic microscopy (DHM) is an intriguing medical diagnostic tool due to its label-free and quantitative nature, providing high-contrast images of phase samples. By
capturing both intensity and phase information, DHM enables the numerical reconstruction of quantitative phase images. However, the lateral resolution is limited by the diffraction limit,
which prompted the recent suggestion of microsphere-assisted DHM to enhance the DHM resolution straightforwardly. The use of such a technique as a medical diagnostic tool requires testing
and validation of the proposed assays to prove their feasibility and viability. This paper publishes 760 and 609 microsphere-assisted DHM images of normal and thalassemic red blood cells
obtained from a normal and thalassemic male individual, respectively. SIMILAR CONTENT BEING VIEWED BY OTHERS INSIGHTS INTO POLYCRYSTALLINE MICROSTRUCTURE OF BLOOD FILMS WITH 3D MUELLER
MATRIX IMAGING APPROACH Article Open access 13 June 2024 HIGH SPACE–TIME BANDWIDTH PRODUCT IMAGING IN LOW COHERENCE QUANTITATIVE PHASE MICROSCOPY Article Open access 22 April 2024
QUANTITATIVE PHASE IMAGING BASED ON HOLOGRAPHY: TRENDS AND NEW PERSPECTIVES Article Open access 27 June 2024 BACKGROUND & SUMMARY Optical microscopy is the most widely used technique for
pathological inspection of biological samples1. Conventional microscopy provides a two-dimensional (2D) image corresponding to the light intensity distribution across the specimen. Digital
holographic microscopy (DHM), however, provides a phase image thanks to its ability to capture both intensity and phase information across the specimen2. DHM is an interesting technique to
obtain phase images of cells for automated disease identification3. In recent advancements, DHM, combined with hierarchical machine learning, has been successfully applied for the
differential diagnosis of hereditary anemias, demonstrating the technique’s capability to classify healthy and pathological red blood cells (RBCs) from phase-contrast maps with high
accuracy4. However, like other optical microscopy methods, the lateral spatial resolution in DHM is subject to the diffraction limit5. There has been a significant amount of interest in
developing multiple approaches to overcome this limitation toward optical super-resolution imaging6. This can be safely achieved by synthetically increasing the numerical aperture (NA) of
the detection system, which manipulates the system’s degrees of freedom to synthetically increase the NA, thereby enhancing lateral resolution7,8. In this amongst, microsphere-assisted
microscopy (MAM) stands out for its simplicity, cost-effectiveness, and the advantage of enhancing resolution in all lateral directions simultaneously, making it particularly suitable for
real-time imaging of dynamic live specimens6,9,10. In MAM, a transparent micron-scale sphere is positioned over the specimen to enhance lateral resolution compared to the same system
operating in the absence of the microsphere11. MAM, thanks to its broadband and versatile nature, can be incorporated into various microscopy techniques, including
confocal12,fluorescent13,14, two-photon and second-harmonic generation microscopies15, profilometry16,17, polarimetry18 and DHM19,20,21. A normal RBC typically has a biconcave disc shape,
resembling a shallow donut or a disk with a depressed center. Its diameter ranges from 6 to 8 μm while reaching a thickness of approximately 2 μm at the edges. This specific geometry
provides a high surface area-to-volume ratio, facilitating the exchange of oxygen and carbon dioxide. These morphological characteristics, in conjunction with the absence of a nucleus,
contribute to the RBC’s ability to navigate through narrow capillaries and ensure effective oxygen delivery to tissues throughout the body. However, certain diseases or health conditions can
lead to alterations in RBC morphology. For example, in thalassemia minor, changes in the RBC membrane composition lead to increased rigidity and a propensity for deformation. Thalassemia
encompasses various forms, including thalassemia major, which is more severe, and thalassemia minor, which occurs when an individual inherits a faulty gene from only one parent22,23. These
inherited blood disorders can be detected and diagnosed through medical laboratory tests such as a complete blood count (CBC), which can identify anemia, and a hemoglobin electrophoresis
test, which can detect abnormal forms of hemoglobin in the RBCs. These diagnostic tests play a crucial role in accurately identifying and classifying different types of thalassemia, allowing
healthcare professionals to provide appropriate management and treatment strategies. The morphological study of thalassemic RBCs reveals distinct characteristics associated with this
genetic condition. When examining the RBCs of individuals with thalassemia minor, several morphological changes are typically observed. These changes include microcytosis, where the cells
appear smaller than normal; hypochromia, resulting in paler cells due to decreased hemoglobin content; the presence of target cells, also known as codocytes, which display a bullseye-like
appearance; anisocytosis, indicating variations in cell size; and poikilocytosis, representing a variety of abnormal cell shapes. The severity and presence of these morphological changes can
vary among individuals, but microcytosis and hypochromia are the most common types observed. Understanding these distinct morphological features of RBCs in thalassemia minor is crucial for
diagnosing and differentiating this condition from other forms of anemia. Therefore, DHM is expected to accurately distinguish thalassemic RBCs from normal ones, as it can provide precise
quantitative morphometric information about phase objects. Recorded holograms of cells offer a wealth of information beyond just visualizing their structure. These holograms enable the
extraction of various features, such as cell membrane roughness, thickness distribution behavior, cell circularity, volumetric aspect ratio, and cell convexity24,25,26. Evaluating these
parameters provides crucial insights into cell health, integrity, deformations, and response to external stimuli. For example, assessing membrane roughness allows researchers to study
cell-membrane interactions and identify pathological conditions. Analyzing thickness distribution helps understand variations in cellular deformations, while circularity indicates deviations
in cellular function. Volumetric aspect ratio aids in differentiating cell types and detecting changes caused by diseases or environmental factors. Additionally, measuring cell convexity
reveals alterations in adhesion, cytoskeletal rearrangements, and membrane protrusions27. These derived parameters serve as identification markers and are vital for investigating the impact
of organic compounds on cell structures, enabling advancements in fields like medicine, biology, and materials science3,28,29. Furthermore, DHM offers the unique advantage of measuring the
dry mass distribution of RBCs, which correlates with hemoglobin content and, consequently, the oxygen transport capacity of the blood—a feature that aligns with conventional mean corpuscular
hemoglobin (MCH) and mean corpuscular volume (MCV) measures used in blood screening30. This capability is particularly significant in the context of RBCs, as variations in hemoglobin
concentration can lead to changes in optical thickness and cell membrane properties, impacting the mechanical and physical characteristics of the cells30. It has been suggested that MAM
combined with DHM has the potential for cell identification21,31,32. when combined, MAM enhances the lateral resolution, while DHM provides high axial resolution to create a phase map. To
prove the principle for a medical diagnostic application, we already tested microsphere-assisted DHM to differentiate between a small number of thalassemia minor RBCs (tRBCs) and normal RBCs
(nRBCs)31. However, only a volumetric analysis of such cells was performed, and it was limited to 140 RBCs from either case. Recorded digital holograms could be used to perform a more
rigorous morphologic study to accurately determine the sub-type of the tRBCs. Developing such a technique requires training on a large data set33,34,35. Due to the novelty of
microsphere-assisted DHM, here for the first time, we share DHM data of 760 images of nRBCs and 609 images of tRBCs. METHODS PRINCIPLES OF DHM Holography involves a two-step process,
beginning with the recording of an interference pattern between a reference beam and an object beam, followed by the reconstruction of a phase map through the illumination of the recorded
hologram with coherent light. During recording, a coherent light beam is split into two arms, with one arm directed towards the object, causing light to scatter onto the image plane, while
the other arm reaches the image plane intact36,37. The beams’ superposition on the image plane creates a hologram, encoding the intensity and phase information required for faithful object
reconstruction. Conventional holography involves capturing holograms on photographic plates, which then undergo development and fixation processes similar to traditional photography. The
interaction of light waves with objects leads to alterations in both their amplitude and phase, which can be attributed to the unique physical and structural characteristics of the objects.
This can be expressed by the spatial part of the reflected or transmitted light wave as follows: $$\vec{E}(x,y)={\vec{E}}_{0}(x,y){e}^{i\phi (x,y)},$$ (1) where \({E}_{0}(x,y)\) and \(\phi
(x,y)\) represent the amplitude and phase of the light wave, respectively. The amplitude changes are influenced by light absorption in the object, while the phase changes are related to
variations in thickness (for transmissive objects) or surface height profile (for reflective objects). However, conventional image detectors can only capture the intensity of the light wave
\((I(x,y)={|{\vec{E}}_{0}(x,y)|}^{2})\), resulting in the loss of phase information, which carries valuable phase object details. To preserve and detect phase information, holography relies
on superposing the object’s light wave with a reference light wave before reaching the detector. The interference pattern of the object (sample) beam, \({\vec{E}}_{0{\rm{s}}}(x,y){e}^{i{\phi
}_{{\rm{s}}}(x,y)}\), and the reference beam, \({\vec{E}}_{0{\rm{r}}}(x,y){e}^{i{\phi }_{{\rm{r}}}(x,y)}\), is given by:
$$I(x,y)={|{\vec{E}}_{0{\rm{s}}}(x,y)|}^{2}+{|{\vec{E}}_{0{\rm{r}}}(x,y)|}^{2}+2\,[{\vec{E}}_{0{\rm{s}}}(x,y).{\vec{E}}_{0{\rm{r}}}(x,y)]\,\cos [{\phi }_{{\rm{s}}}(x,y)-{\phi
}_{{\rm{r}}}(x,y)].$$ (2) where _E_0s and _ϕ_s represent the amplitude and phase of the sample beam, and _E_0r and _ϕ_r represent the amplitude and phase of the reference beam, respectively.
The phase difference, \({\phi }_{{\rm{s}}}-{\phi }_{{\rm{r}}}\), is directly related to the difference in optical path length between the two light waves, which allows for the measurement
of the reflective object’s height or the transmissive object’s thickness at any given point (_x_, _y_). The last two terms in the equation contain comprehensive information about the object
wave. During the reconstruction process, these terms give rise to a virtual image and a real image. However, the first two terms in the equation, known as the zero-order terms, introduce
noise into the final reconstructed images and must be eliminated as part of the reconstruction process38. Reconstruction of the holograms is achieved by illuminating them with a reference
laser beam. However, conventional holography has limitations such as the need for photographic development, additional reconstruction facilities, and difficulties in studying dynamic
samples. Digital holography overcomes these drawbacks by recording holograms directly onto a digital camera, eliminating the need for development processes39. Numerical reconstruction is
performed on a computer, simulating the illumination and diffraction of the holograms based on scalar diffraction theory. One notable application of digital holography is DHM, which
integrates with conventional microscopes to provide high-resolution, quantitative information about the phase structure of microscopic samples39,40. SAMPLE PREPARATION Blood smears were
obtained with written informed consent, following approval by the Institutional Review Board of the Institute for Advanced Studies in Basic Sciences, from a healthy subject and a subject who
had been tested positive for thalassemia minor. Following proper sterilization techniques, a finger-pricking device was used to create a small puncture on the side of the finger. A small
drop of the blood sample was carefully collected each time and placed near the edge of a clean glass slide. Another slide was positioned at an angle of less than 45 degrees against the first
slide, allowing the blood to naturally spread along the edge. The second slide was gently pushed forward along the first slide, ensuring a uniform and thin smear. To prevent clotting and
distortion of the cells, the smear was air-dried at room temperature for about 10 minutes, while avoiding exposure to heat sources and direct sunlight. Hence, thin blood smears were
successfully created on two separate glass slides red each time, and subsequently used for recording the holograms of nRBCs and tRBCs. Hence, each hologram is an exclusive representation of
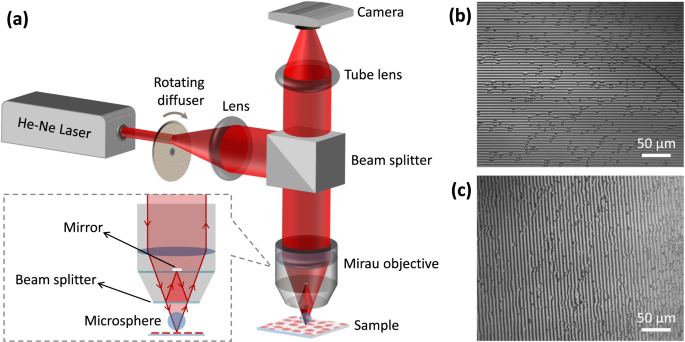
a single RBC, ensuring the uniqueness of our dataset. EXPERIMENTAL SETUP Our DHM setup is shown in Fig. 1a. A 2 mW He-Ne laser providing coherent light at 632.8 nm wavelength was used as the
light source. Passing the light through a rotating diffuser helped to reduce the speckle noise. The beam was collimated through a converging lens with a 10 cm focal distance and sent to a
Mirau interferometric objective (Nikon, NA = 0.3, 10×) through a cube beam splitter. Mirau objectives offer a compact and highly temporally stable geometry in reflection mode for
high-resolution phase imaging. In order to elevate the lateral resolution, a silica microsphere with 234 μm diameter and 1.46 index of refraction was placed within the working distance of
the objective lens. This was achieved by attaching the microsphere with an optical adhesive to the end of an optical fiber, which served as a lever. The fiber was then carefully inserted
through a micropipette tip to ensure stability. Subsequently, an x-y-z micropositioner was connected to the micropipette tip, enabling precise manipulation and positioning of the microsphere
over the specimen. The possibility to vary the microsphere’s size and position provides a large range of resolutions, magnification factors, and field of view (FoV), allowing one to opt for
a desired imaging property31,41. In MAM, it is critical that the feature of interest placed within the FoV of the microsphere. Several techniques such as self-assembly and
micro-manipulation have been proposed for microsphere positioning6. Connecting the sphere to the optical fiber allowed for convenient adjustment of the sphere’s position in our setup. In
bright-field MAM, image aberrations such as pincushion distortion have been reported42. In DHM, however, imaging aberrations due to the microsphere can be minimized through a reference
hologram as suggested in the literature43. The built-in plate beam splitter at the front aperture of the objective divided the incoming beam into two parts (see the inset of Fig. 1a). One
part was reflected back onto a small mirror within the objective, serving as the reference beam. The other part was transmitted through the beam splitter, passed through the microsphere, and
then focused onto the sample. Upon reflection from the sample, the diffracted wave containing high spatial frequencies was collected by the microsphere. The interfering beams traveled along
a common path and created an interference pattern at the sensor plane, which was achieved using a tube lens with a focal length of 16 cm. For recording the pattern as digital holograms, we
utilized a digital camera (DCC1545M, Thorlabs, 8-bit dynamic range, 5.2 μm pixel pitch). The digital holograms were saved as 8-bit images with a resolution of 1280 pixels by 1024 pixels in
the BMP format. Figure 1b,c show the full-frame holograms of the nRBCs and tRBCs, respectively, recorded prior to the insertion of a microsphere in the presented setup primarily aiming at
calibrating the system. The change in the direction of the interference fringes is due to an inadvertent rotation of the camera. Quantification of the achieved lateral resolution gain by the
microsphere is beyond the scope of this work. In principle, standard resolution tests such as USAF targets can be used as in conventional microscopy6. However, the proof-of-concept
experiment was already performed on a resolution test target and a standard grating, and the various adjustments and effective parameters on the imaging performance were investigated31. The
presented MS-assisted setup successfully revealed the structure of the grating with a period of 732 nm, which is beyond the resolution limit of a 10× Mirau objective with NA = 0.3 and
theoretically needs a minimum effective NA of 0.86 (NA = _λ_/_d_, where _λ_ = 632.8 nm is the wavelength of light and _d_ is the period of the grating). This is achieved by our rather large
MS for the present experiment, yet the setup has the potential to offer a wide range of improved resolution and magnification factors depending on the physical properties of the MS and its
vertical position between the sample and objective31. However, pursuing higher resolution and magnification levels may come at the cost of a limited FoV for the sample under study, which is
a trade-off similar to that observed in MAM6,44. Nanosphere-based approaches have also been mentioned to enhance the resolution and FoV45; however, their integration in DHM setups has not
been investigated. NUMERICAL RECONSTRUCTION PROCESS Various numerical methods have been proposed and developed for the reconstruction of the recorded digital holograms39,46. We used the
angular spectrum propagation approach (ASP)40,47, which is elucidated as follows. The reconstruction process involves obtaining the complex amplitude, encompassing both amplitude and phase
information. Specifically, the light wave at the hologram’s plane denoted as _E_s(_x_, _y_, _z_ = 0), is computed by numerically illuminating the recorded digital hologram with the reference
wave _E_r(_x_, _y_). The angular spectrum of _E_s(_x_, _y_, 0), corresponding to its Fourier transform, can be expressed as: $${\mathscr{F}}\{{E}_{{\rm{s}}}(x,y)\}={\mathop{E}\limits^{ \sim
}}_{{\rm{s}}}(\xi ,\eta )=\int {\int }_{-\infty }^{\infty }{E}_{{\rm{s}}}(x,y,0){e}^{-2\pi i(\xi x+\eta y)}dxdy.$$ (3) The variables _ξ_ and _η_ represent the spatial frequencies in the _x_
and _y_ directions, respectively. Within the Fourier domain, the spatial frequencies corresponding to the undiffracted beam and the virtual image undergo a filtering process. Subsequently,
the modified light wave is obtained by performing an inverse Fourier transform, yielding the following result: $${E}_{{\rm{s}}}^{{\rm{F}}}(x,y,0)={{\mathscr{F}}}^{-1}\{{\mathop{E}\limits^{
\sim }}_{{\rm{s}}}^{{\rm{F}}}(\xi ,\eta ,0)\}=\int {\int }_{-\infty }^{\infty }{\mathop{E}\limits^{ \sim }}_{{\rm{s}}}^{{\rm{F}}}(\xi ,\eta ,0){e}^{2\pi i(\xi x+\eta y)}d\xi d\eta ,$$ (4)
where \({\widetilde{E}}_{{\rm{s}}}^{{\rm{F}}}\) represents the filtered angular spectrum of _E_s. The complex amplitude at _z_ = _d_ is obtained by free-space propagation of
\({E}_{{\rm{s}}}^{{\rm{F}}}(x,y,0)\) over a distance _d_: $${E}_{{\rm{s}}}^{{\rm{F}}}(x,y,d)=\int {\int }_{-\infty }^{\infty }{\widetilde{E}}_{{\rm{s}}}^{{\rm{F}}}(\xi ,\eta
,0){e}^{ikd\sqrt{1-{\lambda }^{2}{\xi }^{2}-{\lambda }^{2}{\eta }^{2}}}{e}^{2\pi i(\xi x+\eta y)}d\xi d\eta .$$ (5) where _λ_ represents the wavelength of the light source. The entire
process can be summarized by the following equation: $${E}_{{\rm{s}}}^{{\rm{F}}}(x,y,d)={{\mathscr{F}}}^{-1}\{{[{\mathscr{F}}\{{E}_{{\rm{s}}}(x,y,0)\}]}^{{\rm{F}}}{e}^{ikd\sqrt{1-{\lambda
}^{2}{\xi }^{2}-{\lambda }^{2}{\eta }^{2}}}\}.$$ (6) The intensity of the object _I_s, and the phase of the object _ϕ_s, can be calculated from the complex amplitude as follows:
$${I}_{{\rm{s}}}(x,y,z)={\left|{E}_{{\rm{s}}}^{{\rm{F}}}(x,y,z)\right|}^{2},$$ (7) $${\phi }_{{\rm{s}}}(x,y,z)={\tan }^{-1}\frac{{\rm{\Im }}[{E}_{{\rm{s}}}^{{\rm{F}}}(x,y,z)]}{{\rm{\Re
}}[{E}_{{\rm{s}}}^{{\rm{F}}}(x,y,z)]}.$$ (8) Equation (7) produces microscopy-like intensity images. However, DHM goes a step further by enabling numerical refocusing at specific axial
planes, eliminating the need for mechanical adjustments in traditional microscopy. This non-invasive refocusing feature offers flexible and precise exploration of the object’s phase
structure without physically moving the microscope components. The phase map of the object is obtained through Eq. (8) by calculating the arctangent of the imaginary and real components of
the complex amplitude \({E}_{{\rm{s}}}^{{\rm{F}}}(x,y,z)\). However, this calculation results in a phase map with discontinuities due to its limited range of \([-\pi /2,\pi /2]\). To address
this issue, a phase unwrapping process is required to remove the phase ambiguities caused by the discontinuities. To this end, we used Goldstein’s branch-cut unwrapping algorithms48. By
unwrapping the phase maps, continuous and accurate phase maps of the samples can be obtained as: $${\phi }_{{\rm{s}}}(x,y)=\frac{2\pi }{\lambda }n{T}_{{\rm{s}}}(x,y),$$ (9) where _n_ is the
refractive index of the medium, and _T_s(_x_, _y_) is the thickness distribution of the sample. DATA RECORDS The data record has been deposited at figshare repository49. Digital holograms in
BMP format have been stored in two folders named “nRBC” and “tRBC” corresponding to the normal and thalassemic cases, respectively. TECHNICAL VALIDATION Typical microsphere-assisted DHM
images of an nRBC and tRBC along with the corresponding reconstruction procedures are summarized in Figs. 2, 3, respectively. Figures 2a, 3a show the recorded full-field holograms after
incorporating a 234 μm diameter microsphere into the DHM setup. The unfocused images of the microsphere attached to the fiber optics can be clearly seen in Figs. 2a, 3a. It is important to
note that the concentric rings surrounding the center of the microsphere are Newton ring artifacts and should not be mistaken for the RBCs. Figures 2b, 3b provide an enlarged view of the
region of interest (RoI) inside the rectangles shown in Figs. 2a, 3a,respectively, where the parallel interference fringes are prominently visible. These RoI digital holograms underwent
numerical reconstruction using the previously described ASP approach. In order to compensate for any potential contamination and aberrations of the optical train from the extracted data, we
considered reference conjugated hologram trick43. This was achieved by considering a cell-free region of the recorded holograms as a reference hologram. the associated reference holograms of
the RoI object holograms are shown in Figs. 2c, 3c. The object and reference holograms of each RBC were reconstructed individually, and by subtracting the background hologram phase from
them, the phase difference distribution _ϕ_RBC(_x_, _y_) was obtained, following Eq. 8. This subtraction process effectively cancels out the phase change introduced by the optical elements,
which remained constant throughout the exposures. Panels (h) in Figs. 2, 3 show the phase contrast images obtained through the phase subtraction, respectively. The associated reconstructed
thickness distribution computed through the Eq. 9 for the two types of RBCs are shown in panels (i-k) in Figs. 2, 3. USAGE NOTES The whole data can be downloaded from figshare repository.
The data can be used with a wide range of image processing software and packages such as MATLAB and Python among others. CODE AVAILABILITY The technical details of the reconstruction
algorithm used to generate phase images are described in detail in the Methods section, providing the necessary information for reproducibility of the phase reconstruction of the presented
dataset. REFERENCES * Morris, J. D. & Payne, C. K. Microscopy and cell biology: new methods and new questions. _Annual review of physical chemistry_ 70, 199–218 (2019). Article ADS CAS
PubMed Google Scholar * Tahara, T., Quan, X., Otani, R., Takaki, Y. & Matoba, O. Digital holography and its multidimensional imaging applications: a review. _Microscopy_ 67, 55–67
(2018). Article CAS PubMed PubMed Central Google Scholar * Anand, A., Moon, I. & Javidi, B. Automated disease identification with 3-d optical imaging: a medical diagnostic tool.
_Proceedings of the IEEE_ 105, 924–946 (2017). Article Google Scholar * Memmolo, P. _et al_. Differential diagnosis of hereditary anemias from a fraction of blood drop by digital
holography and hierarchical machine learning. _Biosensors and Bioelectronics_ 201, 113945 (2022). Article CAS PubMed Google Scholar * Darafsheh, A. & Abbasian, V. Dielectric
microspheres enhance microscopy resolution mainly due to increasing the effective numerical aperture. _Light: Science & Applications_ 12, 22 (2023). Article ADS CAS Google Scholar *
Darafsheh, A. Microsphere-assisted microscopy. _Journal of Applied Physics_ 131, 031102 (2022). Article ADS CAS Google Scholar * Mico, V., Zalevsky, Z., Garca-Martnez, P. & Garca, J.
Synthetic aperture superresolution with multiple off-axis holograms. _JOSA A_ 23, 3162–3170 (2006). Article ADS PubMed Google Scholar * Paturzo, M. & Ferraro, P. Correct
self-assembling of spatial frequencies in super-resolution synthetic aperture digital holography. _Optics letters_ 34, 3650–3652 (2009). Article ADS PubMed Google Scholar * Luk’yanchuk,
B. S., Paniagua-Domnguez, R., Minin, I., Minin, O. & Wang, Z. Refractive index less than two: photonic nanojets yesterday, today and tomorrow. _Optical Materials Express_ 7, 1820–1847
(2017). Article ADS Google Scholar * Trukhova, A., Pavlova, M., Sinitsyna, O. & Yaminsky, I. Microlens-assisted microscopy for biology and medicine. _Journal of Biophotonics_ 15,
e202200078 (2022). Article PubMed Google Scholar * Darafsheh, A. _Optical super-resolution and periodical focusing effects by dielectric microspheres_. Ph.D. thesis, The University of
North Carolina at Charlotte (2013). * Darafsheh, A., Limberopoulos, N. I., Derov, J. S., Walker, D. E. & Astratov, V. N. Advantages of microsphere-assisted super-resolution imaging
technique over solid immersion lens and confocal microscopies. _Applied Physics Letters_ 104 (2014). * Darafsheh, A., Guardiola, C., Palovcak, A., Finlay, J. C. & Cárabe, A. Optical
super-resolution imaging by high-index microspheres embedded in elastomers. _Optics Letters_ 40, 5–8 (2015). Article ADS PubMed Google Scholar * Yang, H., Moullan, N., Auwerx, J. &
Gijs, M. A. Super-resolution biological microscopy using virtual imaging by a microsphere nanoscope. _Small_ 10, 1712–1718 (2014). Article CAS PubMed Google Scholar * Tehrani, K. F.,
Darafsheh, A., Phang, S. & Mortensen, L. J. Resolution enhancement of 2-photon microscopy using high-refractive index microspheres. _Proceedings of SPIE_ 10498, 1049833 (2018). Google
Scholar * Kassamakov, I. _et al_. 3d super-resolution optical profiling using microsphere enhanced mirau interferometry. _Scientific reports_ 7, 3683 (2017). Article ADS PubMed PubMed
Central Google Scholar * Pahl, T., Hüser, L., Hagemeier, S. & Lehmann, P. Fem-based modeling of microsphere-enhanced interferometry. _Light: Advanced Manufacturing_ 3, 699–711 (2022).
Google Scholar * Abbasian, V. & Moradi, A.-R. Microsphere-assisted super-resolved mueller matrix microscopy. _Optics Letters_ 45, 4336–4339 (2020). Article ADS PubMed Google Scholar
* Abbasian, V., Rasouli, S. & Moradi, A.-R. Microsphere-assisted self-referencing digital holographic microscopy in transmission mode. _Journal of Optics_ 21, 045301 (2019). Article
ADS CAS Google Scholar * Abbasian, V., Darafsheh, A. & Moradi, A.-R. Simple high-resolution 3d microscopy by a dielectric microsphere: a proof of concept. _Opt. Lett._ 48, 6216–6219
(2023). Article ADS PubMed Google Scholar * O’Connor, T., Anand, A. & Javidi, B. Field-portable microsphere-assisted high resolution digital holographic microscopy in compact and
3d-printed mach-zehnder interferometer. _OSA Continuum_ 3, 1013–1020 (2020). Article Google Scholar * Keohane, E., Otto, C. N. & Walenga, J. _Rodak’s hematology-e-book: clinical
principles and applications_ (Elsevier Health Sciences, 2019). * Hoffman, R. _et al_. _Hematology: basic principles and practice_ (Elsevier Health Sciences, 2013). * Jaferzadeh, K. &
Moon, I. Quantitative investigation of red blood cell three-dimensional geometric and chemical changes in the storage lesion using digital holographic microscopy. _Journal of biomedical
optics_ 20, 111218–111218 (2015). Article ADS PubMed Google Scholar * Moon, I., Javidi, B., Yi, F., Boss, D. & Marquet, P. Automated statistical quantification of three-dimensional
morphology and mean corpuscular hemoglobin of multiple red blood cells. _Optics express_ 20, 10295–10309 (2012). Article ADS CAS PubMed Google Scholar * Yi, F., Moon, I. & Javidi,
B. Cell morphology-based classification of red blood cells using holographic imaging informatics. _Biomedical optics express_ 7, 2385–2399 (2016). Article PubMed PubMed Central Google
Scholar * Yi, F., Lee, C.-G. & Moon, I.-K. Statistical analysis of 3d volume of red blood cells with different shapes via digital holographic microscopy. _Journal of the Optical Society
of Korea_ 16, 115–120 (2012). Article Google Scholar * Anand, A., Chhaniwal, V., Patel, N. & Javidi, B. Automatic identification of malaria-infected rbc with digital holographic
microscopy using correlation algorithms. _IEEE Photonics Journal_ 4, 1456–1464 (2012). Article ADS Google Scholar * Abbasian, V., Akhlaghi, E. A., Charsooghi, M. A., Bazzar, M. &
Moradi, A.-R. Digital holographic microscopy for 3d surface characterization of polymeric nanocomposites. _Ultramicroscopy_ 185, 72–80 (2018). Article CAS PubMed Google Scholar *
Joglekar, M. _et al_. Imaging the effect of hemoglobin on properties of rbcs using common-path digital holographic microscope. In _European Conference on Biomedical Optics_, 104140W (Optica
Publishing Group, 2017). * Aakhte, M. _et al_. Microsphere-assisted super-resolved mirau digital holographic microscopy for cell identification. _Applied optics_ 56, D8–D13 (2017). Article
PubMed Google Scholar * Abbasian, V. _et al_. Super-resolved microsphere-assisted mirau digital holography by oblique illumination. _Journal of Optics_ 20, 065301 (2018). Article ADS
Google Scholar * O’Connor, T., Anand, A., Andemariam, B. & Javidi, B. Deep learning-based cell identification and disease diagnosis using spatio-temporal cellular dynamics in compact
digital holographic microscopy. _Biomedical Optics Express_ 11, 4491–4508 (2020). Article PubMed PubMed Central Google Scholar * Yi, F., Moon, I. & Javidi, B. Automated red blood
cells extraction from holographic images using fully convolutional neural networks. _Biomedical optics express_ 8, 4466–4479 (2017). Article PubMed PubMed Central Google Scholar *
O’Connor, T., Shen, J.-B., Liang, B. T. & Javidi, B. Digital holographic deep learning of red blood cells for field-portable, rapid covid-19 screening. _Optics Letters_ 46, 2344–2347
(2021). Article ADS PubMed Google Scholar * Gabor, D. A new microscopic principle. _Nature_ 161, 777–778 (1948). Article ADS CAS PubMed Google Scholar * Leith, E. N. &
Upatnieks, J. Reconstructed wavefronts and communication theory. _JOSA_ 52, 1123–1130 (1962). Article ADS Google Scholar * Hariharan, P. & Hariharan, P. _Optical Holography:
Principles, techniques and applications_ (Cambridge University Press, 1996). * Kim, M. K. & Kim, M. K. _Digital holographic microscopy_ (Springer, 2011). * Anand, A., Chhaniwal, V. K.
& Javidi, B. Real-time digital holographic microscopy for phase contrast 3d imaging of dynamic phenomena. _Journal of display technology_ 6, 500–505 (2010). Article ADS Google Scholar
* Darafsheh, A. Comment on ‘super-resolution microscopy by movable thin-films with embedded microspheres: Resolution analysis’[ann. phys.(berlin) 527, 513 (2015)]. _Annalen der Physik_
528, 898–900 (2016). Article ADS Google Scholar * Darafsheh, A., Walsh, G. F., Dal Negro, L. & Astratov, V. N. Optical super-resolution by high-index liquid-immersed microspheres.
_Applied Physics Letters_ 101 (2012). * Colomb, T. _et al_. Total aberrations compensation in digital holographic microscopy with a reference conjugated hologram. _Optics express_ 14,
4300–4306 (2006). Article ADS PubMed Google Scholar * Darafsheh, A. Photonic nanojets and their applications. _Journal of Physics: Photonics_ 3, 022001 (2021). ADS Google Scholar *
McLeod, E. _et al_. Tunable vapor-condensed nanolenses. _ACS nano_ 8, 7340–7349 (2014). Article CAS PubMed PubMed Central Google Scholar * Osten, W. _et al_. Recent advances in digital
holography. _Applied optics_ 53, G44–G63 (2014). Article PubMed Google Scholar * Goodman, J. W. _Introduction to Fourier optics_ (W. H. Freeman and Company, 2017). * Gutmann, B. &
Weber, H. Phase unwrapping with the branch-cut method: role of phase-field direction. _Applied optics_ 39, 4802–4816 (2000). Article ADS CAS PubMed Google Scholar * Abbasian, V. &
Darafsheh, A. A dataset of digital holograms of normal and thalassemic cells. _figshare_ https://doi.org/10.6084/m9.figshare.23549577.v2 (2023). Download references ACKNOWLEDGEMENTS V.A.
would like to thank Ehsan A. Akhlaghi, Ali-Reza Moradi, and Kenneth Hall for stimulating discussions. AUTHOR INFORMATION AUTHORS AND AFFILIATIONS * Department of Radiation Oncology,
Washington University School of Medicine in St. Louis, St. Louis, MO, 63110, USA Vahid Abbasian & Arash Darafsheh * Imaging Science Program, McKelvey School of Engineering, Washington
University in St. Louis, St. Louis, MO, 63130, USA Vahid Abbasian * Department of Physics, Institute for Advanced Studies in Basic Sciences (IASBS), Zanjan, 45137-66731, Iran Vahid Abbasian
Authors * Vahid Abbasian View author publications You can also search for this author inPubMed Google Scholar * Arash Darafsheh View author publications You can also search for this author
inPubMed Google Scholar CONTRIBUTIONS V.A. conducted the experiments and collected the data. Both authors discussed the results, wrote, and reviewed the manuscript. CORRESPONDING AUTHOR
Correspondence to Vahid Abbasian. ETHICS DECLARATIONS COMPETING INTERESTS The authors declare no competing interests. ADDITIONAL INFORMATION PUBLISHER’S NOTE Springer Nature remains neutral
with regard to jurisdictional claims in published maps and institutional affiliations. RIGHTS AND PERMISSIONS OPEN ACCESS This article is licensed under a Creative Commons Attribution 4.0
International License, which permits use, sharing, adaptation, distribution and reproduction in any medium or format, as long as you give appropriate credit to the original author(s) and the
source, provide a link to the Creative Commons licence, and indicate if changes were made. The images or other third party material in this article are included in the article’s Creative
Commons licence, unless indicated otherwise in a credit line to the material. If material is not included in the article’s Creative Commons licence and your intended use is not permitted by
statutory regulation or exceeds the permitted use, you will need to obtain permission directly from the copyright holder. To view a copy of this licence, visit
http://creativecommons.org/licenses/by/4.0/. Reprints and permissions ABOUT THIS ARTICLE CITE THIS ARTICLE Abbasian, V., Darafsheh, A. A dataset of digital holograms of normal and
thalassemic cells. _Sci Data_ 11, 3 (2024). https://doi.org/10.1038/s41597-023-02818-4 Download citation * Received: 17 August 2023 * Accepted: 04 December 2023 * Published: 02 January 2024
* DOI: https://doi.org/10.1038/s41597-023-02818-4 SHARE THIS ARTICLE Anyone you share the following link with will be able to read this content: Get shareable link Sorry, a shareable link is
not currently available for this article. Copy to clipboard Provided by the Springer Nature SharedIt content-sharing initiative