- Select a language for the TTS:
- UK English Female
- UK English Male
- US English Female
- US English Male
- Australian Female
- Australian Male
- Language selected: (auto detect) - EN
Play all audios:
ABSTRACT The SS18-SSX fusion drives oncogenic transformation in synovial sarcoma by bridging SS18, a member of the mSWI/SNF (BAF) complex, to Polycomb repressive complex 1 (PRC1) target
genes. Here we show that the ability of SS18-SSX to occupy H2AK119ub1-rich regions is an intrinsic property of its SSX C terminus, which can be exploited by fusion to transcriptional
regulators beyond SS18. Accordingly, SS18-SSX recruitment occurs in a manner that is independent of the core components and catalytic activity of BAF. Alternative SSX fusions are also
recruited to H2AK119ub1-rich chromatin and reproduce the expression signatures of SS18-SSX by engaging with transcriptional activators. Variant Polycomb repressive complex 1.1 (PRC1.1) acts
as the main depositor of H2AK119ub1 and is therefore required for SS18-SSX occupancy. Importantly, the SSX C terminus not only depends on H2AK119ub1 for localization, but also further
increases it by promoting PRC1.1 complex stability. Consequently, high H2AK119ub1 levels are a feature of murine and human synovial sarcomas. These results uncover a critical role for SSX-C
in mediating gene deregulation in synovial sarcoma by providing specificity to chromatin and further enabling oncofusion binding by enhancing PRC1.1 stability and H2AK119ub1 deposition.
SIMILAR CONTENT BEING VIEWED BY OTHERS THE NUCLEOSOME ACIDIC PATCH AND H2A UBIQUITINATION UNDERLIE MSWI/SNF RECRUITMENT IN SYNOVIAL SARCOMA Article Open access 03 August 2020 ASPSCR1-TFE3
REPROGRAMS TRANSCRIPTION BY ORGANIZING ENHANCER LOOPS AROUND HEXAMERIC VCP/P97 Article Open access 07 February 2024 CONDENSATE REMODELING REORGANIZES INNATE SS18 IN SYNOVIAL SARCOMAGENESIS
Article Open access 29 October 2024 MAIN Sarcomas are a group of cancers arising in soft tissues or bone that disproportionately affect children and young adults. Like other pediatric
cancers, many types of sarcoma display a low mutational burden and are driven by dominant fusion oncoproteins involving chromatin-associated regulators and transcription factors1. Synovial
sarcoma, one of the more common soft tissue tumors in young patients, is characterized by the in-frame fusion of the mammalian switch/sucrose nonfermentable (mSWI/SNF or BAF) chromatin
remodeling complex subunit SS18 to an SSX family member, whereby the last eight amino acids of SS18 are replaced by the C-terminal 78 amino acids of SSX1, SSX2 or, rarely, SSX4 (refs. 2,3).
Biochemical and proteomic studies have shown that SS18-SSX integration into BAF evicts the tumor suppressor subunit SMARCB1 (also known as BAF47 or hSNF5) from the complex via competition of
SSX with SMARCB1 for binding to the nucleosome acidic patch4,5,6. This led to the view that alteration of BAF composition is a crucial step in synovial sarcoma tumorigenesis4 We previously
showed that SS18-SSX1 co-occupies noncanonical PRC1.1 target sites7, and recent work has demonstrated that SSX displays a strong affinity for H2AK119ub1-modified nucleosomes, a mark
deposited by PRC1 (ref. 6). The Polycomb repressive system plays a crucial role in regulating gene expression in all eukaryotes. It consists of two protein complexes: PRC1 and PRC2. PRC1 is
composed of a catalytic core made up of RING finger proteins 1 and 2 (RING1A and RNF2/RING1B) plus one of six Polycomb group RING finger (PCGF) proteins, which monoubiquitylate histone H2A
at lysine 119 (H2AK119ub1). Noncanonical PRC1 complexes containing PCGF1/3/5/6 are responsible for the majority of H2AK119ub1 deposition and gene repression8,9,10. Polycomb domains are
formed by the subsequent recruitment of PRC2, which monomethylates, dimethylates and trimethylates histone H3 at lysine 27 (H3K27me1, H3K27me2 and H3K27me3, respectively), further recruiting
canonical PRC1 complexes containing PCGF2 or PCGF4 (refs. 11,12,13,14). The co-occupancy of Polycomb group proteins at specific chromatin sites results in the repression of key
developmental genes15. In synovial sarcoma, H2AK119ub1-modified nucleosomes provide an interface for SS18-SSX, resulting in the rewiring of an altered BAF complex to Polycomb targets,
leading to their aberrant activation and resulting in the oncogenic gene expression signatures characteristic of synovial sarcoma6,7,16,17. While disruption of normal BAF complex function is
central in synovial sarcoma, studies in mice have shown that SMARCB1 loss is not required for SS18-SSX-driven tumorigenesis, generating instead tumors with epithelioid sarcoma
features16,18. Moreover, the recent discovery of SSX fusions in synovial sarcoma with alternative activators, such as EWSR1 and MN1 (ref. 19), also raises questions about the requirement for
direct BAF complex deregulation for all synovial sarcomas, prompting further investigation into the characteristics of the SSX tail. Here, we demonstrate that the SSX C terminus is
responsible for the presence of SS18-SSX at its specific targets via an interaction with H2AK119ub1 independently of SS18 and BAF. We show that the new SSX fusions, EWSR1-SSX1 and MN1-SSX1,
share the same transcriptional signature as SS18-SSX1 and that their presence at H2AK119ub1-rich regions depends solely on SSX. While BAF complexes are critical in SS18-SSX-driven synovial
sarcomas, we show that EWSR1 and MN1 activate gene expression via a mechanism that can be independent of BAF presence. Therefore, a more general view of synovial sarcoma emerges in which
SSX-C serves as an anchor for recruitment and mislocalization of transcriptional activators to H2AK119ub1-rich chromatin domains. Furthermore, we uncover a feedback loop in which the SSX-C
binds to and enhances H2AK119ub1 by stabilizing PRC1.1 complex presence on chromatin. This results in acquisition of high H2AK119ub1 levels during synovial sarcoma tumorigenesis, enabling
further oncofusion binding and potentiating its oncogenic activity. RESULTS PRC1.1 CONTROLS GLOBAL H2AK119UB1 AND SS18-SSX OCCUPANCY We previously showed that SS18-SSX1 co-occupies
KDM2B/PRC1.1 target sites and that lysine demethylase 2B (KDM2B) suppression disrupts SS18-SSX chromatin occupancy, triggering proliferative arrest and a fibroblast-like morphology7.
However, the chromatin environments bound by SS18-SSX/PRC1.1 that are rich in H2AK119ub1 are also co-occupied by other chromatin regulators. Several variant PRC1 complexes can deposit
H2AK119ub1, which is recognized and bound by PRC2. This leads to H3K27me3 deposition, which in turn results in canonical PRC1 recruitment11,12,13,14. To dissect the hierarchy of SS18-SSX
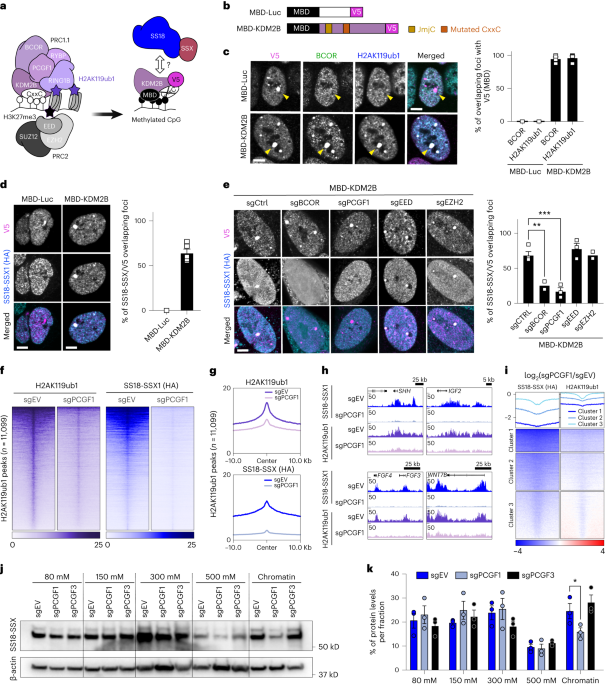
targeting at Polycomb sites, we first assessed whether KDM2B, which mediates the recruitment of PRC1.1 via its ZF-CxxC domain15,20,21, is sufficient to recruit SS18-SSX onto chromatin. To
this end, we took advantage of a previously described artificial targeting approach in which KDM2B is fused to the methyl binding domain (MBD) of methyl-CpG binding domain protein 1 (MBD1),
leading to its retargeting to regions of densely methylated DNA such as pericentromeric heterochromatin22,23 (Fig. 1a,b). Additionally, a critical residue in the ZF-CxxC DNA binding domain
of KDM2B (ref. 24) is mutated so that the MBD-fused protein can only bind methylated DNA (MBD-KDM2BK643A, referred to as MBD-KDM2B). MBD fused to luciferase (MBD-Luc) was used as control to
assess specific targeting (Fig. 1b). We first confirmed the correct tethering of the MBD-fused proteins to heterochromatin using immunofluorescence in a human synovial sarcoma cell line
(HS-SY-II) harboring endogenously hemagglutinin (HA)-tagged SS18-SSX1 (ref. 7). We observed a specific co-localization of the MBD constructs, marked by a V5 tag, to heterochromatin protein 1
(HP1) foci (Extended Data Fig. 1a). As expected, MBD-KDM2B, but not MBD-Luc, was able to recruit the PRC1.1 components BCL6 corepressor (BCOR) and PCGF1, resulting in H2AK119ub1 deposition
(Fig. 1c and Extended Data Fig. 1b). Most importantly, MBD-KDM2B was sufficient to recruit SS18-SSX1 (Fig. 1d). To dissect the requirement of PRC2 in PRC1.1-mediated SS18-SSX recruitment, we
knocked out components of both complexes using CRISPR–Cas9-directed mutagenesis25,26,27 (Extended Data Fig. 1c). Remarkably, depleting the PRC1.1 subunits BCOR or PCGF1, but not the PRC2
components embryonic ectoderm development (EED) or enhancer of zeste homolog 2 (EZH2), significantly reduced SS18-SSX1 recruitment and H2AK119ub1 deposition mediated by MBD-KDM2B (Fig. 1e
and Extended Data Fig. 1d). Moreover, here, MBD-KDM2B tethering did not lead to recruitment of PRC2 components nor H3K27me3 accumulation (Extended Data Fig. 1e,f), suggesting that SS18-SSX
recruitment is independent of PRC2 presence. Together, these results show that SS18-SSX1 targeting can be initiated by KDM2B, relies on an intact PRC1.1 complex, and is independent from PRC2
activity. While PRC1.1 is sufficient to initiate SS18-SSX recruitment, several PRC1 complexes can deposit H2AK119ub1. This raises the question of whether PRC1.1 inhibition alone is able to
deplete the mark in synovial sarcoma cells, resulting in the loss of SS18-SSX at its target sites. To assess the effect of PRC1.1 inactivation, we knocked out _PCGF1_ in HS-SY-II and SYO-1
cells (harboring _SS18-SSX1_ and _SS18-SSX2_ fusions, respectively) and used cleavage under targets and release using nuclease (CUT&RUN)28 to assess global changes in H2AK119ub1 and
SS18-SSX1/2 chromatin binding. _PCGF1_ knockout led to a global decrease in H2AK119ub1 deposition alongside a strong reduction in SS18-SSX1/2 chromatin occupancy in both cell lines,
illustrating the pivotal role of variant PRC1.1 in SS18-SSX chromatin maintenance (Fig. 1f–h and Extended Data Fig. 1g–i). To assure a fair comparison between experimental conditions, this
result was further verified using H2AK119ub1 calibrated chromatin immunoprecipitation (cChIP)29 in HS-SY-II (Fig. 1f–h). Moreover, sites exhibiting the highest depletion in SS18-SSX binding
due to _PCGF1_ knockout also exhibited the highest losses in H2AK119ub1, supporting a direct link between these two processes (Fig. 1i). To further assess if the effect of PRC1.1 is
specific, we depleted PCGF3, a member of PRC1.3 and a known dependency in synovial sarcoma (https://depmap.org/portal). As expected, removing either PCGF1 or PCGF3 drastically inhibited
synovial sarcoma cell proliferation (Extended Data Fig. 1j, k). We performed chromatin salt extraction in both HS-SY-II and SYO-I synovial sarcoma cell lines to compare the global action of
PCGF1 versus PCGF3 on SS18-SSX chromatin binding. Whereas removal of PCGF1 diminished SS18-SSX presence on chromatin, PCGF3 removal did not (Fig. 1j,k). Hence, although PCGF3 is essential
for synovial sarcoma maintenance, our results indicate that it is not required for SS18-SSX global chromatin binding, suggesting an alternative role for PRC1.3 in this context. Our data show
that PRC1.1 acts as the main depositor of H2AK119ub1 in synovial sarcoma cells and is therefore needed for SS18-SSX chromatin binding. SSX-C DETERMINES FUSION OCCUPANCY INDEPENDENTLY OF BAF
Previous studies suggest a model in which introduction of the SSX tail to the BAF complex via SS18 induces changes in complex composition and conformation, allowing its redistribution to
H2AK119ub1-rich genomic regions6. However, the SSX family of testis-specific proteins have additionally been shown to associate with various members of the Polycomb group complex30,31, and
SSX1 has recently been found to occasionally be fused to partners other than SS18 in synovial sarcoma patient samples19. This raises the question of whether the ability to bind Polycomb
target genes enriched in H2AK119ub1 is an intrinsic property of SSX proteins that can be exploited by fusion to other transcriptional regulators. To uncouple SS18 and SSX-dependent
activities, we started by mapping protein domains in SS18-SSX that are essential for tumor maintenance. We performed a CRISPR–Cas9 knockout screen using a gene-tiling single guide RNA
(sgRNA) library covering the entire SS18 and SSX1 coding sequences (Fig. 2a). In this assay, sgRNAs targeting DNA sequences coding for essential protein domains often result in a more
significant dropout, as even small in-frame insertion–deletion mutations (indels) in these regions are likely to affect protein function and cell fitness27,32. We screened for critical
SS18-SSX1 domains in HS-SY-II and used ProTiler to map CRISPR knockout hypersensitive (CKHS) regions33. In line with a key role for SS18-containing BAF complexes in these cells, sgRNAs
targeting SS18 were generally depleted, with the exception of those targeting a region that is not present in the shorter isoform of SS18 (amino acids 295–325). However, a clear CKHS region
was identified at the SSX C terminus corresponding to the highly conserved SSX repression domain (SSXRD)34,35 (Fig. 2b). These results suggest that this region, consisting of the last 34
amino acids of SS18-SSX1, is the most critical for its oncogenic function. To explore the intrinsic ability of the SSXRD in specific chromatin binding, we generated constructs containing
enhanced green fluorescent protein (eGFP) fused to the SSX1 C-terminal region present in SS18-SSX1, with or without an SSXRD deletion (SSX-CΔRD and SSX-C, respectively) or the SSXRD alone.
SS18 and SS18-SSX1 eGFP fusions were used as controls (Extended Data Fig. 2a). When expressed in the human embryonic kidney cell line HEK293T, eGFP-SS18 exhibited both nuclear and
cytoplasmic localization. In contrast, eGFP-SS18-SSX1 and SSX-C were exclusively detected in the nucleus in an SSXRD-dependent manner (Extended Data Fig. 2b). This supports the presence of a
nuclear localization signal in SSXRD (ref. 31) and a role in mediating chromatin interaction. Sequential salt extractions further showed that SSXRD-containing GFP fusions, but not
eGFP-SSX-CΔRD, are predominantly present in the chromatin fraction, confirming that the SSX1 C terminus strongly binds chromatin via this domain (Extended Data Fig. 2c, d). To identify
factors that contribute to SSX-C/SSXRD chromatin binding, we studied their common interactome through eGFP co-immunoprecipitation followed by mass spectrometry (Extended Data Fig. 2e and
Supplementary Table 1). Noticeably, histones were highly represented in both SSX-C and SSXRD top interactors, with higher enrichment than PRC1 or PRC2 components. These results indicate that
SSX-C alone can bind chromatin via a direct histone interaction, consistent with recent biochemistry studies that showed the ability of SS18-SSX to bind the nucleosome acidic patch, with a
preference for H2AK119ub1-modified nucleosomes conferred by the last five amino acids (EEDDE) of the SSXRD (refs. 6,35). Accordingly, a mutant lacking this region (SSX-CE184*) lost the
specific co-localization of SSX to H2AK119ub1-rich Barr bodies in HEK293T (Fig. 2c). We further confirmed the preferential interaction of SSX-C with H2AK119ub1-modified nucleosomes in live
cells using NanoBRET, a protein–protein interaction assay based on bioluminescence resonance energy transfer (BRET)36,37. We detected an interaction of the SSX-C (Halo-SSX-C) when
co-expressed with histone H2A fused to NanoLuc luciferase (NLuc-H2A) which was dependent on the SSXRD domain and was diminished in a mutant lacking the last five amino acids (SSX-CE184*).
Most importantly, expression of a mutant H2A that cannot be ubiquitinated (NLuc-H2AK118K119R)38 decreased the ability of SSX-C to interact with the nucleosome in vivo (Extended Data Fig. 2f,
g). These results confirm that H2AK119ub1 plays an active role in specifying the chromatin occupancy of SS18-SSX mediated by SSXRD, as previously described6. However, to understand if SSX-C
alone is sufficient to reproduce SS18-SSX binding patterns, we performed chromatin immunoprecipitation with high-throughput sequencing (ChIP–seq) of eGFP-SSX-C overexpression in HS-SY-II
cells. This revealed a clear overlap with previously identified SS18-SSX/KDM2B bound regions, which was abolished in the absence of the SSXRD domain (Fig. 2d). This result suggests that
SS18-SSX chromatin binding patterns are a consequence of SSX-C specificity regardless of the SS18 fusion partner. Notably, like SS18-SSX, SSX-C co-localizes at H2Aub-rich regions when
overexpressed in HEK293T, further indicating that SSX determines the fusion binding profile independently of SS18 (Fig. 2c). To uncouple SSX-C specificity from SS18-SSX-mediated BAF complex
deregulation, we compared SSX-C binding patterns in HS-SY-II sarcoma cells in the presence or absence of SS18-SSX via inducible short hairpin RNA (shRNA) knockdown (Extended Data Fig. 2h).
SSX-C chromatin binding at H2AK119ub-rich regions remained unchanged upon fusion knockdown (Fig. 2e), indicating that SSX-C specificity is independent of the presence of an altered BAF
complex. To further confirm this, we profiled SS18, SS18-SSX and SSX-C in an SS18-SSX-negative human osteosarcoma cell line (KHOS-240S). SS18 and SSX bound distinct chromatin regions, with
SS18-SSX overall occupancy correlating more strongly with that of SSX-C (Fig. 2f and Extended Data Fig. 2i). Moreover, removal of the BAF complex ATPases SMARCA2/4 and PBRM1 using the ACBI1
PROTAC degrader39,40 (Extended Data Fig. 2j) did not affect SS18-SSX localization at H2Aub-rich regions in HEK293T cells (Fig. 2g). Importantly, although ACBI1 treatment specifically
resulted in the depletion of SMARCA4 without affecting the levels of other BAF complex members (Extended Data Fig. 2j), it abolished the relocalization of BAF subunits SMARCC1 and ARID1A to
Barr bodies (Fig. 2g). These results are consistent with the modular assembly of BAF complexes where SS18 is recruited to the complex via its ATPase module5, and show that inhibition of the
catalytic activity of BAF in synovial sarcoma results in the loss of SS18-mediated BAF complex recruitment to H2Aub-rich regions. This was further confirmed using the MBD recruitment assay
in synovial sarcoma cells. Again, ACBI1 treatment abolished BAF complex recruitment as shown by the lack of the SMARCC1 core subunit at MBD-KDM2B foci. Still, de novo SS18-SSX recruitment to
these regions was unaffected by the absence of the BAF complex (Fig. 2h,i). Together, our results demonstrate that the SSX-C terminus, via its SSXRD, confers specificity to H2AK119ub1-rich
regions in the genome and mediates SS18-SSX binding independently of SS18 and the BAF complex. NOVEL SSX FUSIONS ACTIVATE A SYNOVIAL SARCOMA GENE SIGNATURE That SSX-C binding patterns remain
unchanged regardless of the presence of an altered BAF complex suggests that SSX-C specificity to H2AK119ub1-rich regions could be exploited by fusion to other partners. The recently
identified alternative SSX fusion partners that can replace SS18 in synovial sarcoma involve the transcriptional activators EWSR1 and MN1 (ref. 19). We sought to investigate if these
alternative partners can substitute the function of BAF in activating a synovial sarcoma gene signature. First, we expressed _EWSR1-SSX1_ and _MN1-SSX1_ in human mesenchymal stem cells
(hMSCs) alongside _SS18-SSX1_. For comparison, _EWSR1-FLI1_ (pathognomonic of Ewing sarcoma41) and _SS18-NEDD4_ (which has been found in one case described as a primary renal synovial
sarcoma, two cases of myxoid morphology and in an epithelioid sarcoma42,43) were also expressed in hMSCs (Fig. 3a). While EWSR1-FLI1 and SS18-NEDD4 led to distinct gene expression changes,
all SSX1-containing fusions clustered together and resulted in a specific upregulation of Polycomb target genes characteristic of a synovial sarcoma gene signature7 (Fig. 3b, c and
Supplementary Table 2). Accordingly, all SSX fusions retained the ability to localize to Barr bodies enriched in H2AK119ub1 as shown in HEK293T cells. The fusion partners on their own and
SS18-NEDD4 exhibited a diffuse nuclear pattern, further showing that specificity is conferred by the SSX1 tail regardless of its fusion partner (Fig. 3d). In line with previous studies
reporting an interaction of the BAF complexes with EWSR1 and MN1 (refs. 44,45), we observed that all SSX fusions resulted in rewiring of the BAF to Barr bodies (Fig. 3e). However, only
EWSR1-SSX1 and MN1-SSX1, but not SS18-SSX, led to the deposition of H3K27ac (Fig. 3e and Extended Data Fig. 3a), indicating that the new SSX fusions use alternative routes to deregulate
Polycomb target genes. Indeed, while all fusions were able to pull down SMARCC1, as well as TATA-binding protein (TBP), MN1-SSX specifically interacted with EP300 (Fig. 3f). This is in line
with previous studies demonstrating a synergistic effect of EP300 and MN1 as transcriptional co-activators46. Using more stringent chromatin shearing conditions for immunoprecipitation, we
observed a specific interaction of BAF complex subunits with SS18-SSX1, while EP300 and TBP immunoprecipitated with MN1-SSX and both EWSR1-SSX and MN1-SSX, respectively (Fig. 3g,h). Notably,
interaction of EWSR1-SSX or MN1-SSX1 with TBP was not affected by ACBI1 treatment (Fig. 3i). Recruitment of both fusions to Barr bodies or consequent H3K27ac deposition was also not
affected (Fig. 3j and Extended Data Fig. 3b). These results indicate that the deposition of H3K27ac by alternative SSX fusions is mediated by strong interactions with transcriptional
activators such as EP300 and TBP, but does not rely on BAF activity. Accordingly, gene activation by EWSR1-SSX1 or MN1-SSX1 was not affected by ACBI1 treatment (Extended Data Fig. 3c).
Together, our results show that the induction of Polycomb target genes that define a synovial sarcoma signature can be achieved by the recruitment of transcriptional co-activators as a
result of fusion of SSX-C to different partners. SSX-C REINFORCES H2AK119UB1 VIA INCREASED PRC1.1 STABILITY Consistent with a critical role for PRC1.1 in depositing H2AK119ub1 in synovial
sarcoma, its subunit BCOR is upregulated in synovial sarcoma tumor samples47,48. In fact, all SSX-containing fusions resulted in increased _BCOR_ expression, and indeed _BCOR_ is a direct
target of both SS18-SSX and SSX-C (Fig. 4a and Extended Data Fig. 4a). Reciprocally, in publicly available data, SS18-SSX knockdown in HS-SY-II (SS18-SSX1) and SYO-I (SS18-SSX2) synovial
sarcoma lines led to a concomitant decrease in _BCOR_ (ref. 16) (Extended Data Fig. 4b). This suggests an interplay between SSX fusions and PRC1.1 regulation. However, although inducible
_SS18-SSX_ knockdown readily affected the protein levels of several PRC1.1 members, it did not greatly affect the mRNA levels of all of them (Fig. 4b,c and Extended Data Fig. 4c), indicating
additional regulation at the protein level. Since SSX-C does not act as a transcriptional activator (Fig. 3b,c), but directly interacts with chromatin, we hypothesized that it could augment
PRC1.1 protein levels by increasing stabilization of the complex on chromatin. To assess this, we overexpressed eGFP-SSX-C in HS-SY-II, HEK293T and hMSC cellular contexts and measured its
effect on BCOR and H2A119ub1 levels. eGFP-SSX-C expression in synovial sarcoma cells led to higher BCOR and H2AK119ub1 levels in a manner that correlated with eGFP reporter levels. The same
was not observed when expressing an eGFP-only control or an SSX-C mutant lacking the SSXRD domain, where H2AK119ub1 or BCOR staining remains homogeneous regardless of the amount of construct
in the cell (Fig. 4d and Extended Data Fig. 4d, e). Similarly, SSX-C overexpression in mesenchymal stem cells recapitulated the increase in BCOR and H2AK119ub1 levels, and indeed all
SSX-containing fusions had the same effect (Fig. 4e,f and Extended Data Fig. 4f). Of note, overexpression of SSX-C alone did not induce _BCOR_ transcription, indicating that SSX fusions, via
their C-terminal tail, also regulate PRC1.1 at the protein level (Fig. 4a). Sequential chromatin washes in HEK293T cells and chromatin salt extractions in HS-SY-II cells showed that SSX-C
expression increases the presence of the PRC1.1 proteins BCOR and PCGF1 in the chromatin fraction while decreasing their presence in more soluble fractions (Fig. 4g and Extended Data Fig.
4g,h). These results show that SSX-C alone is able to increase total H2AK119ub1 levels in part by stabilizing PRC1.1 presence on chromatin. Notably, by increasing PRC1.1 stability and
H2AK119ub1 levels, SSX-C overexpression also affected SS18 levels, which serve as a proxy for SS18-SSX1 in synovial sarcoma cells (Fig. 4h). Again, SSX-C acts on the protein level, as it
does not bind the _SS18_ promoter or increase _SS18_ mRNA levels (Extended Data Fig. 4i, j). This indicates that in enhancing H2AK119ub1, SSX-C is also able to reinforce fusion binding.
Together, these results demonstrate that SSX fusions promote PRC1.1 activity via transcriptional and SSX-C-mediated mechanisms. Given that SSX-C alone has the ability to both recognize and
further induce H2AK119ub1, we reasoned that this could reflect a role of SSX proteins in their physiological context. To explore this, we investigated whether wild-type SSX1 levels are
associated with H2AK119ub1 in human testis where the SSX1 protein is normally expressed. Publicly available single-cell RNA sequencing data from human testis show that _SSX1_ is mainly
expressed in spermatogonial stem cells, differentiating spermatogonia and in early spermatocytes, but not in other testicular cell types (Extended Data Fig. 4k)49. Immunohistochemical
staining of human testis revealed that H2AK119ub1 levels are not homogeneous, but rather are particularly high in cells around the outer edge of the seminiferous tubules next to the basal
lamina that correspond to spermatogonia (inhibin-α-negative cells) where SSX1 is also specifically detected (Fig. 4i). These results suggest that the physiological role of SSX proteins is
also linked to PRC1 function. HIGH LEVELS OF H2AK119UB1 ARE A FEATURE OF SYNOVIAL SARCOMA The above in vitro results uncovered a link between SSX-C and PRC1.1 and suggest that high levels of
H2AK119ub1 are acquired during tumorigenesis to further enable SS18-SSX binding. To assess if the SS18-SSX oncoprotein promotes H2AK119ub1 in vivo, we took advantage of a synovial sarcoma
mouse model in which _SS18-SSX2_ expression is conditionally induced in _Hic1_-positive mesenchymal progenitors50,51 (Fig. 5a). Similar to our observations in cell culture, SS18-SSX-positive
tumor cells (marked by GFP) specifically exhibited high levels of H2AK119ub1 when compared with normal muscle (Extended Data Fig. 5a–c). Moreover, increased levels of H2AK119ub1 were
clearly detected at earlier time points following SS18-SSX induction, as early as 5 weeks after induction and with a steady increase that was concomitant with the time course of tumor
formation. Similarly, BCOR levels increased during this time course, again pointing to increased expression and stability of PRC1.1 in response to fusion expression (Fig. 5b–e). These
results indicate that SS18-SSX activation induces BCOR and H2AK119ub1 deposition early during murine tumorigenesis. Lastly, we reasoned that if this autoregulatory feedback loop has a role
in human sarcomagenesis, increased levels of H2AK119ub1 would be a feature of human synovial sarcomas. To test this, we performed H2AK119ub1 immunohistochemistry on a synovial sarcoma tissue
microarray of 37 patient samples. H2AK119ub1 exhibited stronger nuclear staining in synovial sarcomas than in other sarcomas and normal tissues, including skeletal muscle (Fig. 5f,g).
Consistent with an autoregulatory feedback loop in which SS18-SSX increases H2AK119ub1 to promote its own binding and stability, we observed a positive correlation between H2AK119ub1
staining and staining using SSX-specific or SS18-SSX-specifc antibodies (Extended Data Fig. 5d). These results show that SS18-SSX activity is also associated with enhanced H2AK119ub1 in
human synovial sarcoma and suggest an autoregulatory mechanism in which the oncofusion can potentiate its own chromatin binding and therefore its oncogenic activity. DISCUSSION Our study
addresses the molecular mechanism underlying SS18-SSX chromatin recruitment in synovial sarcoma. We confirm that H2AK119ub1 is important for SS18-SSX specific chromatin targeting6, and
further show that in synovial sarcoma, PRC1.1 is central in establishing H2AK119ub1 deposition and orchestrating oncofusion protein occupancy and maintenance, with PCGF1 removal leading to
global erosion in SS18-SSX binding. These results support a role for PRC1.1 as the main contributor of genome-wide H2AK119ub1 deposition as observed in mouse embryonic stem cells8, and
suggest that other variant PRC1 complexes may have alternative roles in synovial sarcoma. We demonstrate that the most critical domain of SS18-SSX1 for synovial sarcoma cell maintenance is
at the SSX-C terminus, where only 34 amino acids are sufficient to determine binding patterns of the oncofusion protein on chromatin. This highlights the critical role of the SSXRD domain in
the precise recruitment of SS18-SSX at specific synovial sarcoma gene targets. Indeed, the SSX1 tail alone can reproduce the genome-wide occupancy of SS18-SSX1 in an SSXRD-dependent manner,
and de novo oncofusion recruitment occurs independently of the BAF complex. This is consistent with the recent finding that some synovial sarcomas harbor translocations in which SSX is
fused not to SS18, but rather to alternative partners including EWSR1 and MN1 (ref. 19). Such occurrences support the notion that the SSXRD domain, by mediating recruitment of
transcriptional activators to induce Polycomb target genes during sarcomagenesis, is the key determinant of a synovial sarcoma signature, and that direct deregulation of the mSWI/SNF (BAF)
complex through SS18 is not essential to all synovial sarcomas. A limitation of our study is the use of ectopic expression of these new fusions for mechanistic studies, which may not
reproduce the physiological levels observed in tumors. Future work will be needed to generate patient-derived cell lines or murine models in which the molecular activity of these alternative
SSX fusions can be studied in more detail. Our data also reveal an interplay between SS18-SSX and PRC1.1 activity leading to a positive feedback loop that results in increased H2AK119ub1 in
murine and human synovial sarcomas. Two distinct mechanisms mediate this interplay. On one hand, SS18-SSX binds to and positively regulates the transcriptional level of PRC1.1 gene _BCOR_.
On the other hand, the SSX-C terminus induces an increase in H2AK119ub1 by stabilizing PRC1.1 complex protein levels and chromatin binding. In increasing H2AK119ub1 levels, SS18-SSX and
other SSX fusions are able to further promote the mark that they recognize, a process that will increase their presence on chromatin (Fig. 6). This model is in agreement with a previous
study showing that RYBP chromatin occupancy is increased by SS18-SSX expression in murine mesenchymal stem cells52. The feedback loop that we identify is also reminiscent of the role of RYBP
in the PRC1 complex, where it both promotes interactions within the complex leading to increased complex stability29 and recognizes and binds H2AK119ub1-modified nucleosomes to further
promote H2AK119ub1 deposition53. This work further highlights the central role that PRC1 activity, and its derivate H2AK119ub1 histone mark, plays in driving and sustaining synovial sarcoma
and supports inhibition of PRC1.1 as a potential therapeutic strategy. These findings are also important in light of a putative role for full-length wild-type SSX family proteins, which have
been reported to be expressed in synovial sarcomas3,54, in further promoting oncofusion protein activity. Moreover, SSX proteins are cancer-testis antigens that are abnormally present in
various cancers such as melanoma, breast cancer and prostate cancer55,56. Therefore, the interplay between SSX-C and H2AK119ub1 could affect a wider range of other malignancies. It remains
to be determined if H2AK119ub1 levels are increased in SSX-positive cancers and whether they play an oncogenic role. Our study describes a central role for PRC1.1-deposited H2AK119ub1 in
driving synovial sarcoma, thus highlighting a key role for this complex beyond cell fate decisions and development, which is further supported by the occurrence of main driving genetic
events involving _BCOR_ in several pediatric tumors57,58,59,60,61,62. Further studies will uncover the extent to which ‘PRC1-dependent’ tumors share molecular characteristics and circuitries
that could be exploited therapeutically. METHODS CELL CULTURE Human synovial sarcoma cell lines HS-SY-II (RRID: CVCL_8719)63 and SYO-1 (RRID: CVCL_7146)64 were obtained from their original
source laboratories. Human osteosarcoma KHOS-240S (RRID: CVCL_2544) and human embryonic kidney HEK293T (RRID: CVCL_0063) cell lines were purchased from the American Type Culture Collection
(ATCC). HEK293GP cells used for retrovirus production were obtained from Takara Bio (631458). Cells were cultured in DMEM (Gibco) supplemented with 10% fetal bovine serum (FBS) and
penicillin-streptomycin. The human telomerase reverse transcriptase (hTERT)-immortalized adipose-derived mesenchymal stem cell line ASC52telo was purchased from ATCC (SCRC-4000) and was
cultured in MesenPRO RS Medium (Gibco, 12746-012) supplemented with L-glutamine (Sigma-Aldrich, G7513-100ML) at a final concentration of 2 mM. The _Drosophila_ SG-4 cell line used for
calibrated ChIP was provided by A. Feldmann (DKFZ) and maintained in Schneider’s _Drosophila_ medium (Thermo Fisher Scientific, 21720024) supplemented with 10% FBS and
penicillin-streptomycin. The SMARCA2/SMARCA4 degrader ACBI1 was purchased from MedChemExpress (2375564-55-7), resuspended in dimethylsulfoxide (DMSO) and kept at −80 °C. Cells were treated
for 72 h with 500 nM ACBI1. PLASMID CLONING All constructs cloned in this study can be found in Supplementary Table 3. MBD-V5 constructs were cloned into pLV-EF1a-IRES-Neo (Addgene, 85139).
Luciferase was amplified by PCR from pT3-EF1a-NrasG12V-GFP-P2A-Luc2 (a gift from S.W. Lowe’s laboratory), KDM2B was amplified from pUC19-hKDM2B (Sino Biological, HG20918-U), and the ZF-CxxC
mutant was generated with PCR using mismatched primers (Q5). The MBD sequence was amplified using pENTR-MBD1 (ref. 65) (Addgene, 47057) as a template. The assembly was designed and performed
in a single step adding the MBD, complementary DNAs and V5-NLS using NEBuilder HiFi DNA Assembly. sgRNAs for CRISPR knockout were designed using the tool from Sanjana Lab
(http://guides.sanjanalab.org) and cloned as previously described27,66 (see Supplementary Table 4 for sgRNA sequences). In brief, sgRNAs were cloned by annealing two DNA oligos and ligating
into a BsmB1-digested pLKO1-puro-U6-sgRNA-eGFP. Transformation was carried into Stbl3 bacteria. For the SSX fusion vectors, cDNA of EWSR1, MN1 and NEDD4 were obtained from the DKFZ cDNA
clone repository and assembled with an HA tag at the amino terminus and SSX at the C terminus into a MSCV-PGK-Puro backbone in a single step using NEBuilder HiFi DNA Assembly (New England
Biolabs, E2621). EWSR1-FLI1 cDNA was a gift from T. Grünewald. eGFP-fused constructs were cloned into pLV-EF1a-IRES-Neo lentiviral backbone67 (Addgene, 85139) containing a neomycin selection
cassette. cDNAs were adapted from the MSCV-HA-PGK-Puro plasmids7. NanoBRET plasmids pHTN-HaloTag-CMV-neo (Promega, G7721) and pNLF1-N-CMV-Hygro (Promega, N1351) were obtained from Promega.
Histone H2A cDNAs were amplified by PCR from pCDNA3.1-Flag-H2A and pCDNA3.1-Flag-H2A K118-119R (ref. 38) (Addgene, 63560 and 63564). VIRUS PRODUCTION AND TRANSDUCTION For lentivirus
production, 1 × 10⁶ HEK293T cells were transfected with 3 μg of constructs and helper vectors (2.5 μg of psPAX2 and 0.9 μg of VSV-G). For retroviral infection, 10 × 106 HEK293GP cells
containing a gag-pol insertion were transduced with 20 μg of MSCV vectors and 2.5 μg of VSV-G. Transfection of packaging cells was performed using polyethyleneimine (Polysciences, 23966-2)
by mixing with DNA in a 3:1 ratio. Viral supernatants were collected 48 h after transfection, filtered through a 0.45-μm filter and supplemented with 4 μg ml−1 polybrene (Sigma) before
adding to target cells. Downstream experiments using sgRNAs for knockouts were performed 10 days after sgRNA induction (CUT&RUN) or 12 days after knockout (immunofluorecence). Downstream
experiments using overexpression of eGFP or MBD constructs (salt extraction, imaging, nuclear co-immunoprecipitation for mass spectrometry, and RNA sequencing (RNA-seq)) were performed 3–7
days after induction and will be specified for each technique. Downstream experiments using shSS18-SSX knockout were performed 3 days after doxycycline induction (CUT&RUN and western
blots). GENERATION OF CAS9 STABLE CELL LINES For stable expression, HS-SY-II and SYO-1 synovial sarcoma cell lines were transduced with lentiCas9-Blast (ref. 66) (Addgene, 52962) and
selected using 20 μg ml−1 blasticidin to generate stable Cas9-expressing cell lines. Cells were subsequently transduced with sgRNAs. After 3 days of infection, cells were selected with 2 µg
ml−1 puromycin. WHOLE CELL PROTEIN EXTRACTS AND WESTERN BLOTTING Cells grown in 6-well plates were collected and washed in PBS. Cell pellets were incubated with RIPA buffer (Cell Signaling
Technology) supplemented with protease inhibitors (Roche) for 30 min and cleared by centrifugation (15 min, >21,000_g_, 4 °C). Protein lysates were quantified using a BCA Protein Assay
(Pierce). Lysates were then denatured in 2x Laemmli at 95 °C for 5 min, then run in Mini-PROTEAN Precast Gels (Bio-Rad) and transferred onto membranes using Trans-Blot Turbo. Membranes then
were blocked in 5% milk in TBST. Western blots were visualized using an Amersham Imager 680. IMMUNOFLUORESCENCE STAINING Between 0.5 × 10⁶ and 1 × 10⁶ cells were seeded 6 days after
induction in 6-well plates containing coverslips. Cells were fixed the following day with 4% paraformaldehyde for 10 min. Permeabilization was performed using Triton X (0.1% in PBS) for 12
min, followed by incubation with blocking solution (1% BSA, 0.1% gelatin fish in PBS) for 1 h. Incubation with the primary antibody was performed in blocking buffer at room temperature
(20–22 °C) for 1 h. Cells were washed, incubated with secondary antibodies for 1 h, and mounted in VECTASHIELD Antifade Mounting Medium containing 4′,6-diamidino-2-phenylindole (DAPI; Vector
Laboratories). For four-color immunofluorescence using V5-555 antibody (Invitrogen), after the secondary antibody, cells were washed and incubated with V5-555 for 1 h prior to mounting.
Antibodies used are listed in Supplementary Table 5. IMAGE CAPTURE AND PROCESSING Confocal images were acquired on a Leica TCS SP5 inverted confocal microscope using an HCX PL APO
63x/1.40-0.60 Oil Lbd BL objective, and a single z-stack was captured. Samples were imaged using 405, 488, 561, 594 and 633 nm laser lines using sequential mode in the Leica Application
Suite software. For illustration, samples were imaged using a 512×512 format at a speed of 100 Hz using line averaging at 4 with a zoom factor of 11 for a single nucleus or 5 when showing
three or four nuclei. Images were then smoothed and adjusted for brightness and contrast using the ImageJ/Fiji software. MBD ASSAY QUANTIFICATION Images were acquired using a 512×512 format
at a speed of 700 Hz with a zoom factor of 1.7. Between 50 and 100 foci were counted per replicate, each MBD focus was selected, and only co-occurring foci were counted. CALIBRATED NATIVE
CHIP FOR H2AK119UB1 The protocol for calibrated ChIP sequencing was modified from ref. 8. In brief, human synovial sarcoma cell line HS-SY-II was used to determine the change in H2AK119ub1
status when _PCGF1_ was knocked out. The experiment was performed in biological triplicate. _Drosophila_ cell line SG-4 was used as the spike-in cell line. HS-SY-II cells were transduced
with either the empty vector plasmid or with sgRNA targeting the _PCGF1_ gene. The cells were cultured for 10 days, and then 10 × 106 cells were collected; 2 × 10⁶ SG-4 cells were mixed with
the collected cells. The cells were washed with ice-cold lysis buffer (10 mM Tris-HCl at pH 8, 10 mM NaCl, 3 mM MgCl2, 0.1% NP-40, 5 mM sodium butyrate, 5 mM _N_-ethylmaleimide) to extract
the nuclei. The nuclei were then digested using 100 U of MNase (Fermentas, EN0191) at 37 °C for 5 min in MNase digestion buffer (10 mM Tris-HCl at pH 8.0, 10 mM NaCl, 3 mM MgCl2, 0.1% NP-40,
0.25 M sucrose, 3 mM CaCl2, 10 mM sodium butyrate, 10 mM _N_-ethylmaleimide, 1× PIC (Roche)), followed by an addition of 4 mM EDTA to stop the digestion. All the buffers were supplemented
with protease inhibitor and NEM (inhibitor of deubiquitinase enzymes). After centrifugation, the supernatant was retained and incubated at 4 °C overnight with 5 μl of anti-H2AK119ub1 (Cell
Signaling Technology, D27C4). Next, 30 μl of Protein A/G Magnetic Beads (Thermo Fisher) were added for the pull down and incubated at 4 °C for 2 h. To elute the DNA, beads were incubated in
1% SDS, 0.1 M NaHCO3 at 24 °C for 30 min. DNA was purified using a ChIP DNA Clean & Concentrator kit (Zymo Research). CUT&RUN Chromatin profiles of endogenous SS18-SSX1/2, H2AK119ub1
in human synovial sarcoma cells and HA occupancy in osteosarcoma or synovial sarcoma cells expressing MSCV-HA-eGFP-SS18-PGK-Puro, MSCV-HA-eGFP-SS18-SSX1-PGK-Puro and
MSCV-HA-eGFP-SSX-C-PGK-Puro were assayed using a CUTANA ChIC/CUT&RUN Kit (EpiCypher, 14-1048) following the manufacturer’s protocol. In brief, 1 million cells (HS-SY-II, SYO-I or
KHOS-240S) were collected per sample and bound to activated Concanavalin A Magnetic Beads. Beads were then incubated at 4 °C overnight with 1:50 dilution of antibodies per sample. Chromatin
digestion was performed at 4 °C for 2 h. Digestion was then stopped by chelating Ca2+ ions in a buffer containing _Escherichia coli_ DNA for spike-in. DNA fragments were then released in
solution after incubation at 37 °C for 10 min on a ThermoMixer at 500 r.p.m. DNA fragments were then purified using a CUTANA DNA Purification Kit (EpiCypher). CROSSLINKED CHIP Chromatin
occupancy of HS-SY-II cells expressing MSCV-HA-eGFP-PGK-Puro, MSCV-HA-eGFP-SSX-C-PGK-Puro or MSCV-HA-eGFP-SSX-CΔRD-PGK-Puro was performed following selection with 2 µg ml−1 puromycin and
collected 6 days following transduction. HS-SY-II cells were prefixed for 20 min with 1.5 mM ethylene glycol bis(succinimidyl succinate) (Thermo Scientific) and then fixed with 1%
formaldehyde for 15 min; the crosslinking reaction was stopped by adding 125 mM glycine. Cells were washed twice with cold PBS and lysed in swelling buffer (150 mM NaCl, 1% v/v Nonidet P-40,
0.5% w/v deoxycholate, 0.1% w/v SDS, 50 mM Tris pH 8, 5 mM EDTA) supplemented with protease inhibitors. Cell lysates were sonicated using a Covaris E220 sonicator to generate fragments less
than 400 base pairs (bp). Sonicated lysates were centrifuged and incubated at 4 °C overnight with HA tag (Abcam, 9110). Immunocomplexes were recovered by incubation with 30 μl of Protein
A/G Magnetic Beads at 4 °C for 2 h. Beads were sequentially washed twice with RIPA buffer and finally TE buffer. LIBRARY PREPARATION DNA fragments obtained after ChIP or CUT&RUN were
quantified using a Qubit dsDNA HS Assay Kit (Invitrogen). Five nanograms of DNA were used for library preparation using a NEBNext Ultra II DNA Library Prep Kit for Illumina (New England
Biolabs, E7645S), SPRIselect beads (Beckman Coulter, B23317) and NEBNext Multiplex Oligos for Illumina (New England Biolabs, Set 1 E7335S and Set 2 E7500S). ChIP libraries were prepared
following New England Biolab’s guidelines (New England Biolabs, E7645S), and CUT&RUN libraries were prepared following the CUTANA ChIC/CUT&RUN Kit adapted protocol. Both libraries
were done without size selection with an input of 5 ng. ChIP libraries were sequenced as 75 bp single-read on an Illumina NextSeq 550 platform on High-Output. SS18-SSX and H2AK119ub1
CUT&RUN libraries were sequenced as 75 bp paired-end reads on the Illumina NextSeq 550 platform on Mid-Output. HA-eGFP-SS18, HA-eGFP-SS18-SSX1 and HA-eGFP-SSX-C CUT&RUN libraries and
native H2AK119ub1 calibrated ChIP were sequenced as 50 bp paired-end reads on a NovaSeq 6000 SP. CALIBRATED NATIVE H2AK119UB1 CHIP ANALYSIS Sequenced reads were mapped using Bowtie 2 to the
human genome build T2T-CHM13 using options–local–very-sensitive-local, and to the dm6 genome (_Drosophila_). PCR duplicates were removed using the Rmdup tool. Downsampling of reads for each
sample was done based on the formula from ref. 8: $$\begin{array}{l}{\rm{Downsampling}}\,{\rm{factor}}:\,\alpha \times 1/N({{\mathrm{ChIP}}}\,{{\mathrm{SpikeIn}}}) \\ \times
N({{\mathrm{Input}}}\,{{\mathrm{SpikeIn}}})/N({{\mathrm{Input}}}\,{{\mathrm{HSSY}}})\,\end{array}$$ where _α_ is a coefficient applied for all of the files normalized together so that the
value of the largest downsampling factor equals 1. _N_(ChIP SpikeIn) is the total number of reads aligned to the dm6 in the immunoprecipitation sample; _N_(Input SpikeIn) is the total number
of reads aligned to dm6 in the corresponding Input; _N_(Input HSSY) is the total number of reads aligned to the T2T genome in the corresponding Input sample. The downsampled replicates were
then combined using the pileup function from MACS2 (_q_-value, 0.05), and bigWig files were generated with the ucsc-wigtobigwig tool. Data are shown in Fig. 1. CUT&RUN ANALYSIS
Paired-end reads were aligned to the newly released human genome build T2T-CHM13 and _E. coli_ K12, MG1655 reference genome using Bowtie 2 (with options for T2T-CHM13:
–local–very-sensitive-local–no-unal–no-mixed–no-discordant–phred33 -I 10 -X 700; and for K12: –end-to-end–very-sensitive–no-overlap–no-dovetail–no-mixed–no-discordant–phred33 -I 10 -X 700).
To internally calibrate our CUT&RUN experiments, we used the exogenous _E. coli_ genome to quantitatively compare the genomic profiles as previously described68. We first calculated the
percentage of spike-in reads in total reads that aligned uniquely (_N__x_). We then normalized the samples using a scaling factor so that the _E. coli_ spike-in signal was set to be equal
across all samples. We used the sample displaying the smallest percentage of _E. coli_ reads (_N_min) to downscale all other conditions using the same constant to calculate our scaling
factor: $${\rm{Scaling}}\,{\rm{factor}}\,{\rm{for}}\,{\rm{sample}}\,{x}=N_{\min} /{N_{x}}$$ Genome coverage files were generated using bamCoverage69 with 50 bp bins, no normalization and
scaled (–scaleFactor). For H2AK119ub1 (_n_ = 11,099) and SS18-SSX2 (_n_ = 27,686) peak calling, the MACS2 callpeak function was used on the aligned BAM files and IgG was used as control
(with ‘–nomodel,’ ‘–qvalue 0.01,’ ‘–broad’ options, ‘–keep-dup all’). For HA peak calling in KHOS-240S, HA-SS18, HA-SS18-SSX1 and HA-eGFP-SSX1 were combined in MACS2 to compute all of the HA
peaks (_n_ = 58,843). A heatmap of Spearman correlation coefficients was generated using deepTools multiBigwigSummary and plotCorrelation69. H2AK119ub1 CUT&RUN is shown in Extended Data
Fig. 1. CHIP–SEQ ANALYSIS SS18-SSX1 (HA) input (SRR6451607), SS18-SSX1 (HA) immunoprecipitation (SRR6451595), KDM2B input (SRR6451587) and KDM2B immunoprecipitation (SRR6451586) were
obtained from the Gene Expression Omnibus (GEO) under accession number GSE108926. Raw reads were trimmed for quality and Illumina adapter sequences using trim-galore, then aligned to the
human genome assembly hg38 using Bowtie 2 (refs. 70,71) (with the ‘–very-sensitive’ option). ChIP signals were normalized to their respective inputs using the pileup function from MACS2
(refs. 72,73) using corresponding input for background normalization. To visualize ChIP–seq tracks, normalized bigWig files were generated with the ucsc-wigtobigwig tool. HA-SS18-SSX1 peaks
(_n_ = 26,805) were generated with the MACS2 function (with ‘–nomodel,’ ‘–qvalue 0.05,’ ‘–broad’ options) and normalized to input. CHIP AND CUT&RUN DATA VISUALIZATION Genome tracks were
visualized using UCSC Genome Browser (https://genome.ucsc.edu). For heatmaps and metaplot profiles, read densities of the various immunoprecipitations were centered around peak signals with
a ±10-kilobase (kb) window from peak center and binned with 50 bp using the computeMatrix and plotProfile/plotHeatmap functions from deepTools (ref. 69). TRACKING OF INDELS BY DECOMPOSITION
(TIDE) ANALYSIS Genomic DNA was extracted from Cas9 infected cells expressing sgRNA and parental cells using a DNeasy Blood & Tissue Kit (QIAGEN) following the manufacturer’s protocol.
The region targeted with sgRNA was amplified using the relevant primers (Supplementary Table 4) and purified using a PCR purification kit (QIAGEN). Following Sanger sequencing of the PCR
amplicons, sequences were analyzed using the TIDE website (http://shinyapps.datacurators.nl/tide) to calculate the percentage of insertions and deletions and assess sgRNA efficiency74. CELL
COMPETITION ASSAYS HS-SY-II and KHOS-240S Cas9 cells were transduced with an empty plasmid (empty vector) or a plasmid containing sgRNA targeting _PCGF1_. Infections were done with a virus
dilution of 1:10 to obtain an infection efficiency of around 70–80%. Infected cells become GFP+ due to the backbone of the sgRNA. The cells were then cultured over a period of 25 days, and
the percentage of GFP+ cells was measured using a Fortessa fluorescence-activated cell sorting (FACS) machine. Data were analyzed using FlowJo software. CHROMATIN SALT EXTRACTION AND
SEQUENTIAL CHROMATIN WASHES Chromatin salt extraction was adapted from ref. 75. Approximately 10 × 106 cells were collected and washed twice in PBS. Cell pellets were then washed in a series
of chromatin salt extraction buffers containing 0.1% Triton X, 300 mM sucrose, 1 mM MgCl2, 1 mM EGTA, 10 mM PIPES and NaCl at increasing concentrations: 80 mM, 150 mM, 300 mM and 500 mM.
All buffers were supplemented with protease inhibitors (Protease Inhibitor Tablets, Roche). Cell pellets were resuspended and incubated in 50 μl of chromatin salt extraction buffer at room
temperature for 10 min and pelleted at 2,000 × _g_ for 5 min. The supernatant was transferred to a new tube and supplemented with 2x Laemmli (Invitrogen) and kept on ice after denaturation
at 95 °C for 5 min. For the chromatin extraction after the last 500 mM wash, pellets were resuspended in 500 mM NaCl chromatin salt extraction buffer supplemented with 2x Laemmli. The
chromatin sample was then denatured at 95 °C for 5 min and sonicated. Chromatin samples were then centrifuged at full speed for 5 min to get rid of the DNA debris and transferred to a new
tube. Sequential chromatin washes were performed similarly, but the cells and the chromatin were washed at a constant salt concentration of 150 mM for four washes; the chromatin fraction was
then sonicated as above. Samples were then used for western blotting. The signal intensity in the various salt fractions was measured using the maximum intensity of a square containing the
band in the ImageJ/Fiji software. The total protein level was calculated using the sum of the maximum intensity as a proxy. Each intensity or salt fraction was then represented as a
percentage of total protein levels. CRISPR–CAS9 GENE-TILING SCREEN sgRNA library cloning and screen deconvolution were performed as previously described76,77. In brief, sgRNAs targeting the
entire coding sequence of SS18 and SSX1 were designed using Benchling (https://benchling.com) and cloned into pLKO-U6-sgRNA-improved-EF1s-GFP-P2A (gifted by D.F. Tschaharganeh). A total of
211 sgRNAs were designed spanning the length of isoform 1 of SS18 (NT 010966), and 90 sgRNAs targeting isoform 1 of SSX1 (NT 011568). Additionally, 200 safe sgRNAs were added as negative
controls; these guides target the nongenic region of genome78. Stable Cas9-expressing cell lines were transduced to about 30% efficiency. After 3 days of infection, cells were selected with
2 µg ml−1 puromycin. Cells were passaged with the number of cells kept at 3,000 times the size of the library, that is, at least 1.56 × 10⁶ cells were passaged. After 15 population
doublings, the cells were collected and their genomic DNA was extracted using the phenol extraction method. The region spanning the sgRNA was amplified using custom primers. Amplicons were
sent for next generation sequencing using NextSeq 550 SR 75 HO. Files were demultiplexed, and counts were mapped on the library using the MAGeCK tool. To identify individual regions that are
more important for cell survival, we used ProTiler to identify CKHS regions. LIVE IMAGING Approximately 30,000 HEK293T cells transduced with the various eGFP constructs were seeded in an
8-well chamber slide (µ-Slide 8 Well high, ibidi). Cells were then imaged within the next 48 h using the Leica TCS SP5 inverted confocal microscope with the HCX PL APO 63x/1.40-0.60 Oil Lbd
BL objective; a single z-stack was captured. DNA was stained 30 min prior to image acquisition using NucBlue Live ReadyProbes Reagent (Hoechst 33342) (Invitrogen). NUCLEAR
IMMUNOPRECIPITATION Approximately 5 × 10⁷ cells were collected and washed twice in PBS. Nuclei isolation, nuclear fraction digestion and collection were performed using a Nuclear Complex
Co-IP Kit (Active Motif, 54001). For classical immunoprecipitation and immunoprecipitation submitted to mass spectrometry analysis, chromatin shearing was performed on ice for 90 min. For
harsher conditions used in Fig. 3, chromatin shearing was performed at 37 °C for 10 min. Twenty-five microliters per immunoprecipitation of GFP-Trap Magnetic Agarose beads (ChromoTek) were
washed twice in 1X IP Low Buffer supplemented with protease inhibitor and PMSF following the manufacturer’s guidelines (Active Motif, 37511). Two hundred microliters of nuclear extracts were
incubated with the GFP-Trap beads at 4 °C for 1 h. Beads were then washed three times in 1X IP Low Buffer and resuspended in 50 µl of 2x Laemmli, then boiled at 95 °C for 10 min. MASS
SPECTROMETRY Following the final wash of nuclear immunoprecipitation, beads were resuspended in 100 µl of 1% SDS. Beads were denatured at 95 °C for 5 min, and the supernatant was submitted
for mass spectrometry at the EMBL Proteomics Core Facility. Data analysis was performed by the Facility. The raw output files of IsobarQuant (protein.txt – files) were processed using the R
programming language. Only proteins that were quantified with at least two unique peptides were considered for the analysis. Raw signal-sums (signal_sum columns) were first cleaned for batch
effects using limma (ref. 79) and further normalized using variance stabilization normalization80. Different normalization coefficients were estimated for control conditions in order to
maintain the lower observed abundance. HISTONE ACID EXTRACTION Approximately 1 × 10⁶ cells were collected and washed twice in PBS. Cells were resuspended in 100 µl of PBS + 0.5% Triton X and
incubated on ice for 10 min. After centrifugation at 6,500_g_ at 4 °C for 10 min, nuclei were washed a second time in 100 µl of PBS + 0.5% Triton X. Nuclear pellets were then resuspended in
25 µl of 0.2 N HCl. Histones were released overnight at 4 °C, and DNA debris was pelleted at 6,500 × _g_ at 4 °C for 10 min. Histone acid extracts were neutralized with 2.5 µl of 2 M NaOH.
After 2x Laemmli addition and denaturation at 95 °C for 5 min, samples were loaded onto a western blot gel. NANOBRET NanoBRET Protein:Protein Interaction assay was performed following the
manufacturer’s conditions (Promega, N1662). Approximately 0.5×10⁶ HEK293T cells were plated the day before transfection in a 12-well plate. Two micrograms of HaloTag plasmid (empty, SS18,
SS18-SSX, SSX-C, SSX-CΔRD or SSX-CE184*) + 0.2 µg of NanoLuc plasmid (H2A WT, H2AK118K119R) were transfected using polyethylenimine by mixing with DNA in a 3:1 ratio. Forty-eight hours after
transfection, cells were counted and adjusted to a final concentration 2 × 10⁶ cells per ml. Cells were passed in a 96-well white plate. For each condition, 10 µl (20,000 cells) were seeded
in four different wells. Each well was supplemented with 90 µl of Opti-MEM I Reduced Serum Medium, no phenol red (Gibco, 11058-021) containing 4% FBS with either 100 nM HaloTag NanoBRET 618
Ligand (+ligand, experimental samples in two technical replicates) or 0.1% DMSO final concentration (–ligand, no-acceptor controls in two technical replicates). The next day, 72 h after
transfection, 25 µl of 5x NanoBRET Nano-Glo in Opti-MEM I Reduced Serum Medium was added on all of the wells. Measurements of NanoBRET bioluminescent donor emission (460 nm) and acceptor
emission (618 nm) were performed within 10 min of substrate addition using a PHERAstar Microplate Reader (BMG Labtech) with 450 nm and 620 nm filters. NanoBRET calculations were done using
the followings steps. The raw NanoBRET ratio (BU) was obtained by dividing the acceptor emission value (620 nm) by the donor emission value (450 nm) for each sample. BU values were then
converted to milliBRET units (mBU) by multiplying each raw BRET value by 1,000. The final BRET ratio (mBU) displayed in the figures is calculated for each biological replicate by subtracting
the mean of the two experimental replicates (+ligand) with the mean of the two no-ligand control replicates (−ligand). RNA EXTRACTION AND QPCR RNA was prepared using an RNeasy Mini Kit
(QIAGEN) according to the manufacturer’s protocol and including the DNase I (QIAGEN) treatment. cDNA was synthesized from purified RNA with RevertAid Reverse Transcriptase (Thermo
Scientific) primed with random hexamers. qPCR was carried on the Roche LightCycler 480 Real-Time PCR System using Power SYBR Green PCR Master Mix (Applied Biosystems). The real-time thermal
cycler was programmed as follows: 15 min Hotstart; 44 PCR cycles (95 °C for 15 s, 55 °C for 30 s, 72 °C for 30 s). Primers are listed in Supplementary Table 4. RNA-SEQ ANALYSIS RNA libraries
were prepared at the DKFZ Genomics and Proteomics Core Facility and was sequenced on a NovaSeq 6000 Paired-End 100 S4. RNA-seq reads were aligned to the human genome assembly hg19, and a
fragments per kilobase million (FPKM) count matrix was generated using featureCounts (ref. 81). Data analysis of replicate clustering (principal component analysis), heatmaps of the 5,000
most variable genes, and differential expression analysis were performed using iDEP (http://bioinformatics.sdstate.edu/idep93)82. EGFP-BASED IMAGING QUANTIFICATION OF PROTEIN LEVELS To
directly compare the staining signal of H2AK119ub1, BCOR or SS18, we took advantage of the eGFP reporter as a proxy for construct expression (Extended Data Fig. 6). We used side-by-side
comparison using GFP-negative (or very low expressing cells) versus GFP-positive cells. The calculation was done using ImageJ/Fiji software by first isolating the nuclei using Li
thresholding on their DAPI signal and region of interest selection. Next, we measured the signal intensity for each channel: DAPI (405 nm), eGFP (488 nm), and either red channel (594 nm)
and/or far read (647 nm) when applicable and kept the mean. Then, for each nucleus, the signal intensities were normalized to DAPI, which should be constant across different nuclei.
eGFP-high and eGFP-low (or negative) cell populations were distinguished based on a threshold of normalized eGFP (488 nm) intensity of >1 or <1, respectively. Finally, the ratio of the
high versus low was used to display the change in signal intensity in the high-eGFP population (average of the corrected mean intensity for high eGFP / average of the corrected mean
intensity for low eGFP). For each biological replicate, between 50 and 250 nuclei were analyzed. HUMAN TESTIS IMMUNOHISTOCHEMICAL IMAGING For immunohistochemical analyses, formalin-fixed and
paraffin-embedded tissue samples of non-neoplastic human testis were retrieved from the archives of the Institute of Pathology, University Hospital Heidelberg. Use of patient samples was
approved by the ethics committee of the University of Heidelberg (S-442/2020). Sections of 4-μm thickness were cut and mounted on SuperFrost Plus Adhesion Slides (Thermo Scientific),
followed by deparaffinization and heat-induced antigen retrieval (97 °C) in high pH buffer (pH 9) for 30 min. Primary monoclonal mouse antibodies for inhibin-α (ready-to-use, clone R1, Dako
Omnis, Agilent), SSX (dilution 1:100) and H2A119ub1 (dilution 1:500) listed in Supplementary Table 5 were each incubated for 25 min. Visualization was performed using the ready-to-use
POLYVIEW PLUS HRP (anti-mouse) reagent (Enzo Life Sciences). Sections were counterstained with hematoxylin. HUMAN SINGLE CELL TESTIS ATLAS t-distributed stochastic neighbor embedding (t-SNE)
plots were obtained from the Human Testis Atlas Browser by Cairns Lab83 (https://humantestisatlas.shinyapps.io/humantestisatlas1/). Data were acquired on young adults aged 17, 24 and 25
years. MOUSE MODEL FOR CONDITIONAL SS18-SSX2 EXPRESSION The mouse model of synovial sarcoma used herein is based on the hSS2 model with a conditional SS18-IRES-eGFP allele knocked into the
Rosa26 locus in a C57BL/6J background50,51. Mice were housed under standard conditions (12 h/12 h light/dark cycle) and provided food and water ad libitum. Animals were maintained in a
controlled environment of 21–24 °C and 40–60% humidity, and experimental protocols were conducted in accordance with approved and ethical treatment standards of the Animal Care Committee at
the University of British Columbia. TISSUE PROCESSING AND STAINING To enable detection of native eGFP expression in processed tissue samples, mice at clinical endpoint were humanely
euthanized by intraperitoneal injection of Avertin (400 mg per kg (body weight)), and the tongues (containing tumor) were removed. Wild-type tongue samples were obtained from age-matched
Cre-negative control animals. Dissected tongues were immersed in 2% paraformaldehyde fixative at 4 °C for 48 h. Samples were then washed three times for 30 min each in PBS and then immersed
through a gradient of sucrose solutions from 10% to 50% at 4 °C for >4 h each before being embedded in cryomolds (Polysciences, 18646A) using OCT (Sakura Finetek, 4583) and frozen in an
isopentane bath cooled by liquid nitrogen. Cryosections were cut (Leica, CM3050S) at a thickness of 20 μm and mounted onto Superfrost Plus slides (VWR, 48311-703). Slides were thawed at 37
°C for 30 min, washed three times for 10 min each in PBS and incubated for 1 h in PBS containing 10 mg ml−1 sodium borohydride (Sigma, 213462) to quench autofluorescence. Following this
treatment, slides were briefly washed with PBS and incubated in block solution containing 2.5% BSA (Sigma, A7030) and 2.5% goat serum (Gemini, 100-190) at room temperature for 90 min prior
to incubation in primary antibody dissolved in block solution (1:100) at 4 °C overnight. Primary antibody solution was removed, and slides were washed three times for 5 min each in PBS
before Alexa Fluor-conjugated secondary antibodies were applied to the slides for 45 min. After secondary antibody incubation, three 5-min PBS washes were performed and sections were
counterstained with DAPI (600 nM in PBS) for 5 min, then rinsed and mounted with Aqua-Poly/Mount (Polysciences, 18606). IMAGE ACQUISITION AND QUANTIFICATION Confocal images were collected
using a Nikon Ti-E inverted microscope with an A1R HD25 confocal scanning head and acquired in Nikon Elements software. For quantification, a single z-stack was selected and the image was
first smoothed. Nuclei were detected using Li thresholding in ImageJ/Fiji software. Signal intensity for each selected nucleus was measured for the channels 405-DAPI, 488-eGFP (SSM2
cassette) and 647-H2AK119ub1. The ratio intensity of H2AK119ub1 over DAPI was calculated by dividing the 647 mean signal intensity over its corresponding 405 mean signal intensity. HUMAN
SYNOVIAL SARCOMA TISSUE MICROARRAY IMMUNOHISTOCHEMICAL IMAGING Tissue microarray (TMA) construction from anonymized patient primary surgical excision specimens was performed under protocols
H18-00524 and H18-02391, approved by the Clinical Research Ethics Board of the University of British Columbia and BC Cancer. H2AK119ub1 and SS18-SSX immunohistochemistry was performed on a
4-µm section of a formalin-fixed, paraffin-embedded human TMA consisting of 37 synovial sarcoma cases; one case each of epithelioid sarcoma, sarcomatoid mesothelioma, Ewing sarcoma,
sarcomatoid renal cell carcinoma, clear cell sarcoma, dedifferentiated liposarcoma and myxoid liposarcoma; as well as normal skeletal muscle, ovarian stroma, breast glandular tissue and
testis controls from Vancouver General Hospital. Cases were included as 0.6 mm patient sample cores in duplicate. The assays were run with the following conditions via a Leica BOND RX (Leica
Biosystems). Heat-induced epitope retrieval was performed using citrate-based BOND Epitope Retrieval Solution 1 (Leica Biosystems) for 10 min, 10 min and 20 min, respectively. The primary
antibodies H2AK119ub1 (Cell Signaling Technology, 8240) and SSX-SS18 (Cell Signaling Technology, 72364S) were incubated at ambient temperature at 1:400 for 30 min and 1:300 for 15 min,
respectively. Staining was visualized using the BOND Polymer Refine Detection kit (Leica Biosystems, DS9800), which includes a 3,3′-diaminobenzidine (DAB) chromogen and hematoxylin
counterstain. TMA virtual slide scans were then generated on a Leica Aperio AT2 (Leica Biosystems) at ×40 magnification. Each individual patient sample core was analyzed using HALO and HALO
AI (Indica Labs), which required user annotated training data to develop an artificial intelligence segmentation network for nuclear identification. The TMA module was implemented to extract
individual patient core images from the TMA whole slide scan. The Multiplex IHC module was trained to identify DAB staining using representative pixels for delineation from hematoxylin in
order to determine average DAB nuclear optical density. STATISTICS AND REPRODUCIBILITY Details of the individual statistical analyses and tests, as well as the number of biological
replicates, can be found in the respective figure legends. Statistical analysis was performed using Microsoft Excel and GraphPad Prism software. REPORTING SUMMARY Further information on
research design is available in the Nature Portfolio Reporting Summary linked to this article. DATA AVAILABILITY HA-SS18-SSX1 and KDM2B ChIP sequencing data reanalyzed in Fig. 1 originate
from GEO accession number GSE108929. The GEO accession number for ChIP–seq, CUT&RUN-seq and RNA-seq data reported in this paper is GSE205955. Source data are provided with this paper.
REFERENCES * Perry, J. A., Seong, B. K. A. & Stegmaier, K. Biology and therapy of dominant fusion oncoproteins involving transcription factor and chromatin regulators in sarcomas. _Annu.
Rev. Cancer Biol._ 3, 299–321 (2019). Google Scholar * Clark, J. et al. Identification of novel genes, _SYT_ and _SSX_, involved in the t(X;18)(p11.2;q11.2) translocation found in human
synovial sarcoma. _Nat. Genet._ 7, 502–508 (1994). CAS PubMed Google Scholar * Ladanyi, M. Fusions of the _SYT_ and _SSX_ genes in synovial sarcoma. _Oncogene_ 20, 5755–5762 (2001). CAS
PubMed Google Scholar * Kadoch, C. & Crabtree, G. R. Reversible disruption of mSWI/SNF (BAF) complexes by the SS18-SSX oncogenic fusion in synovial sarcoma. _Cell_ 153, 71–85 (2013).
CAS PubMed PubMed Central Google Scholar * Mashtalir, N. et al. Modular organization and assembly of SWI/SNF family chromatin remodeling complexes. _Cell_ 175, 1272–1288.e20 (2018). CAS
PubMed PubMed Central Google Scholar * McBride, M. J. et al. The nucleosome acidic patch and H2A ubiquitination underlie mSWI/SNF recruitment in synovial sarcoma. _Nat. Struct. Mol.
Biol._ 27, 836–845 (2020). CAS PubMed PubMed Central Google Scholar * Banito, A. et al. The SS18-SSX oncoprotein hijacks KDM2B-PRC1.1 to drive synovial sarcoma. _Cancer Cell_ 33,
527–541.e8 (2018). CAS PubMed PubMed Central Google Scholar * Fursova, N. A. et al. Synergy between variant PRC1 complexes defines Polycomb-mediated gene repression. _Mol. Cell_ 74,
1020–1036.e8 (2019). CAS PubMed PubMed Central Google Scholar * Scelfo, A. et al. Functional landscape of PCGF proteins reveals both RING1A/B-dependent-and RING1A/B-independent-specific
activities. _Mol. Cell_ 74, 1037–1052.e7 (2019). CAS PubMed PubMed Central Google Scholar * Dobrinić, P., Szczurek, A. T. & Klose, R. J. PRC1 drives Polycomb-mediated gene repression
by controlling transcription initiation and burst frequency. _Nat. Struct. Mol. Biol._ 28, 811–824 (2021). PubMed PubMed Central Google Scholar * Blackledge, N. P. et al. PRC1 catalytic
activity is central to Polycomb system function. _Mol. Cell_ 77, 857–874.e9 (2020). CAS PubMed PubMed Central Google Scholar * Tamburri, S. et al. Histone H2AK119 mono-ubiquitination is
essential for Polycomb-mediated transcriptional repression. _Mol. Cell_ 77, 840–856.e5 (2020). CAS PubMed PubMed Central Google Scholar * Højfeldt, J. W. et al. Non-core subunits of the
PRC2 complex are collectively required for its target-site specificity. _Mol. Cell_ 76, 423–436.e3 (2019). PubMed Google Scholar * Healy, E. et al. PRC2.1 and PRC2.2 synergize to
coordinate H3K27 trimethylation. _Mol. Cell_ 76, 437–452.e6 (2019). CAS PubMed Google Scholar * Wu, X., Johansen, J. V. & Helin, K. Fbxl10/Kdm2b recruits Polycomb repressive complex 1
to CpG islands and regulates H2A ubiquitylation. _Mol. Cell_ 49, 1134–1146 (2013). CAS PubMed Google Scholar * McBride, M. J. et al. The SS18-SSX fusion oncoprotein hijacks BAF complex
targeting and function to drive synovial sarcoma. _Cancer Cell_ 33, 1128–1141.e7 (2018). CAS PubMed PubMed Central Google Scholar * Jerby-Arnon, L. et al. Opposing immune and genetic
mechanisms shape oncogenic programs in synovial sarcoma. _Nat. Med._ 27, 289–300 (2021). CAS PubMed PubMed Central Google Scholar * Li, J. et al. A role for SMARCB1 in synovial
sarcomagenesis reveals that SS18-SSX induces canonical BAF destruction. _Cancer Discov._ 11, 2620–2637 (2021). CAS PubMed PubMed Central Google Scholar * Yoshida, A. et al.
Identification of novel _SSX1_ fusions in synovial sarcoma. _Mod. Pathol._ 35, 228–239 (2022). CAS PubMed Google Scholar * Farcas, A. M. et al. KDM2B links the Polycomb repressive complex
1 (PRC1) to recognition of CpG islands. _eLife_ 1, e00205 (2012). PubMed PubMed Central Google Scholar * He, J. et al. Kdm2b maintains murine embryonic stem cell status by recruiting
PRC1 complex to CpG islands of developmental genes. _Nat. Cell Biol._ 15, 373–384 (2013). CAS PubMed PubMed Central Google Scholar * Cooper, S. et al. Targeting Polycomb to pericentric
heterochromatin in embryonic stem cells reveals a role for H2AK119u1 in PRC2 recruitment. _Cell Rep._ 7, 1456–1470 (2014). CAS PubMed PubMed Central Google Scholar * Cooper, S. et al.
Jarid2 binds mono-ubiquitylated H2A lysine 119 to mediate crosstalk between Polycomb complexes PRC1 and PRC2. _Nat. Commun._ 7, 13661 (2016). CAS PubMed PubMed Central Google Scholar *
Long, H. K., Blackledge, N. P. & Klose, R. J. ZF-CxxC domain-containing proteins, CpG islands and the chromatin connection. _Biochem. Soc. Trans._ 41, 727–740 (2013). CAS PubMed PubMed
Central Google Scholar * Zhou, Y. et al. High-throughput screening of a CRISPR/Cas9 library for functional genomics in human cells. _Nature_ 509, 487–491 (2014). CAS PubMed Google
Scholar * Hu, J. et al. Direct activation of human and mouse _Oct4_ genes using engineered TALE and Cas9 transcription factors. _Nucleic Acids Res._ 42, 4375–4390 (2014). CAS PubMed
PubMed Central Google Scholar * Shalem, O. et al. Genome-scale CRISPR-Cas9 knockout screening in human cells. _Science_ 343, 84–87 (2014). CAS PubMed Google Scholar * Skene, P. J. &
Henikoff, S. An efficient targeted nuclease strategy for high-resolution mapping of DNA binding sites. _eLife_ 6, e21856 (2017). PubMed PubMed Central Google Scholar * Rose, N. R. et al.
RYBP stimulates PRC1 to shape chromatin-based communication between Polycomb repressive complexes. _eLife_ 5, e18591 (2016). PubMed PubMed Central Google Scholar * Soulez, M., Saurin, A.
J., Freemont, P. S. & Knight, J. C. SSX and the synovial-sarcoma-specific chimaeric protein SYT-SSX co-localize with the human Polycomb group complex. _Oncogene_ 18, 2739–2746 (1999).
CAS PubMed Google Scholar * dos Santos, N. R., de Bruijn, D. R. H., Kater-Baats, E., Otte, A. P. & van Kessel, A. G. Delineation of the protein domains responsible for SYT, SSX, and
SYT-SSX nuclear localization. _Exp. Cell. Res._ 256, 192–202 (2000). PubMed Google Scholar * Shi, J. et al. Discovery of cancer drug targets by CRISPR-Cas9 screening of protein domains.
_Nat. Biotechnol._ 33, 661–667 (2015). CAS PubMed PubMed Central Google Scholar * He, W. et al. De novo identification of essential protein domains from CRISPR-Cas9 tiling-sgRNA knockout
screens. _Nat. Commun._ 10, 4541 (2019). CAS PubMed Central Google Scholar * Lim, F. L., Soulez, M., Koczan, D., Thiesen, H.-J. & Knight, J. C. A KRAB-related domain and a novel
transcription repression domain in proteins encoded by SSX genes that are disrupted in human sarcomas. _Oncogene_ 17, 2013–2018 (1998). CAS PubMed Google Scholar * Traynor, S. et al.
Remodeling and destabilization of chromosome 1 pericentromeric heterochromatin by SSX proteins. _Nucleic Acids Res._ 47, 6668–6684 (2019). CAS PubMed Central Google Scholar * Dale, N. C.,
Johnstone, E. K. M., White, C. W. & Pfleger, K. D. G. NanoBRET: the bright future of proximity-based assays. _Front. Bioeng. Biotechnol._ 7, 56 (2019). PubMed Central Google Scholar *
Machleidt, T. et al. NanoBRET—a novel BRET platform for the analysis of protein–protein interactions. _ACS Chem. Biol._ 10, 1797–1804 (2015). CAS PubMed Google Scholar * Mattiroli, F. et
al. RNF168 ubiquitinates K13-15 on H2A/H2AX to drive DNA damage signaling. _Cell_ 150, 1182–1195 (2012). CAS PubMed Google Scholar * Farnaby, W. et al. BAF complex vulnerabilities in
cancer demonstrated via structure-based PROTAC design. _Nat. Chem. Biol._ 15, 672–680 (2019). CAS PubMed PubMed Central Google Scholar * Schick, S. et al. Acute BAF perturbation causes
immediate changes in chromatin accessibility. _Nat. Genet._ 53, 269–278 (2021). CAS PubMed PubMed Central Google Scholar * Grünewald, T. G. P. et al. Chimeric EWSR1-FLI1 regulates the
Ewing sarcoma susceptibility gene _EGR2_ via a GGAA microsatellite. _Nat. Genet._ 47, 1073–1078 (2015). PubMed PubMed Central Google Scholar * Argani, P. et al. Novel _SS18-NEDD4_ gene
fusion in a primary renal synovial sarcoma. _Genes Chromosomes Cancer_ 59, 203–208 (2020). CAS PubMed Google Scholar * Patton, A., Oghumu, S. & Iwenofu, O. H. An _SS18::NEDD4_
cutaneous spindled and epithelioid sarcoma: an hitherto unclassified cutaneous sarcoma, resembling epithelioid sarcoma with aggressive clinical behavior. _Genes Chromosomes Cancer_ 61,
635–640 (2022). CAS PubMed PubMed Central Google Scholar * Boulay, G. et al. Cancer-specific retargeting of BAF complexes by a prion-like domain. _Cell_ 171, 163–178.e19 (2017). CAS
PubMed PubMed Central Google Scholar * Riedel, S. S. et al. Intrinsically disordered Meningioma-1 stabilizes the BAF complex to cause AML. _Mol. Cell_ 81, 2332–2348.e9 (2021). CAS PubMed
PubMed Central Google Scholar * van Wely, K. H. M. et al. The MN1 oncoprotein synergizes with coactivators RAC3 and p300 in RAR-RXR-mediated transcription. _Oncogene_ 22, 699–709 (2003).
PubMed Google Scholar * Kao, Y.-C. et al. BCOR overexpression is a highly sensitive marker in round cell sarcomas with BCOR genetic abnormalities. _Am. J. Surg. Pathol._ 40, 1670–1678
(2016). PubMed PubMed Central Google Scholar * Kao, Y.-C. et al. BCOR upregulation in a poorly differentiated synovial sarcoma with _SS18L1-SSX1_ fusion—a pathologic and molecular
pitfall. _Genes Chromosomes Cancer_ 56, 296–302 (2017). CAS PubMed PubMed Central Google Scholar * Guo, J. et al. Single-cell analysis of the developing human testis reveals somatic
niche cell specification and fetal germline stem cell establishment. _Cell Stem Cell_ 28, 764–778.e4 (2021). CAS PubMed PubMed Central Google Scholar * Scott, R. W., Arostegui, M.,
Schweitzer, R., Rossi, F. M. V. & Underhill, T. M. _Hic1_ defines quiescent mesenchymal progenitor subpopulations with distinct functions and fates in skeletal muscle regeneration. _Cell
Stem Cell_ 25, 797–813.e9 (2019). CAS PubMed PubMed Central Google Scholar * Haldar, M., Hancock, J. D., Coffin, C. M., Lessnick, S. L. & Capecchi, M. R. A conditional mouse model
of synovial sarcoma: insights into a myogenic origin. _Cancer Cell_ 11, 375–388 (2007). CAS PubMed Google Scholar * Boulay, G. et al. The chromatin landscape of primary synovial sarcoma
organoids is linked to specific epigenetic mechanisms and dependencies. _Life Sci. Alliance_ 4, e202000808 (2020). PubMed PubMed Central Google Scholar * Zhao, J. et al. RYBP/YAF2-PRC1
complexes and histone H1-dependent chromatin compaction mediate propagation of H2AK119ub1 during cell division. _Nat. Cell Biol._ 22, 439–452 (2020). CAS PubMed Google Scholar * Türeci,
Ö. et al. Expression of _SSX_ genes in human tumors. _Int. J. Cancer_ 77, 19–23 (1998). PubMed Google Scholar * Gure, A. O. et al. _SSX_: a multigene family with several members
transcribed in normal testis and human cancer. _Int. J. Cancer_ 72, 965–971 (1997). CAS PubMed Google Scholar * Smith, H. A. & McNeel, D. G. The SSX family of cancer-testis antigens
as target proteins for tumor therapy. _Clin. Dev. Immunol._ 2010, 150591 (2010). PubMed PubMed Central Google Scholar * Peters, T. L. et al. _BCOR–CCNB3_ fusions are frequent in
undifferentiated sarcomas of male children. _Mod. Pathol._ 28, 575–586 (2015). CAS PubMed Google Scholar * Roy, A. et al. Recurrent internal tandem duplications of _BCOR_ in clear cell
sarcoma of the kidney. _Nat. Commun._ 6, 8891 (2015). CAS PubMed Google Scholar * Astolfi, A. et al. Whole transcriptome sequencing identifies BCOR internal tandem duplication as a common
feature of clear cell sarcoma of the kidney. _Oncotarget_ 6, 40934–40939 (2015). PubMed PubMed Central Google Scholar * Pierron, G. et al. A new subtype of bone sarcoma defined by
_BCOR-CCNB3_ gene fusion. _Nat. Genet._ 44, 461–466 (2012). CAS PubMed Google Scholar * Specht, K. et al. Novel _BCOR-MAML3_ and _ZC3H7B-BCOR_ gene fusions in undifferentiated small blue
round cell sarcomas. _Am. J. Surg. Pathol._ 40, 433–442 (2016). PubMed PubMed Central Google Scholar * Sturm, D. et al. New brain tumor entities emerge from molecular classification of
CNS-PNETs. _Cell_ 164, 1060–1072 (2016). CAS PubMed PubMed Central Google Scholar * Sonobe, H. et al. Establishment and characterization of a new human clear‐cell sarcoma cell‐line,
HS‐MM. _J. Pathol._ 169, 317–322 (1993). CAS PubMed Google Scholar * Kawai, A. et al. Establishment and characterization of a biphasic synovial sarcoma cell line, SYO-1. _Cancer Lett._
204, 105–113 (2004). CAS PubMed Google Scholar * Sakai, Y. et al. Protein interactome reveals converging molecular pathways among autism disorders. _Sci. Transl. Med._ 3, 86ra49 (2011).
PubMed PubMed Central Google Scholar * Sanjana, N. E., Shalem, O. & Zhang, F. Improved vectors and genome-wide libraries for CRISPR screening. _Nat. Methods_ 11, 783–784 (2014). CAS
PubMed PubMed Central Google Scholar * Hayer, A. et al. Engulfed cadherin fingers are polarized junctional structures between collectively migrating endothelial cells. _Nat. Cell Biol._
18, 1311–1323 (2016). CAS PubMed PubMed Central Google Scholar * Orlando, D. A. et al. Quantitative ChIP-seq normalization reveals global modulation of the epigenome. _Cell Rep._ 9,
1163–1170 (2014). CAS PubMed Google Scholar * Ramírez, F. et al. deepTools2: a next generation web server for deep-sequencing data analysis. _Nucleic Acids Res._ 44, W160–W165 (2016).
PubMed PubMed Central Google Scholar * Langmead, B., Trapnell, C., Pop, M. & Salzberg, S. L. Ultrafast and memory-efficient alignment of short DNA sequences to the human genome.
_Genome Biol._ 10, R25 (2009). PubMed Central Google Scholar * Langmead, B. & Salzberg, S. L. Fast gapped-read alignment with Bowtie 2. _Nat. Methods_ 9, 357–359 (2012). CAS PubMed
PubMed Central Google Scholar * Zhang, Y. et al. Model-based analysis of ChIP-seq (MACS). _Genome Biol._ 9, R137 (2008). PubMed Central Google Scholar * Feng, J., Liu, T., Qin, B.,
Zhang, Y. & Liu, X. S. Identifying ChIP-seq enrichment using MACS. _Nat. Protoc._ 7, 1728–1740 (2012). CAS PubMed Google Scholar * Brinkman, E. K., Chen, T., Amendola, M. & van
Steensel, B. Easy quantitative assessment of genome editing by sequence trace decomposition. _Nucleic Acids Res._ 42, e168 (2014). PubMed PubMed Central Google Scholar * Herrmann, C.,
Avgousti, D. C. & Weitzman, M. D. Differential salt fractionation of nuclei to analyze chromatin-associated proteins from cultured mammalian cells. _Bio Protoc._ 7, e2175 (2017). PubMed
Central Google Scholar * Schneider, W. M. et al. Genome-scale identification of SARS-CoV-2 and pan-coronavirus host factor networks. _Cell_ 184, 120–132.e14 (2021). CAS PubMed Google
Scholar * Soto-Feliciano, Y. M. et al. A molecular switch between mammalian MLL complexes dictates response to Menin–MLL inhibition. _Cancer Discov._ 13, 146–169 (2023). CAS PubMed Google
Scholar * Morgens, D. W. et al. Genome-scale rmeasurement of off-target activity using Cas9 toxicity in high-throughput screens. _Nat. Commun._ 8, 15178 (2017). CAS PubMed PubMed Central
Google Scholar * Ritchie, M. E. et al. limma powers differential expression analyses for RNA-sequencing and microarray studies. _Nucleic Acids Res._ 43, e47 (2015). PubMed PubMed Central
Google Scholar * Huber, W., von Heydebreck, A., Sültmann, H., Poustka, A. & Vingron, M. Variance stabilization applied to microarray data calibration and to the quantification of
differential expression. _Bioinformatics_ 18, S96–S104 (2002). PubMed Google Scholar * Liao, Y., Smyth, G. K. & Shi, W. featureCounts: an efficient general purpose program for
assigning sequence reads to genomic features. _Bioinformatics_ 30, 923–930 (2014). CAS Google Scholar * Ge, S. X., Son, E. W. & Yao, R. iDEP: an integrated web application for
differential expression and pathway analysis of RNA-seq data. _BMC Bioinformatics_ 19, 534 (2018). CAS PubMed PubMed Central Google Scholar * Guo, J. et al. The adult human testis
transcriptional cell atlas. _Cell Res._ 28, 1141–1157 (2018). CAS PubMed PubMed Central Google Scholar Download references ACKNOWLEDGEMENTS We thank W. He from H. Xu’s laboratory for
help in running ProTiler analysis for the _SS18-SSX1_ gene-tiling screen. We also thank S.W. Lowe, D.F. Tschaharganeh (University Hospital Heidelberg), J. Zuber (IMP, Vienna) and S. Henikoff
(Fred Hutchinson Cancer Research, Seattle) for sharing reagents and protocols; A. Feldmann (DKFZ) for assistance in calibrated ChIP analysis and _Drosophila_ SG-4 cells; D. Talwar from the
T. Dick group at the DKFZ for assistance in measurements for the NanoBRET assays; and EMBL Mass Spectrometry Facility members M. Rettel and F. Stein for sample processing and data analysis.
We also thank R. Illingworth and C. Playfoot for their useful comments and discussion regarding the manuscript and members of the paediatric soft tissue sarcoma lab and the U54 Synovial
Sarcoma consortium for feedback and fruitful discussions. This project has received funding from the European Research Council (ERC) under the European Union’s Horizon 2020 research and
innovation programme (grant agreement no. 805338) (A.B.) and from the National Institutes of Health/National Cancer Institute (NIH/NCI) U54CA231652 (T.O.N., T.M.U. and A.B.). T.O.N. and
T.M.U. were additionally supported by grants from the Canadian Cancer Society (705615) and the Terry Fox Research Institute (1082). N.S.B. was supported by a DKFZ Postdoctoral Fellowship.
F.J.S.-R. was supported by the MSKCC TROT program (5T32CA160001) and a GMTEC Postdoctoral Researcher Innovation Grant, and is an HHMI Hanna Gray Fellow. The funders had no role in study
design, data collection and analysis, decision to publish or preparation of the manuscript. FUNDING Open access funding provided by Deutsches Krebsforschungszentrum (DKFZ). AUTHOR
INFORMATION AUTHORS AND AFFILIATIONS * Soft Tissue Sarcoma Research Group, Hopp Children’s Cancer Center, Heidelberg (KiTZ), German Cancer Research Center (DKFZ), Heidelberg, Germany Nezha
S. Benabdallah, Vineet Dalal, Fady Marcous, Afroditi Sotiriou, Felix K. F. Kommoss, Anastasija Pejkovska, Ludmila Gaspar, Lena Wagner & Ana Banito * Department of Cellular and
Physiological Sciences, Faculty of Medicine, University of British Columbia, Vancouver, BC, Canada R. Wilder Scott & T. Michael Underhill * Institute of Pathology, University of
Heidelberg, Heidelberg, Germany Felix K. F. Kommoss * Cancer Biology and Genetics Program, Memorial Sloan Kettering Cancer Center, Sloan Kettering Institute, New York, NY, USA Francisco J.
Sánchez-Rivera * Department of Pathology and Laboratory Medicine, Vancouver Coastal Health Research Institute and Faculty of Medicine, University of British Columbia, Vancouver, BC, Canada
Monica Ta, Shelby Thornton & Torsten O. Nielsen Authors * Nezha S. Benabdallah View author publications You can also search for this author inPubMed Google Scholar * Vineet Dalal View
author publications You can also search for this author inPubMed Google Scholar * R. Wilder Scott View author publications You can also search for this author inPubMed Google Scholar * Fady
Marcous View author publications You can also search for this author inPubMed Google Scholar * Afroditi Sotiriou View author publications You can also search for this author inPubMed Google
Scholar * Felix K. F. Kommoss View author publications You can also search for this author inPubMed Google Scholar * Anastasija Pejkovska View author publications You can also search for
this author inPubMed Google Scholar * Ludmila Gaspar View author publications You can also search for this author inPubMed Google Scholar * Lena Wagner View author publications You can also
search for this author inPubMed Google Scholar * Francisco J. Sánchez-Rivera View author publications You can also search for this author inPubMed Google Scholar * Monica Ta View author
publications You can also search for this author inPubMed Google Scholar * Shelby Thornton View author publications You can also search for this author inPubMed Google Scholar * Torsten O.
Nielsen View author publications You can also search for this author inPubMed Google Scholar * T. Michael Underhill View author publications You can also search for this author inPubMed
Google Scholar * Ana Banito View author publications You can also search for this author inPubMed Google Scholar CONTRIBUTIONS N.S.B. conceived the study; designed, performed and analyzed
the experiments; and wrote the manuscript. V.D. generated the Cas9 cell lines, conducted the CRISPR–Cas9 screen, conducted the competition assays, assisted with the CUT&RUN experiments
and performed and analyzed the calibrated native H2AK119ub1 ChIP. R.W.S. and T.M.U. provided the mouse model data. F.K.F.K. performed immunohistochemistry analysis of human testis. F.M.,
A.S., A.P., L.G. and L.W. assisted in experiments and reagent production. F.J.S.-R. assisted with CRISPR–Cas9 library cloning and screen deconvolution. M.T., S.T. and T.O.N. provided the
analysis for the synovial sarcoma TMAs. A.B. conceived and coordinated the study and wrote the manuscript. All authors read and approved the final manuscript for publication. CORRESPONDING
AUTHOR Correspondence to Ana Banito. ETHICS DECLARATIONS COMPETING INTERESTS The authors declare no competing interests. PEER REVIEW PEER REVIEW INFORMATION _Nature Structural &
Molecular Biology_ thanks the anonymous reviewers for their contribution to the peer review of this work. Primary Handling Editor: Carolina Perdigoto, Tiago Faial and Dimitris Typas, in
collaboration with the _Nature Structural & Molecular Biology_ team. Peer reviewer reports are available. ADDITIONAL INFORMATION PUBLISHER’S NOTE Springer Nature remains neutral with
regard to jurisdictional claims in published maps and institutional affiliations. EXTENDED DATA EXTENDED DATA FIG. 1 PRC1.1 IS SUFICIENT TO INITIATE SS18-SSX RECRUITMENT. A) Left,
Immunofluorescence for the MBD-Luc, MBD-KDM2B or for KDM2B-WT fused to a V5 tag (V5, magenta) and HP1 (green). Right, percentage of V5 foci overlapping HP1 foci. Data represents the mean of
2 biological replicates. Scale bars 5um throughout the figure. B) Left, Immunofluorescence of MBD-KDM2B (V5, magenta) with PCGF1, RING1B, RYBP and H2AK119ub1 (green). Right, percentage of
foci overlapping a V5 foci in n = 2 (PCGF1, data represents the mean) or 1 biological replicate. C) Western Blot of HS-SY-II-Cas9 whole cell extracts expressing sgRNAs revealed using BCOR,
EZH2, EED, PCGF1 or Beta-actin antibodies. D) Left, Immunofluorescence for MBD-KDM2B (V5, magenta) in the presence of different sgRNAs (resulting in eGFP background fluorescence) with
H2AK119ub1 (green). Right, percentage of H2AK119ub1 foci overlapping V5 foci in one biological replicate. E) Left, Immunofluorescence of MBD-KDM2B (V5, magenta) with EED, EZH2 or H3K27me3
(green). Right, percentage of foci overlapping a V5 foci in one biological replicate. F) Left, Immunofluorescence for V5 (magenta) and H3K27me3 (cyan). Right, percentage of H3K27me3 foci
overlapping with V5 foci in 2 biological replicates. Data represents the mean. G) Heatmaps of H2AK119ub1 scaled CUT&RUN signals (purple) in HS-SY-II-Cas9 cells expressing empty sgRNA as
control (sgEV) or targeting PCGF1 (sgPCGF1) over H2AK119ub1 peaks in HS-SY-II (n = 11099). Rows correspond to ±10-kb regions across the midpoint of each enriched region, ranked by increasing
signal. H) Heatmaps of SS18-SSX2 (blue) or H2AK119ub1 (purple) scaled CUT&RUN signals in SYO-I-Cas9 cells expressing empty sgRNA as control (sgEV) or targeting PCGF1 (sgPCGF1) over
SS18-SSX2 peaks in SYO-I (n = 27686). Rows correspond to ±10-kb regions across the midpoint of each enriched region, ranked by increasing signal. I) Gene tracks for H2AK119ub1 and SS18-SSX
CUT&RUN signals in SYO-I Cas9 at the _SHH_ and _FGF4-FGF3_ loci. J) Tracking of Indels by Decomposition (TIDE) assay displaying the percentage of aberrant sequences after Cas9 editing
for 2 guides targeting PCGF1 and PCGF3 versus the wild-type sequence (control sample). K) Cell competition assay performed in the osteosarcoma cell line KHOS-240S-Cas9 (fusion negative
control) or in the synovial sarcoma line HS-SY-II-Cas9 transduced with an empty sgRNA as control or with guides targeting PCGF1 and PCGF3. Source data EXTENDED DATA FIG. 2 SSX-C BINDS
CHROMATIN VIA THE SSRXD DOMAIN. A) Schematic of eGFP-fused constructs (green) for SS18, SS18-SSX1, SSX-C (78aa of SSX1 present in the SS18-SSX1 fusion), SSXRD (last 34aa of SSX-C) or
SSX-CΔRD (SSX-C with a deletion of the SSXRD). B) Images representative of 2 independent live confocal imaging of the eGFP-fused constructs in HEK193T cells. Scale bar 20um. C) Salt
extraction assay displaying eGFP levels by western blot in HEK293T expressing the various eGFP constructs. D) Percentage of total eGFP-fused protein per salt extraction fractions. Data
represents the mean ± S.E.M of n = 2 (eGFP, SSXRD) or n = 3 (SS18, SS18-SSX1, SSX-C and SSX-CΔRD) biological replicates. Asterisks represent p-values of paired one-tailed t-test between
groups (from left to right, p = 0.02; p = 0.03; p = 0.03; p = 0.01). E) Log2 fold change correlation plot of eGFP-SSXRD and eGFP-SSX-C mass spectrometry data following eGFP pull down in
HS-SY-II cells. Data was normalized to eGFP-SSX-CΔRD. F) Western blot of histone acid extracts from HEK293T cells transfected with either Nluc-H2A or Nluc-H2AK118K119R revealed with NLuc,
H2AK119ub1 and H3 antibodies. Western was repeated for each replicate. G) BRET ratio (mBU) in Nluc-H2A or Nluc-H2AK118K119R transfected HEK293T cells expressing empty vector HALO,
HALO-SSX-C, HALO-SSX-CΔRD or HALO-SSX-CE184*. Data represents the mean ± S.E.M of n = 3 biological replicates. Asterisks represent p-values of paired one-tailed t-test between groups (from
left to right, p = 0.04; p = 0.01; ns=0.33). H) Western Blot of whole cell extracts from HS-SY-II cells expressing shRNA against SS18-SSX collected 72 h after no doxycycline (-DOX) or
doxycycline ( + DOX) treatment. Blot revealed using SS18-SSX or Beta-actin antibodies. shRNA knockdown was repeated in 3 independent experiments. I) Heatmap of Spearman correlation
coefficients from bigWig coverages computed over all HA peaks on the KHOS-240S CUT&RUN. J) Western Blot of whole cell extracts from HS-SY-II or HEK293T cells collected 72 h without or
with 500 nM ACBI1 treatment. Blot revealed using SMARCA4 (BRG1), SMARCC1 (BAF155) and Beta-actin antibodies. Western blot was repeated in 2 independent experiments. Source data EXTENDED DATA
FIG. 3 ALTERNATIVE SSX FUSIONS ACTIVATE GENE EXPRESSION INDEPENDENTLY OF BAF. A) Immunofluorescence of MBD-KDM2B (V5, magenta) and H3K27ac (cyan) in HS-SY-II cells. Images are
representative of 3 independent replicates. Scale bars indicate 5um throughout the figure. B) H2AK119ub1 immunofluorescence of HEK293T cells expressing eGFP-SS18-SSX1, eGFP-EWSR1-SSX1 or
eGFP-MN1-SSX1 treated with DMSO (left) or 500 nM ACBI1 (right). Bottom panel displays merge channels with eGFP (cyan) and H2AK119ub1 (magenta). Images are representative of 1 replicate. C)
qRT-PCR in hMSC expressing SSX-C, EWSR1-SSX1 or MN1-SSX 72 h after DMSO or 500 nM ACBI1 treatment. Data represents the mean of n = 2 biological replicates. Source data EXTENDED DATA FIG. 4
SSX-C ENHANCES H2AK119UB1 BY STABILIZING PRC1.1 LEVELS. A) Gene tracks for SS18-SSX and SSX CUT&RUN at the _BCOR_ locus. B) Log2 Fold change of RPKM values from RNA sequencing in
HS-SY-II and SYO-I cells after knockdown of SS18-SSX compared to shCtrl cells. Data from McBride et al., 2018 represents the mean of two biological replicates. C) Western blot of whole cell
extracts of HS-SY-II cells expressing shRNA against SS18-SSX over a time-course of 0 h to 72 h doxycycline induction. Blot represents one replicate. D) E) Left, Immunofluorescence against
H2AK119ub1/BCOR in HS-SY-II expressing eGFP-fused constructs. Scale bars indicate 20um throughout the figure. Right, quantification of H2AK119ub1/BCOR fluorescence ratio in high versus low
eGFP cells. Data represents the mean ± S.E.M of n = 7 (H2AK119ub1) or n = 5 (BCOR) biological replicates. Asterisks represent p-values of paired one-tailed t-test between groups (p = 0.0008
(H2AK119ub1), p = 0.03 (BCOR)). F) Western blot of whole cell extracts from hMSCs expressing eGFP or eGFP-SS18-SSX1. Blot represents one replicate. G) Salt extraction assay in HS-SY-II
expressing eGFP, eGFP-SSX-C and eGFP-SSX-CΔRD. Proteins were detected by western blot using with BCOR, PCGF1 or Beta-actin (loading control) antibodies. H) Quantification of the protein
distribution in the various fractions of the salt extraction for BCOR or PCGF1. Data represents the percentage of total protein levels in one replicate. I) Log2 Fold change of FKPM values in
mesenchymal stem cells (hMSCs) expressing the new fusion constructs and controls for _SS18_ or _SSX1_ mRNA levels. Data represents the mean of two biological replicates. J) CUT&RUN Gene
tracks in HS-SY-II cells expressing HA-eGFP fused to SSX-C without and with SS18-SSX depletion mediated by shRNA over the _SS18_ to the _KCTD1_ loci. Red arrowhead marks the _SS18_
promoter. K) Left, tSNE and clustering analysis of combined single-cell transcriptome data from human testes (n = 6490) from (Guo et al., 2018). Each dot represents a single cell and is
colored according to its cluster identity as indicated on the figure key. The 13 cluster identities were assigned based on marker gene expression. Right, SSX1 expression pattern projected on
the tSNE plot. Red indicates high expression and gray indicates low or no expression. Source data EXTENDED DATA FIG. 5 MURINE AND HUMAN SYNOVIAL SARCOMAS EXIBIT HIGH LEVELS OF H2AK119UB1.
A) Immunofluorescence of _Hic1__creERT2/creERT2__; Rosa26__SSM2/SSM2_ mice at 16-week endpoint tongue tissue showing left, non-tamoxifen treated mice (-TAM) (upper panel) or tamoxifen
treated mice expressing or not the SSM2 cassette (human SS18-SSX2) embedded in striated muscle +TAM; SSM2+ and +TAM; SSM2− cells (lower panel). The cells are stained for DAPI, SSM2 and
H2AK119ub1. The scale bar represents 100 um. B) Close-ups of images shown in the panel above, in the area delineated by the dashed square in (a). C) Quantification of H2AK119ub signal
intensity normalised to DAPI signal intensity in 3 biological replicates (3 different mice) in non-tamoxifen treated mice (-TAM), or tamoxifen treated mice ( + TAM) expressing or not the
SSM2 cassette (human SS18-SSX2) and showing normal tongue muscle ( + TAM; SSM2−) adjacent to synovial sarcoma tumours ( + TAM; SSM2+). Asterisks represent p-values of paired one-tailed
t-test between groups (p = 0.0006). D) Spearman correlation between SS18-SSX, left or SSX, right signals and H2AK119ub1 signals per sarcoma sample. Source data EXTENDED DATA FIG. 6 PROTOCOL
FOR EGFP-BASED IMAGING QUANTIFICATION OF PROTEIN LEVELS. Step1 imaging on the confocal of the eGFP overexpressing constructs. Step2, using FiJi and Li thresholding, selecting and marking of
the nuclei as Region of interest (ROI). Computing signal intensity for each ROI, the mean is kept and normalized for each channel to its corresponding DAPI value. Step 3 the values are
separated in high eGFP (signal above 1) and low eGFP (signal below 1). The fluorescence ratio for a specific channel is computed by dividing its average in the high eGFP population on the
low eGFP population. SUPPLEMENTARY INFORMATION REPORTING SUMMARY PEER REVIEW FILE SUPPLEMENTARY TABLES Supplementary Table 1: Mass spectrometry data presented in Extended Data Fig. 2e.
Supplementary Table 2: RNA-seq data presented in Fig. 3c. Supplementary Table 3: List of constructs used in this study. Supplementary Table 4: List of DNA oligos used in this study.
Supplementary Table 5: List of antibodies used in this study. SOURCE DATA SOURCE DATA FIG. 1 Statistical source data. SOURCE DATA FIG. 1 Unprocessed western blots. SOURCE DATA FIG. 2
Statistical source data. SOURCE DATA FIG. 3 Statistical source data. SOURCE DATA FIG. 3 Unprocessed western blots. SOURCE DATA FIG. 4 Statistical source data. SOURCE DATA FIG. 4 Unprocessed
western blots. SOURCE DATA FIG. 5 Statistical source data. SOURCE DATA EXTENDED DATA FIG.1 Statistical source data. SOURCE DATA EXTENDED DATA FIG.1 Unprocessed western blots. SOURCE DATA
EXTENDED DATA FIG.2 Statistical source data. SOURCE DATA EXTENDED DATA FIG.2 Unprocessed western blots. SOURCE DATA EXTENDED DATA FIG.3 Statistical source data. SOURCE DATA EXTENDED DATA
FIG.4 Statistical source data. SOURCE DATA EXTENDED DATA FIG.4 Unprocessed western blots. SOURCE DATA EXTENDED DATA FIG.5 Statistical source data. RIGHTS AND PERMISSIONS OPEN ACCESS This
article is licensed under a Creative Commons Attribution 4.0 International License, which permits use, sharing, adaptation, distribution and reproduction in any medium or format, as long as
you give appropriate credit to the original author(s) and the source, provide a link to the Creative Commons license, and indicate if changes were made. The images or other third party
material in this article are included in the article’s Creative Commons license, unless indicated otherwise in a credit line to the material. If material is not included in the article’s
Creative Commons license and your intended use is not permitted by statutory regulation or exceeds the permitted use, you will need to obtain permission directly from the copyright holder.
To view a copy of this license, visit http://creativecommons.org/licenses/by/4.0/. Reprints and permissions ABOUT THIS ARTICLE CITE THIS ARTICLE Benabdallah, N.S., Dalal, V., Scott, R.W. _et
al._ Aberrant gene activation in synovial sarcoma relies on SSX specificity and increased PRC1.1 stability. _Nat Struct Mol Biol_ 30, 1640–1652 (2023).
https://doi.org/10.1038/s41594-023-01096-3 Download citation * Received: 26 July 2022 * Accepted: 15 August 2023 * Published: 21 September 2023 * Issue Date: November 2023 * DOI:
https://doi.org/10.1038/s41594-023-01096-3 SHARE THIS ARTICLE Anyone you share the following link with will be able to read this content: Get shareable link Sorry, a shareable link is not
currently available for this article. Copy to clipboard Provided by the Springer Nature SharedIt content-sharing initiative