- Select a language for the TTS:
- UK English Female
- UK English Male
- US English Female
- US English Male
- Australian Female
- Australian Male
- Language selected: (auto detect) - EN
Play all audios:
ABSTRACT To maintain stable DNA concentrations, proliferating cells need to coordinate DNA replication with cell growth. For nuclear DNA, eukaryotic cells achieve this by coupling DNA
replication to cell-cycle progression, ensuring that DNA is doubled exactly once per cell cycle. By contrast, mitochondrial DNA replication is typically not strictly coupled to the cell
cycle, leaving the open question of how cells maintain the correct amount of mitochondrial DNA during cell growth. Here, we show that in budding yeast, mitochondrial DNA copy number
increases with cell volume, both in asynchronously cycling populations and during G1 arrest. Our findings suggest that cell-volume-dependent mitochondrial DNA maintenance is achieved through
nuclear-encoded limiting factors, including the mitochondrial DNA polymerase Mip1 and the packaging factor Abf2, whose amount increases in proportion to cell volume. By directly linking
mitochondrial DNA maintenance to nuclear protein synthesis and thus cell growth, constant mitochondrial DNA concentrations can be robustly maintained without a need for cell-cycle-dependent
regulation. SIMILAR CONTENT BEING VIEWED BY OTHERS E2F-DEPENDENT TRANSCRIPTION DETERMINES REPLICATION CAPACITY AND S PHASE LENGTH Article Open access 14 July 2020 A MORTALITY TIMER BASED ON
NUCLEOLAR SIZE TRIGGERS NUCLEOLAR INTEGRITY LOSS AND CATASTROPHIC GENOMIC INSTABILITY Article 25 November 2024 PHASE SEPARATION DRIVES THE SELF-ASSEMBLY OF MITOCHONDRIAL NUCLEOIDS FOR
TRANSCRIPTIONAL MODULATION Article 28 October 2021 MAIN As cells grow during the cell cycle, they need to double their DNA content so that each daughter cell obtains the appropriate amount.
In fact, a major task of the eukaryotic cell cycle is ensuring that nuclear DNA is replicated once—and only once—during S phase, and extensive research has given us a detailed understanding
of this process1,2. By contrast, how this is achieved for mitochondrial DNA (mtDNA) is largely unclear. In many organisms, including humans and yeasts, mtDNA encodes proteins that are
essential for oxidative phosphorylation, and cells typically contain many mtDNA copies3,4. mtDNA is organized in ‘nucleoids,’ nucleoprotein complexes that can contain one or several copies
of mtDNA5,6. Although several regulators of mtDNA copy number have been identified6, including the nucleoid protein TFAM7 and its homolog Abf2 in yeast8, mtDNA polymerase9, and
helicases10,11, how cells maintain the correct number of mtDNA copies throughout cell growth is unknown. In contrast to replication of nuclear DNA, mtDNA replication is not strictly coupled
to cell-cycle progression. Although some studies have reported cell-cycle-dependent modulation of mtDNA replication rates for human cells12,13,14, mtDNA replication occurs throughout the
cell cycle and even continues during long cell-cycle arrests15,16,17,18. However, if mtDNA replication is not controlled by cell-cycle progression, how can cells then coordinate the amount
of mtDNA produced with cell growth? One possibility is that mitochondrial homeostasis is directly linked to cell size. Indeed, it has been shown that the amount of mitochondria in budding
yeast19, HeLa20, mouse liver21, Jurkat and _Drosophila_ Kc167 cells22 increases roughly in proportion to cell volume. In addition, the number of nucleoids in budding yeast correlates with
mitochondrial network volume23, and nucleoid number in fission yeast increases with increasing cell volume24—suggesting that mtDNA copy number might be linked to cell volume. However, direct
evidence for a role for cell volume in mtDNA homeostasis is missing. Here we show that, in budding yeast, the number of mtDNA copies and nucleoids increases in direct proportion to cell
volume. We find that mtDNA maintenance is limited by nuclear-encoded proteins whose abundance increases with cell volume. Supported by mathematical modeling, our results suggest that the
overall increase of cellular protein synthesis with increasing cell volume couples mtDNA copy number to cell volume, achieving robust mtDNA homeostasis during cell growth and cell-cycle
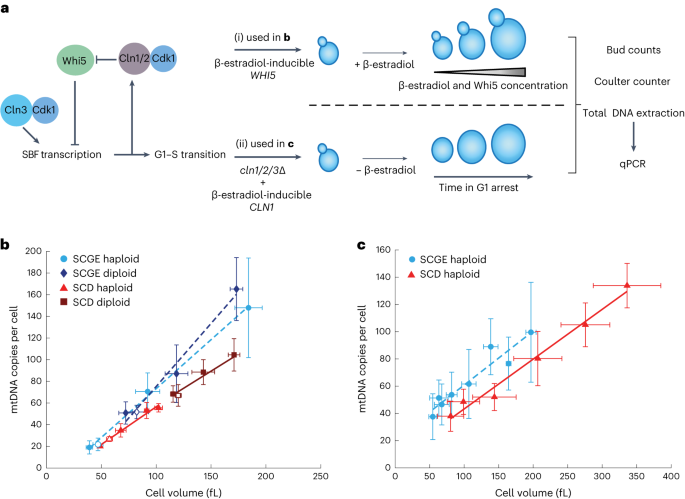
progression. RESULTS MTDNA COPY NUMBER INCREASES WITH CELL VOLUME To understand the role of cell size in the regulation of mtDNA, we first measured the dependence of mtDNA copy number on
cell volume in budding yeast. We used haploid and diploid strains carrying the cell-size regulator _WHI5_ under the control of a β-estradiol-inducible promoter25. Whi5 modulates G1 duration
by inhibiting the G1–S transcription factor SBF. Overexpression of Whi5 by addition of β-estradiol therefore initially causes a prolonged G1 phase and increased cell volume. Eventually,
cells reach a cell volume that is large enough for division26, and after 24 h of growth in the exponential phase, this results in a steady state of asynchronous cell populations with
increased mean cell volumes27,28 (Fig. 1a). We grew cells on synthetic complete medium with 2% glycerol and 1% ethanol as a non-fermentable carbon source (SCGE). Using β-estradiol
concentrations ranging from 0 to 30 nM (haploid) or 60 nM (diploid) and wild-type strains without inducible Whi5, we obtained steady-state cultures with a more than fourfold range in mean
cell volume (Extended Data Fig. 1), but with similar doubling times and only moderately shifted cell-cycle fractions27. For each culture, we measured cell volume using a Coulter counter,
determined bud fractions, purified DNA, and performed quantitative PCR (qPCR) measurements on nuclear and mtDNA to determine the average number of mtDNA copies per cell. For both haploid and
diploid strains, we found that mtDNA copy number increases roughly in direct proportion with cell volume (Fig. 1b). We next asked whether this increase in the amount of mtDNA with increased
cell volume is specific to non-fermentable media, in which functional mtDNA is essential. We repeated the experiments using synthetic complete medium with 2% glucose (SCD), in which mtDNA
is not essential. Again, we found that the amount of mtDNA increases with cell volume, but at a given cell volume, cells grown on SCD have less mtDNA than do cells grown on SCGE (Fig. 1b).
To test whether the increase of mtDNA is linked to the increase in cell volume, rather than to Whi5 overexpression, we sought an alternative approach to control cell volume. We used a
haploid strain in which all three endogenous G1 cyclins (_CLN1_, _CLN2_, and _CLN3_) were deleted, and which is kept alive by a copy of _CLN1_ whose expression can be induced by
β-estradiol29. Upon removal of β-estradiol, the cells arrest in G1 while continuously growing (Extended Data Fig. 1e,f). We collected cells at different time points during G1 arrest and
measured cell volume, bud fractions, and mtDNA copy number (Fig. 1a). In accordance with mtDNA being replicated also in G1 (refs. 15,17) and confirming the results of the Whi5-inducible
system, we found that, as cells grow during G1, mtDNA copy number continuously increases (Fig. 1c). mtDNA copy number is lower in cells grown on SCD than in those grown on SCGE. NUCLEOID
NUMBER INCREASES WITH CELL VOLUME mtDNA is organized in nucleoids, which are distributed throughout the mitochondrial network23. In principle, the increase in mtDNA with cell volume could be
due to an increased number of nucleoids or an increased number of mtDNA copies per nucleoid. To distinguish between the two scenarios, we adapted a previously established system to
visualize mtDNA in live cells23. Briefly, we introduced inducible Whi5 into haploid and diploid strains in which LacO arrays had been stably integrated into the mitochondrial genome (Fig.
2a). A constitutively expressed LacI tagged with 2×mNeon and a mitochondrial targeting sequence then bound to the LacO arrays, resulting in fluorescent foci that could be detected using
confocal microscopy (Fig. 2b and Extended Data Fig. 2a). In addition, we used the fluorescent protein mKate2 targeted to the mitochondrial matrix to visualize the mitochondrial network. We
then induced Whi5 expression in cells grown either on SCGE or SCD with different concentrations of β-estradiol and imaged the cells using three-dimensional (3D) confocal microscopy. Using a
custom image-analysis pipeline, we segmented cells in two dimensions (2D) on the basis of bright-field images30, and segmented the mitochondrial network and identified mtDNA foci in 3D from
fluorescence signals. Consistent with a previous report19, the volume of the mitochondrial network increases in proportion with cell volume, with cells grown on SCD having a smaller
mitochondrial network than those grown on SCGE (Fig. 2c). We also found that the number of mtDNA foci (which we interpret as nucleoids) increases with cell volume (Fig. 2d) and mitochondrial
network volume (Fig. 2e), indicating an increase in the number of nucleoids rather than an increase in mtDNA copy number per nucleoid (Extended Data Fig. 2b). In line with the reduced
number of mtDNA copies per cell (Fig. 1b,c), we detected fewer nucleoids at a given cell volume when cells were grown on SCD (Fig. 2d). MITOCHONDRIAL DIAMETER IS INDEPENDENT OF CELL VOLUME
We observe that mitochondrial network volume, mtDNA amount, and nucleoid number all increase with cell volume. Together with previous reports on yeast19 and mammalian cells20,21, this
finding suggests that the amount of mitochondria increases in larger cells but that the local mitochondrial structure is rather constant. Still, cell volume could affect mitochondrial
diameter, which we cannot resolve with confocal microscopy. To test this, we analyzed haploid wild-type and Whi5-inducible cells grown in SCD or SCGE in the absence or presence of
β-estradiol by transmission electron microscopy and measured mitochondrial width. We observed no changes in mean mitochondrial diameter associated with increasing cell volume, irrespective
of whether the cells were grown in SCD or SCGE (Fig. 2f–h and Extended Data Fig. 3). Furthermore, we observed no obvious cell-volume-dependent alterations of the structure of the
mitochondrial inner membrane (Fig. 2g,h and Extended Data Fig. 3e,f). MITOCHONDRIAL NETWORK SCALES WITH CELL VOLUME WITHOUT MTDNA So far, we have shown that larger cells have a larger
mitochondrial network and an increased amount of mtDNA and nucleoids. We wondered whether the increase in mitochondrial-network volume depends on mtDNA. We therefore created a strain with
deletion of the only mtDNA polymerase in yeast, _MIP1_, which results in loss of mtDNA (Supplementary Table 1). We grew this strain on SCD and measured mitochondrial network volume as a
function of cell volume (Fig. 3a,b). We noticed that these cells without mtDNA, called ρ0 cells, show a larger variability of cell volume, in particular after Whi5 overexpression, and
exhibit altered network morphology (Fig. 3a,b and Extended Data Fig. 4a,b). With transmission electron microscopy, we found that in cells with _mip1_ deletion (_mip1_∆), the mitochondrial
diameter was reduced (Fig. 3c,d and Extended Data Fig. 4c) and almost no normal cristae were observed. Instead, most mitochondrial cross-sections contained altered inner-membrane structures
that spanned the matrix or completely lacked cristae-like inner membrane structures (Fig. 3c). This is presumably caused by the absence of mtDNA, because it has been assumed that the
maintenance of normal cristae structure depends on the presence of mtDNA in budding yeast31. Despite the absence of mtDNA and the altered mitochondrial morphology, the mitochondrial-network
volume in _mip1_∆ cells still increases with cell volume (Fig. 3a). Moreover, at a given cell volume, the network volume of _mip1_∆ cells, as determined with confocal microscopy, was similar
to that in wild-type cells (Fig. 3a). However, owing to the decreased mitochondrial diameter, which we could not reliably measure with confocal microscopy, the network volume measurements
of wild-type and _mip1_∆ cells are not directly comparable. Although we thus cannot exclude that deletion of _MIP1_ and the loss of mtDNA alters mitochondrial-network volume, the fact that
we still observe an increase with cell volume demonstrates that the regulation with cell volume occurs either upstream or independent of mtDNA. MTDNA COPY NUMBER IS SET BY CELL VOLUME To
test whether mtDNA copy number is causally linked to cell or mitochondrial-network volume, we used a mutant with reduced mitochondrial-network volume. In the context of previous work32, we
observed that _mic60_∆ cells tended to have less mitochondrial-network volume. Here, we quantitatively assessed and confirmed this phenotype (Fig. 3e–g and Extended Data Fig. 4d–g). For
cells grown on either SCD or SCGE, deleting _MIC60_, a component of the MICOS complex33,34,35, leads to a lower mitochondrial network volume (as measured with confocal microscopy) at a given
cell volume (Fig. 3e and Extended Data Fig. 4f) and to a smaller number of nucleoids (Fig. 3f and Extended Data Fig. 4g). However, in accordance with previous work32, we found that, despite
the reduction of mitochondrial-network volume and nucleoids, mtDNA concentration is not reduced (Fig. 3g and Extended Data Fig. 4d,e). This suggests that the mitochondrial network and mtDNA
copy number are coupled independently to cell volume. An additional layer of regulation might coordinate mitochondrial network volume and nucleoid number, such that mtDNA and nucleoid
number are not strictly coupled (Extended Data Fig. 4h). AMOUNT OF MTDNA-MAINTENANCE FACTORS INCREASES WITH CELL SIZE In summary, we have shown that mtDNA copy number is tightly linked to
cell volume. In principle, this allows cells to maintain mtDNA concentrations during cell growth: if mtDNA copy numbers are set by cell volume at any point during the cell cycle, constant
concentrations can be achieved without any dedicated regulation of mtDNA replication with cell-cycle progression. This raises the question of how mtDNA copy number is coordinated with cell
volume. The abundance of most proteins increases with cell volume, maintaining constant concentrations36. This is thought to be due to not just an increased abundance of ribosomes37,38, but
also an increase of global transcription and thus amounts of mRNA39,40,41,42,43. One possible mechanism for the coupling of mtDNA number to cell volume is that, similar to most genes,
nuclear-encoded mitochondrial maintenance factors might have higher expression levels in larger cells. This could then lead to larger amounts of protein, potentially including those that
limit mtDNA maintenance. We therefore asked whether the expression of factors that are necessary for mtDNA maintenance increases with cell volume. First, we determined the dependence of
transcript concentration on cell volume for several nuclear-encoded mitochondrial factors. We re-analyzed by reverse-transcription qPCR (RT–qPCR) RNA samples of a Whi5-inducible strain grown
on SCGE that we have recently used to determine the concentration of histone transcripts as a function of cell volume27. As shown previously, the transcript concentration of the control
gene _ACT1_ is maintained at a nearly constant level. In accordance with the fact that the amount of mtDNA increases with cell volume, constant concentrations of _COX2_ and _COX3_
transcripts, two genes encoded by mtDNA, are maintained (Extended Data Fig. 1d). By contrast, the concentration of histone mRNA decreases in inverse proportion to cell volume to maintain
constant amounts of histone27. We found that the concentration of transcripts of all analyzed nuclear-encoded mitochondrial factors only slightly decreases with cell volume, resulting in
substantially increased amounts of transcripts in large cells (Fig. 4a). To validate this finding, we examined two published datasets36 that measured the dependence of transcripts on cell
size (1) in budded cells sorted by cell size (total protein content) using flow cytometry and (2) during the first cell cycle of cells released from G1 arrests of varying lengths of time.
Again, we found that, similar to most transcripts, the transcripts of factors involved in mtDNA maintenance are kept at largely cell-size-independent concentrations (Fig. 4b and Extended
Data Fig. 1c). Next, we asked whether the increasing transcript amounts lead to larger amounts of the corresponding proteins. Again, we made use of an analysis performed by Swaffer et al.36:
using previously published flow-cytometry data on a collection of strains in which each open reading frame (where possible) was tagged with green fluorescent protein (GFP)44, the dependence
of protein amounts on cell size was analyzed. Many mtDNA-maintenance factors were excluded from this dataset for technical reasons, in particular owing to low expression. However, for all
included mtDNA factors (Abf2, Mhr1, Pim1, Rpo41), the increase in protein amount with increasing cell size was similar to or stronger than the average of that for all measured proteins (Fig.
4c). To further confirm that the amount of protein necessary for mtDNA maintenance increases with cell volume, we constructed haploid strains in which we endogenously tagged the mtDNA
polymerase _MIP1_ as well as the mtDNA packaging factor _ABF2_ with _mCitrine_. We ensured that the tagged proteins were functional by testing growth on SCGE and measuring mtDNA
concentrations with qPCR (Extended Data Fig. 5). For Mip1-mCitrine, we found increased amounts of mtDNA (Extended Data Fig. 5c). However, because the strain shows the typical increase of
mtDNA copy number as cell volume increases, the mechanism ensuring dependence on cell volume is still intact, suggesting that the regulation of Mip1 with cell volume is not dramatically
impaired (Extended Data Fig. 5e). Using mCitrine fluorescence intensity as a proxy for protein amount and side scatter as a measure for cell volume (Extended Data Fig. 6), we determined the
cell-volume dependence of Mip1 and Abf2 protein amounts with flow cytometry. In accordance with the transcript measurements, we found that the amounts of Mip1-mCitrine and Abf2-mCitrine
strongly increase with cell volume (Fig. 4d,e). MIP1 AND ABF2 ARE LIMITING FOR MTDNA MAINTENANCE Our results suggest that, in larger cells, the proteins required for mtDNA replication and
maintenance are present at higher numbers. If those proteins limit mtDNA maintenance, meaning that a change in their abundance would cause a proportional change in the mtDNA copy number,
this could explain why larger cells have more mtDNA. To test whether this is the case, and if so, which proteins are limiting, we created a series of hemizygous diploid strains. In each
strain, we deleted one allele of a gene involved in mtDNA maintenance45, including Mip1 (ref. 9), Abf2 (ref. 8), the ssDNA-binding protein Rim1 (ref. 46), helicases47,48,49, and proteins
involved in DNA recombination50. Because most budding-yeast genes do not exhibit dosage compensation at the transcript51 or protein level52, hemizygous diploids in most cases show a 50%
decrease of the corresponding transcript and protein. Should this protein then be perfectly limiting for mtDNA maintenance, we would expect a 50% reduction of the mtDNA copy number (Fig.
5a). For each hemizygous strain, we performed qPCR experiments to measure the ratio of mtDNA to nuclear DNA copies. We also measured cell volume, but did not find any major changes (Extended
Data Fig. 7a). As shown in Figure 5b, we found that reducing the gene dosage of _MIP1_ and _ABF2_ had the strongest effect on mtDNA copy number. However, as validated by additional
independent experiments (Fig. 5c), even diploids that were hemizygous for _MIP1_ or _ABF2_ showed a reduction to only 79% or 69%, respectively. To rule out the possibility that we do not see
a reduction of mtDNA to 50% because _MIP1_ and _ABF2_ exhibit dosage compensation, we measured their expression level. For both hemizygotes, we did not observe clear evidence of dosage
compensation (Extended Data Fig. 7b–d)—consistent with a previous study found no evidence for protein-level dosage compensation in a strain that was heterozygous for fluorescently tagged
Abf2 (ref. 52). Taken together, the results of our work suggest that, although mtDNA copy number is sensitive to the concentration of several proteins, none of the proteins we tested is
perfectly limiting. MATHEMATICAL MODEL FOR CELL-VOLUME-DEPENDENCE OF MTDNA Because we found that the cell-volume-dependent increase of mtDNA cannot be simply explained by a proportional
increase of a single perfectly limiting factor, we used mathematical modeling to better understand how several partially limiting components of the mtDNA-maintenance machinery could
contribute to mtDNA homeostasis. Because _MIP1_ and _ABF2_ hemizygotes showed the strongest reduction of mtDNA, we focused on the role of only these two proteins, neglecting the smaller
contribution of other proteins. In essence, and ignoring cell-to-cell variability, mtDNA copy number depends on the rates of mtDNA replication, degradation, and dilution by cell growth.
Although Mip1 might also affect mtDNA stability through its reported exonuclease activity53, we aimed for a minimal model to understand the underlying principles and therefore considered
only its obvious role in replication. Similarly, Abf2 might also be important for both replication and stability of mtDNA. _abf2_∆ mutants grown on fermentable medium rapidly lose mtDNA.
Nevertheless, _abf2_∆ cells can be grown on non-fermentable medium, in which they can maintain a pool of mtDNA over many generations54, demonstrating that Abf2 is not essential for mtDNA
replication. Instead, the compaction of mtDNA mediated by Abf2 seems to be important for mtDNA stability, suggesting that including this function of Abf2 in the model could be sufficient. In
the model, we account for these considerations by describing replication as a process occurring at a rate that is determined by the concentrations of mtDNA (_n_) and of the mtDNA polymerase
Mip1 (_m_), such that the time derivative is \(\frac{{dn}}{{dt}}={k}_{\rm R}\frac{m}{{K}_{1}+\frac{m}{n}}\) (Fig. 6a,b). Here, _k_R and _K_1 describe the maximal rate of replication per
mtDNA and the dissociation constant of Mip1 and mtDNA. We assume that, at low concentrations, most polymerase is bound to mtDNA. Thus, Mip1 alone becomes limiting, and the mtDNA replication
rate is proportional to _m_ and independent of _n_. At high Mip1 concentrations, mtDNA becomes saturated, and the replication rate is proportional to _n_. Similarly, we model mtDNA
degradation as a process inhibited by increasing concentrations of Abf2 (_a_), such that \(\frac{{dn}}{{dt}}=-{k}_{\rm D}\frac{n}{{K}_{2}+\frac{a}{n}}\), where _k_D and _K_2 are constants
(Fig. 6a,c). We assume that Abf2 is tightly bound to mtDNA, and its stabilizing effect on mtDNA therefore depends on the Abf2/mtDNA concentration ratio. Assuming that mtDNA dilution follows
an exponential-growth pattern with a doubling time _T_, we can then balance replication, degradation, and dilution to obtain \(\frac{{dn}}{{dt}}={k}_{\rm
R}\frac{m}{{K}_{1}+\frac{m}{n}}-{k}_{\rm D}\frac{n}{{K}_{2}+\frac{a}{n}}-\frac{n\times\mathrm{ln}\;2}{T}\) (Fig. 6a). In steady state, \(\frac{{dn}}{{dt}}=0\), and we can then obtain an
equation directly linking the concentration of mtDNA to that of Mip1 and Abf2. MTDNA-MAINTENANCE MACHINERY CAN COUPLE MTDNA TO CELL VOLUME One direct implication of this result is that, if
the amounts of Mip1 and Abf2 increase in direct proportion to cell volume, thereby maintaining constant concentrations _a_ and _m_, the steady-state solution for the concentration of mtDNA,
_n_, is also independent of cell volume. In other words, the mtDNA copy number increases in direct proportion to cell volume (Fig. 6a). Thus, our simple model explains how an increasing
amount of mtDNA-maintenance machinery in bigger cells can couple mtDNA copy number to cell volume. Next, we asked whether our model explains the reduction of mtDNA observed in diploids
hemizygous for _MIP1_ or _ABF2_. In the model, deletion of one of the alleles of _MIP1_ or _ABF2_ can be accounted for by reducing _m_ or _a_, respectively, to 50%. Solving the steady-state
model, we then found that the effect of the hemizygous deletions strongly depends on the exact parameters chosen: we found parameters for which both hemizygotes cause a reduction to about
70% of mtDNA compared to the wild-type, reflecting our experimental results (Fig. 6d). However, faster replication (increased _k_R) will shift the system to a regime in which _MIP1_
hemizygotes show an almost 50% reduction, and _ABF2_ hemizygotes have nearly unchanged mtDNA amounts. By contrast, increasing the degradation rate _k_D results in the opposite behavior.
Thus, although our model is consistent with our experimental findings if parameters are chosen such that both the replication and degradation terms are not negligible and are sensitive to
_m_ and _a_, single hemizygote deletions are not well-suited to test the model. However, our model makes a prediction for the outcome of simultaneous manipulation of Mip1 and Abf2
concentrations: regardless of the chosen parameters, if _m_ and _a_ are changed by the same factor, the concentration of mtDNA follows proportionally (Fig. 6d, see also the ‘Model’ section
in the Methods). To test this prediction, we constructed a strain that was hemizygous for both _MIP1_ and _ABF2_. We verified with qPCR that expression of _MIP1_ and _ABF2_ was reduced to
50% (Extended Data Fig. 7b–d). As predicted, we found that the concentration of mtDNA is reduced by close to 50% (Fig. 7a). Because the model also predicts that the effect of the hemizygous
deletions should be independent of cell volume, we repeated the experiments with a Whi5-inducible strain. Consistent with the model, we found that for the single and double hemizygotes,
mtDNA copy numbers increase with cell volume, with similar relative reduction of mtDNA by the hemizygous deletions at all cell volumes (Fig. 7b). Similar to a simultaneous reduction of Mip1
and Abf2 concentrations, our model predicts that the mtDNA concentration should increase by twofold if both Mip1 and Abf2 are overexpressed by twofold. To test this, we constructed haploid
strains in which we endogenously integrated additional copies of the _MIP1_ and/or _ABF2_ genes (Fig. 7c), resulting in a twofold increase of _MIP1_ and _ABF2_ expression, respectively
(Extended Data Fig. 7e-g). We find that overexpression of either Mip1 or Abf2 results in a moderate increase of mtDNA concentration, and simultaneous overexpression of both has an additive
effect (Fig. 7d). Repeating the experiment in a Whi5-inducible strain revealed that the proportional scaling of mtDNA amount with cell volume is maintained in each strain (Fig. 7e).
Importantly, simultaneous twofold overexpression of Mip1 and Abf2 results in only a 57% increase of mtDNA, which is less than the twofold increase predicted by our simple model. This
suggests that, upon overexpression of the most limiting factors for mtDNA maintenance, Mip1 and Abf2, other proteins that were not included in the model become limiting. Given our analysis
(Fig. 4), it seems likely that the amount of those additional factors also increases in proportion to cell volume. In contrast to the selective overexpression of only Abf2 and Mip1 we
achieved through the additional gene copies, a twofold increase of cell volume would then still maintain Mip1 and Abf2 as major limiting factors, coupling mtDNA copy number to cell volume.
DISCUSSION In summary, we find that in budding yeast, mtDNA copy number is tightly coupled to cell volume, both in arrested cells growing in G1 and asynchronously cycling cell populations.
This is consistent with early work showing that mtDNA amount per cell increases during G1 arrest15,18 and with the volume of stationary cells55. Because the coupling of mtDNA copy number to
cell volume can maintain constant mtDNA concentrations independent of cell-cycle stage, it provides an elegant mechanism for cells to maintain mtDNA homeostasis during cell growth, without
requiring a coordination of mtDNA replication with the cell cycle. Interestingly, this strategy for DNA maintenance is opposite of that for nuclear DNA, whose replication is strictly coupled
to cell-cycle progression but not to cell volume. On the basis of our results, we propose a mechanism that can quantitatively explain the increase of mtDNA amount with cell volume: mtDNA
concentration is determined by the rates of replication, degradation, and dilution by cell growth. Both replication and mtDNA stability can depend on mtDNA maintenance factors in a
dose-dependent manner. Larger cells have overall more proteins, and also a higher amount of mtDNA replication and maintenance factors. As a consequence, larger cells can maintain more mtDNA
(Fig. 8). A single perfectly limiting mtDNA-maintenance factor could directly lead to mtDNA amounts increasing in proportion to cell volume, for example if larger cells had proportionally
more mtDNA polymerase and the mtDNA replication rate increased in proportion to polymerase number. However, our experiments suggest that no single protein is perfectly limiting. Instead, we
identified two partially limiting factors, Mip1 and Abf2. To obtain a conceptual understanding of how several partially limiting factors, each of which is nuclear encoded and increases in
amount with cell volume, affect mtDNA numbers, we built a minimal mathematical model describing the contribution of mtDNA replication, degradation, and dilution by growth. In the model,
replication and degradation are promoted and prevented, respectively, by the most limiting factors Mip1 and Abf2. We find that, even in a situation in which neither Mip1 nor Abf2 is
perfectly limiting, they synergistically cause an increase in mtDNA amount proportional to cell volume. The model correctly predicts the ~50% decrease of mtDNA amount in diploids that are
hemizygous for _MIP1_ and _ABF2_. This suggests that, if the most limiting factors Mip1 and Abf2 are both reduced below wild-type levels, all other factors are present in excess and thus
have only a weak additional limiting contribution to mtDNA maintenance. By contrast, twofold overexpression of Mip1 and Abf2 leads to a stronger deviation from the simple model, in
accordance with other factors becoming partially limiting. At this point, we do not think it is helpful to extend our model to additional factors because the exact molecular mechanisms of
their contribution, including rate constants, are not known. However, it seems likely that adding additional gene copies of the other limiting factors will result in a further increase of
mtDNA concentration, eventually reaching a twofold increase. Because increasing cell volume likely causes an increasing abundance of all limiting factors, their combined effect is needed to
fully explain the coordination of mtDNA amount and cell volume. Although we identify a mechanism coupling mtDNA amount to cell volume, additional mechanisms can modulate mtDNA homeostasis,
for example as an adaptation to changing environments, such as the lower mtDNA concentration of cells grown on a fermentable medium than in those grown on a non-fermentable medium. Within
the framework of the model, this can be achieved by regulating either the concentration of limiting factors or the rate constants (Extended Data Fig. 8). For example, Mrx6 was proposed to
modulate mtDNA concentration through its role in degradation of factors involved in mtDNA replication6. Moreover, although our proposed mechanism achieves mtDNA homeostasis without
cell-cycle-dependent regulation, we cannot exclude modest modulation by the cell cycle. Notably, in parasitic kinetoplastids such as _Trypanosoma_ _brucei_56, mtDNA replication is strongly
coupled to the cell cycle, suggesting that some organisms could use cell-cycle regulation as an additional level of regulation. In fact, both _MIP1_ and _ABF2_ expression exhibit weak
cell-cycle dependence57, which would propagate to mtDNA amounts in our model. Our study reveals that, in addition to mitochondrial network volume19, mtDNA amount increases with cell volume.
We provide evidence that the coupling of the mitochondrial network volume and mtDNA to cell volume occurs through independent pathways. However, our results indicate that nucleoid number
also depends directly on mitochondrial network volume. In addition, we did not observe major changes in mitochondrial diameter or ultrastructure with increasing cell volume, consistent with
the weak dependence of mitochondrial structure on cell volume in mouse cells21. However, even in the absence of major structural changes, mitochondrial function, including respiratory
activity, might be modulated by cell size. Previous work in mammalian cells has shown that, although mitochondrial mass increases with cell volume, mitochondrial function is optimal at an
intermediate cell volume21,22. Similarly, molecular reorganization could modulate mitochondrial function in yeast such that optimal function is achieved at intermediate volumes. In essence,
the mechanism that we propose for mtDNA homeostasis requires only that the limiting components of the mtDNA-maintenance machinery increase in abundance with cell volume. One key feature is
that this mechanism is robust to fluctuations in mtDNA concentration. Because steady-state concentrations of mtDNA are set by the concentrations of the nuclear-encoded limiting factors,
which are themselves independent of mtDNA concentration, cells with excess or low levels of mtDNA will regress back to the steady state without an active feedback mechanism. Indeed, such
passive regression to the mean has been observed for nucleoid numbers in fission yeast24. We anticipate that mtDNA homeostasis achieved through limiting nuclear-encoded machinery is
conserved across eukaryotes. However, the identity of the most limiting factors might vary between organisms. For example, in animals, the Abf2 homolog TFAM7,58,59 and the mitochondrial
helicase Twinkle10 have a strong dose-dependent effect on mtDNA copy number. Further supporting our hypothesis, a recent study has revealed that the amount of many mitochondrial proteins,
including TFAM, increases with increasing volume of human epithelial cells60. More generally, the increase of global protein amounts with cell size owing to increased biosynthetic capacity
is widely conserved across eukaryotes. Thus, limiting nuclear-encoded genes provide a robust mechanism to achieve mtDNA homeostasis in growing cells. METHODS YEAST STRAINS All yeast strains
used in this work are derived from W303 and listed in Supplementary Table 2. Construction of yeast strains was performed with standard methods; plasmids are listed in Supplementary Table 3.
Transformants were verified by control PCRs and sequencing. Microscopy strains (haploid, diploid, ρ0) were generated from parental strains containing LacO arrays in mtDNA (yCO380, yCO381)23.
Endogenous _WHI5_ was deleted in yCO380 and β-estradiol-inducible _WHI5_ was integrated (KSE113-1), followed by endogenous integration of a plasmid carrying the β-estradiol transcription
factor (FRP880)25, resulting in strain ASY11-2B. Next, the plasmid ASE001-5 containing _mKate2_ and _LacI_ tagged with two copies of _mNeon_ was integrated into the HO locus to obtain strain
ASY13-1. To generate the diploid strain ASY15-1, yCO381 was transformed with ASE001-5 and crossed with ASY11-2B. YEAST CULTURING All strains were grown at 30 °C in a shaking incubator at
250 r.p.m. (Infors, Ecotron). Prior to growing cells on non-fermentable medium (synthetic complete medium containing 2% glycerol and 1% ethanol, SCGE), strains were grown for at least 6 h on
YPD. Then, cells were washed with SCGE and transferred into SCGE. Cultures were grown for about 24 h in exponential phase when directly used for experiments, or were grown for at least 12 h
before β-estradiol was added to Whi5-inducible strains. To tune Whi5 concentration in Whi5-inducible strains, cells were grown for another 24 h in the presence of the respective β-estradiol
concentration. For haploid strains, concentrations of 0 nM, 10 nM, and 30 nM of β-estradiol were used; for diploids, concentrations of 0 nM, 15 nM, and 60 nM were used. When fermentable
medium was used, cells were directly inoculated in synthetic complete medium containing 2% dextrose (SCD) and were grown for at least 12 h before β-estradiol was added. For both haploid and
diploid strains, concentrations of 0 nM, 15 nM, 60 nM, and 150 nM β-estradiol were added, and cells were grown for an additional 24 h. For the G1 arrest (Fig. 1c), a _cln1/2/3_ deletion
strain, in which Cln1 was expressed using a β-estradiol-inducible promoter, was used29. Before G1 arrest, cells were grown at least 6 h on YPD with 30 nM β-estradiol, transferred into SCGE
with 30 nM β-estradiol, and grown for about 24 h. To perform experiments in fermentable conditions, cells were directly inoculated in SCD medium with 60 nM β-estradiol and grown for 24 h. To
initiate G1 arrest, cells were washed with the respective medium without hormone, and cultures were then collected every hour (SCGE, 0–8 h; SCD, 0–6 h). Steady-state exponential-growth
conditions were obtained by regularly measuring optical densities using a spectrophotometer (NanoDrop OneC, Thermo Fisher Scientific) and ensuring that the optical density at 600 nm (OD600)
was <1 through appropriate dilutions. To determine mean cell volumes of cell populations, cell-volume distributions were measured using a Coulter counter (Beckman Coulter, Z2 Particle
Counter) after sonication. Samples were measured twice with two different settings (Range 1: 10–328 fL, gain: 256, current: 0.707 ma; Range 2: 328–1,856 fL, gain: 256, current: 0.125 ma). We
then used both measurements to calculate a mean volume within the combined cell volume range. MTDNA COPY NUMBER MEASUREMENTS Cells were cultivated in 50 mL of the respective medium with
corresponding β-estradiol concentrations. Prior to collection, cell volume distributions and optical density were measured. Cell cultures were spun at 3,400_g_, and pellets were washed with
1 mL double-distilled water. gDNA was extracted by phenol-chloroform-isoamyl alcohol (PCI) extraction. More precisely, cells were mechanically disrupted by vortexing at 3,000 oscillations
per minute (Mini-BeadBeater 24, 230 V, BioSpec Products) with glass beads in 200 µL DNA extraction buffer, pH 8.0 (2% Triton X-100, 1% SDS, 100 mM NaCl, 10 mM TRIS, 1 mM EDTA) and 200 µL
PCI. After centrifugation at 16,000_g_, the aqueous phase was taken and gDNA was precipitated with 500 µL 100% ethanol. Centrifugation was then repeated, and the pellet was washed with 800
µL 70% ethanol. To remove RNA residues, the pellet was dissolved in nuclease-free water, treated with 1 mg mL–1 RNase A (DNase-free), and incubated for 30 min at 37 °C. Subsequently, DNA
extraction buffer and PCI were added, and extraction steps were repeated. DNA concentrations were determined with a spectrophotometer (NanoDrop OneC, Thermo Fisher Scientific) through
measurements at 260 nm. For qPCR, 1 ng DNA was used. qPCR was performed on a LightCycler 480 Multiwell Plate 96 (Roche). For amplification, a DNA-binding fluorescent dye (BioRad, SsoAdvanced
Universal SYBR Green Supermix) and specific primers for the nuclear DNA (nDNA) genes _ACT1_, _MIP1_, and _MRX6_ and the mtDNA genes _COX2_ and _COX3_ (Supplementary Table 4) were used. For
strains in which _MIP1_ copy number was manipulated, _MIP1_ primers were omitted from the analysis. The initial denaturation time was set to 10 min. Each sample was measured in technical
triplicates. For further analysis, mean Cq values of the technical replicates were used. Single technical replicates were excluded from the analysis when the s.d. was higher than 0.5. To
correct for differences in primer efficiencies and enable absolute measurements of DNA concentrations, a calibration standard was obtained by constructing a single PCR product containing all
amplified sequences. A standard dilution series with defined input concentrations (1 × 10⁻⁴–1 pg µL–1) was then performed to obtain a standard curve for each primer pair. A linear fit to
these calibration curves was finally used to calculate concentrations from qPCR measurements (Extended Data Fig. 9). Concentrations of each gene were calculated, and nDNA concentrations
(based on _ACT1_, _MIP1_, _MRX6_) and mtDNA concentrations (_COX2_, _COX3_) were pooled by calculating the means. mtDNA concentrations were then normalized to nDNA, to obtain the relative
mtDNA copy number per nDNA. By counting buds through visual inspection, a budding index (the percentage of budded cells, %buds) was determined for each cell population and used to calculate
the average nDNA amount per cell: \(\frac{\rm{nDNA}\left(\rm{haploids}\right)}{\rm{cell}}=\frac{\left( \% \rm{buds}\times 2\right)+\left( \% \rm{no}-\rm{buds}\times 1\right)}{100}\) or
\(\frac{\rm{nDNA}\left(\rm{diploids}\right)}{\rm{cell}}\) \(=\frac{\left( \% \rm{buds}\times 4\right)+\left( \% \rm{no}-\rm{buds}\times 2\right)}{100}\). Here, %no-buds refers to the
percentage of unbudded cells. Multiplication of this average nDNA amount per cell with mtDNA copies per nDNA then allowed us to determine the average mtDNA copy number per cell. For
statistical analyses, we performed a Shapiro–Wilk test at a confidence level of _α_ = 0.05 to test whether the distributions were normally distributed. MRNA MEASUREMENTS RNA samples in
Figure 4a were taken from experiments performed by Claude et al.27 (Fig. 2d). Briefly, cells were cultivated in 25 mL of the respective medium (YPD and then SCGE) and grown as described
above. RNA was extracted by hot acidic phenol (Sigma-Aldrich) and chloroform (Thermo Fisher Scientific) extraction. RNA extraction in Extended Data Figures 1, 5, and 7 was performed with the
YeaStar RNA Kit (Zymo Research), following the instructions of the given protocol. DNA contaminations were removed by a DNA digestion step using DNaseI (Life Technologies). cDNA was
synthesized using 1,000 ng total RNA and random primers, following the high-capacity cDNA reverse-transcription kit protocol (Thermo Fisher Scientific). mRNA expression levels of _ACT1_ and
_HTA1_ were taken from Claude et al.27 (Fig. 2d). mRNA expression levels of _MIP1_, _ABF2_, _PIM1_, _MTF1_, _RPO41_, and _MRX6_ were measured by qPCR using the fluorescent dye SybrGreen for
detection. Two microliters of a 1:10 dilution of cDNA was used, except for the ribosomal RNA _RDN18_, for which 2 µL of a 1:200 dilution was used. Each sample was measured in triplicate, and
concentrations were calculated after normalization to _RDN18_. ANALYSIS OF TRANSCRIPT AND PROTEIN CELL-SIZE DEPENDENCE BASED ON SWAFFER ET AL.36 To compare the cell-size dependence of
mtDNA-maintenance-factor transcripts (_ABF2_, _HMI1_, _MGM101_, _MHR1_, _MIP1_, _MRX6_, _MTF1_, _PIF1_, _PIM1_, _RAD53_, _RIM1_, _RPO41_, _RRM3_) with that of scaling control genes (_ACT1_
and the RNA polymerase II subunits _RPB2_, _RPB3_, _RPB4_, _RPB5_, _RPB7_, _RPB8_, _RPB9_, _RPB10_, _RPB11_, _RPO21_) and the sub-scaling histones (_HHF1_, _HHF2_, _HHO1_, _HHT1_, _HTA1_,
_HTA2_, _HTB1_, _HTB2_, _HTZ1_), we analyzed two datasets published by Swaffer et al.36. For the first dataset, budded cells were sorted into four size bins using a total protein stain as a
measure for cell size and were then analyzed with RNA sequencing. We compared the ratio (mean of two independent replicates) between the relative expression levels in the largest and
smallest cells. For the second dataset, cells were elutriated and arrested in G1 for different amounts of time before synchronous release, resulting in different cell volumes at the time of
cell-cycle entry. The temporal evolution of the transcriptome during cell-cycle progression was then analyzed with RNA sequencing. The relative expression throughout the cell cycle was
calculated as the AUC of the expression-level time course (after applying a spline). We compared the ratio between the largest and smallest cells (mean of two independent replicates). On the
basis of combined analysis of both datasets, all mtDNA factors that we analyzed were classified as ‘scaling’ by Swaffer et al. In the first dataset (but not the second), _RAD53_ showed a
strongly increased expression in big cells, which we attributed to its strong cell-cycle dependence. We therefore excluded _RAD53_ from further analysis. Of the mtDNA-maintenance factors
described above, Abf2, Mhr1, Pim1, and Mhr1 are included in the Swaffer et al. analysis of the dependence of protein amount on cell volume, on the basis of flow-cytometry measurements of
strains carrying GFP-tagged alleles of the respective proteins performed by Parts et al.44. Briefly, the normalized slope of GFP intensity as a function side scatter was used to estimate the
cell-volume-dependence of the protein amount. Proteins maintained at a perfectly constant amount would be expected to exhibit a slope of 0, whereas proteins maintained at a constant
concentration would exhibit a slope of 1. Parts et al. performed two independent biological replicates, which we analyzed separately. MICROSCOPY For imaging, coverslips (µ-Slide 8 Well,
ibi-Treat, ibidi) were covered with 200 µL concanavalin A (conA, 1 mg mL–1 in H2O) and incubated for 5–10 min. The wells were then washed twice with water and air dried. Cells were
cultivated as described in 5 mL medium. Then, 1 mL of the culture was sonicated and 200 µL was transferred to the conA-covered well. The cells were then allowed to settle for about 5 min
before the supernatant was removed and the wells were washed twice with medium. Then 200 µL medium was used to cover the wells. Live-cell fluorescence microscopy experiments were performed
on a Zeiss LSM 800 confocal microscope (software: Zen 2.3, blue edition) equipped with an Axiocam 506 camera, using the confocal mode. Images were taken using a 63x/1.4 Oil DIC objective.
_Z_-stacks were acquired over 15.05 µm in 0.35-µm increments. mKate2 was imaged with an excitation wavelength of 561 nm, and detecting emission between 610 and 700 nm. mNeon was excited at
488 nm and detected between 410 and 546 nm. Bright-field images were taken using the transmitted light detector (T-PMT). CELL SEGMENTATION Cell segmentation was performed using Cellpose v0.6
(ref. 61), with the ‘cell diameter’ parameter set to 50 pixels, ‘flow threshold’ set to 0.4, and ‘cell probability threshold’ set to 0. Cell-ACDC30 was used to manually correct
segmentation, annotate buds to their corresponding mother cells, and calculate cell volume. NUCLEOID COUNTING AND MITOCHONDRIAL NETWORK SEGMENTATION To count the number of nucleoids and
compute the mitochondrial network volume from confocal 3D Z-stack images, we developed a custom routine written in Python (https://github.com/SchmollerLab/SeelMito/releases/tag/v1.0).
Mitochondrial network segmentation and spot detection were performed in 3D. The analysis steps are: (1) Application of a 3D gaussian filter with a small sigma (0.75 voxel) of both the
nucleoids and mitochondria signals. (2) Instance segmentation of the mitochondria signal using automatic Li thresholding62 (threshold_li function from the library scikit-image63). (3)
Normalization of the mitochondria signal using the median of the voxel intensities classified as mitochondria in step 2. (4) 3D local maxima detection (peaks) in the nucleoids signal using
the peak_local_max function from the Python library scikit-image. (5) Discarding of peaks that are below a threshold value determined with the automatic Li thresholding algorithm. (6)
Discarding of overlapping peaks. If two or more peaks are within a resolution-limited volume, only the peak with highest intensity was retained. The resolution-limited volume was determined
as a spheroid with \(x\) and \(y\) radii equal to the Abbe diffraction limit and the \(z\) radius equal to 1 µm. With a numerical aperture of 1.4 and mNeon emission wavelength of about 509
nm, the resolution-limited volume has radius \(x=y=0.222\,{\rm{\mu m}}\). (7) The remaining peaks undergo a subsequent iterative filtering routine. (a) Each voxel classified as mitochondria
in step 2 is further classified as inside or outside of the nucleoids. A voxel is outside of the nucleoid if it is not within the resolution-limited volume centered at the peak coordinates.
(b) The nucleoids signal is normalized by the mean of the voxel intensities classified as outside of the nucleoids (step 7a). (c) The normalized intensity distribution of the voxels inside
each nucleoid volume is compared with the same voxels from the mitochondria signal. The comparison is performed with a Welch’s _t_-test and if the _P_ value is above 0.025 or the
_t_-statistic is negative (that is, the mitochondria signal is higher than the nucleoid signal), the peak is discarded. Here, we verified that the analysis is robust to choosing different
_P_ values (0.001 or 0.05). (d) Steps a to c are repeated until the number of nucleoids stops changing. The assumption of comparing the nucleoids signal to the mitochondria signal is that a
peak is a valid nucleoid only if it has an intensity that is significantly higher than the corresponding mitochondria signal (after normalization). The resulting peaks are considered valid
nucleoids and are therefore counted. The mitochondrial network volume is computed as the sum of the voxels classified as mitochondria in step 2. Note that owing to the optical resolution
limit, the width of the network is not measured accurately with confocal microscopy and the obtained mitochondria network volume is therefore not an absolute measure for the physical volume
of the mitochondria. To enhance visualization of the mitochondrial network in the representative microscopy images in Figures 2b and 3b, we computed the skeletons from the 3D network
semantic segmentation masks. This was achieved with the Lee algorithm64 (implemented in the Python library scikit-image). Briefly, this algorithm performs several morphological operations
(erosions) aimed at thinning the segmentation volume to a single-pixel wide skeleton. Skeletons were used only for visualization purposes. To verify that the mitochondrial network and
nucleoid detection algorithm detects real signal, we computed the stain index, and compared it with a negative control without fluorescent proteins (Extended Data Fig. 10a,b). Through
comparison with our qPCR results, and supporting the accuracy of our nucleoid detection algorithm, we find that, on average, each nucleoid contains about two copies of mtDNA, which is in
agreement with previous studies6,65 (Extended Data Fig. 2b). Moreover, we compared the results of our mitochondrial network quantification with that obtained with MitoGraph19,66, and found
very high correlation (Extended Data Fig. 10c). Finally, to compute the number of mitochondrial network fragments shown in Extended Data Figure 4b, we labeled the 3D network semantic
segmentation masks using connected-component labeling to obtain the corresponding instance segmentation masks. This allows counting the number of distinct objects (fragments) within each
cell. ELECTRON MICROSCOPY For cell-volume quantification, a sample was taken from each culture before the cells were prepared for electron microscopy. These samples were analyzed by light
microscopy, and DIC images of living cells were taken using a Zeiss Axiophot microscope equipped with a Plan-Neofluar 100x/1.30 Oil objective (Carl Zeiss Lichtmikroskopie) and a Leica DFC360
FX camera operated with the Leica LAS AF software version 2.2.1 (Leica Microsystems). Cell segmentation and volume estimation were performed using Cell-ACDC30 as described above. Fixation
of yeast cells for electron microscopy with glutaraldehyde and potassium permanganate was performed as described in ref. 67 with the following changes: glutaraldehyde fixation was performed
with 3% glutaraldehyde, 0.1 M sodium cacodylate, 1 mM CaCl2, pH 7.2, and the samples were subsequently washed with 0.1 M sodium cacodylate, 1 mM CaCl2, pH 7.2. Treatment with potassium
permanganate was either performed before (cells grown in SCD) or after (cells grown in SCGE) embedding in agar. After treatment with sodium metaperiodate and overnight staining with 2%
uranyl acetate at room temperature, dehydration of chemically fixed yeast cells with ethanol and propylene oxide, Epon infiltration, and contrast enhancement of ultrathin sections were
essentially performed as described in ref. 68, with the following modifications: all dehydration steps were performed at 4 °C, Epon infiltration was performed at room temperature, and
contrast enhancement of ultrathin sections was performed for 15 min with 2% uranyl acetate and for 3 min with lead citrate. Electron micrographs were taken using a JEOL JEM-1400 Plus
transmission electron microscope operated at 80 kV, a 3,296 × 2,472 pixels JEOL Ruby CCD camera, and the TEM Center software, either v1.7.12.1984 or v1.7.19.2439 (JEOL). As an estimate of
mitochondrial diameter, the length of the minor axis of 100 mitochondria was measured for each sample from electron micrographs using Fiji69. FLOW CYTOMETRY Wild-type cells in which Mip1 or
Abf2 were endogenously tagged with mCitrine were analyzed with flow cytometry to determine the dependence of Mip1 and Abf2 protein amounts on cell volume. Cells were cultured as described
above. After 16–20 h of growth on SCGE, cultures were diluted and split into three technical replicates. For control measurements shown in Extended Data Figure 6a,b, ß-estradiol was added.
Optical density was measured with a spectrophotometer (NanoDrop OneC, Thermo Fisher Scientific) and only cultures with OD600 < 0.9 were included in the flow cytometry measurements.
Cultures were kept on ice until measurement. After sonication for 10 s, the mean cell volume of each culture was determined using a Coulter counter. The flow cytometry measurement was
performed on a CytoFlex S Flow Cytometer (Beckman Coulter) with CytExpert 2.4 and the parameters FSC-A, SSC-A, and total fluorescence intensity using the FITC channel (excitation at 488 nm
and detection with a 525/40 nm filter) were recorded. Cells were analyzed at a slow flow rate (10 µL min–1) and data were collected from 50,000 events per sample. Through a standard gating
strategy (Extended Data Fig. 6d), cell debris, particles, and doublets were excluded from the analysis. Identical settings were used for all measurements. To correct for the autofluorescence
of yeast cells, the parent strain without the mCitrine tag was measured. After confirming that differences between technical replicates were negligible, the three replicates measured on one
day were pooled and binned according to SSC-A, which is a good proxy for cell volume (Extended Data Fig. 6). To correct for autofluorescence, for each bin, the mean signal of the
autofluorescence control was subtracted from the mean signal of the fluorescent strain in the same bin. This analysis was repeated for data obtained on a different day (three technical
replicates each). Background-corrected signals obtained on each day were then averaged. For each bin, the maximum (minimum) of the two signals plus (minus) the s.e. associated with the
measurement of the fluorescent strain was used to obtain an estimate of the experimental error. MODEL To better understand the effect of limiting mtDNA-maintenance machinery on
cell-volume-dependent mtDNA concentration (_n_), we built a minimal mathematical model, neglecting cell-to-cell variability and any potential contributions of asymmetric mtDNA inheritance
between mother cells and their buds. We assumed that the rate of mtDNA replication is given by the concentrations of mtDNA polymerase Mip1 (_m_) as well as the mtDNA concentration, such that
the synthesis rate can be described by \(\frac{{dn}}{{dt}}={k}_{\rm R}\frac{m}{{K}_{1}+\frac{m}{n}}\). In the limit of saturating Mip1 concentrations, the synthesis rate approaches the
constant _k_R multiplied by the concentration of mtDNA. At low Mip1 concentrations, under which we assume that most Mip1 is bound to mtDNA, replication is limited by the polymerase Mip1 and
thus the synthesis rate increases in direct proportion with _m_. _K_1 describes the dissociation constant of Mip1 and mtDNA. In addition, we assume that in the absence of Abf2, each mtDNA
molecule is degraded with a rate \(\frac{{k}_{\rm D}}{{K}_{2}}\), where _k_D and _K_2 are again constants. Increasing concentrations of Abf2 (_a_) then stoichiometrically protect mtDNA from
degradation, such that the total rate of mtDNA degradation can be described by \(\frac{{dn}}{{dt}}=-{k}_{\rm D}\frac{n}{{K}_{2}+\frac{a}{n}}\). Here, we assume that most Abf2 is bound to
mtDNA, and that its stabilizing effect depends on it being bound. As a consequence, the degradation rate depends on the stoichiometry between Abf2 and mtDNA. Finally, we account for the fact
that mtDNA is diluted by cell growth by assuming exponential growth with a doubling time _T_. Combining the contributions of replication, degradation, and dilution, we then find that:
$$\frac{dn}{dt}={k}_{\rm R}\frac{m}{{K}_{1}+\frac{m}{n}}-{k}_{\rm D}\frac{n}{{K}_{2}+\frac{a}{n}}-\frac{n\times \ln 2}{T}$$ In steady state, \(\frac{{dn}}{{dt}}=0\), so that: $$0={k}_{\rm
R}\frac{m}{{K}_{1}+\frac{m}{n}}-{k}_{\rm D}\frac{n}{{K}_{2}+\frac{a}{n}}-\frac{n\times \ln 2}{T}$$ From this equation, it can be immediately seen that as long as the concentrations of Mip1
and Abf2 are constant, that is that the amounts of Mip1 and Abf2 increase in proportion to cell volume, then the concentration of mtDNA is maintained constant, that is the mtDNA copy number
increases in proportion to cell volume. In addition to the trivial solution \(n=0\), the steady-state equation leads to a second-order polynomial equation:
$$\begin{array}{l}{n}^{2}({K}_{1}{K}_{2}\,\ln 2+{K}_{\rm D}{K}_{1}T)+n(a{K}_{1}\,\ln 2-{K}_{2}m{K}_{\rm R}T+{K}_{2}m\,\ln 2+{K}_{\rm D}mT)\\+(am\,\ln 2-am{K}_{\rm R}T)=0\end{array}$$ To
understand the impact of hemizygous _MIP1_ and _ABF2_ deletions, we then chose specific parameters (‘wild-type’: _m_ = 5, _a_ = 100, _T_ = 150, _k_R = 0.01 or 0.1, _k_D = 1 or 10, _K_1 = 5,
_K_2 = 100), and solved the steady-state equation using _Matlab_. Although the model is not meant to accurately reflect the quantitative details of budding yeast cells, the parameters are
chosen such that the relative ratios of _m_, _a_, and _n_ are roughly in the range expected from our measurements and previous estimates70. If _m_ and _a_ are increased or decreased by the
same factor, as for example in the double hemizygous strain, our model leads to a proportional change of the mtDNA concentration _n_. This would be true for any other model of the form:
$$\frac{dn}{dt}=n\,f\left(\frac{m}{n}\right)-n\,g\left(\frac{a}{n}\right)-\frac{n\times \ln 2}{T}$$ in which the replication and degradation terms \(f\left(\frac{m}{n}\right)\) and
\(g\left(\frac{a}{n}\right)\) depend only on the ratios of Mip1 and Abf2 concentrations, respectively, and mtDNA concentration. Deviations from such behavior would for example occur, if our
assumption that at low Mip1 concentrations unbound Mip1 can be neglected, does not hold true. REPORTING SUMMARY Further information on research design is available in the Nature Portfolio
Reporting Summary linked to this article. DATA AVAILABILITY Source data for Figures. 1–5 and 7 and Extended Data Figures 1–7, 9, and 10 are provided with this paper. Raw
fluorescence-microscopy data are available at: https://www.ebi.ac.uk/biostudies/BioImages/studies/S-BIAD709. Strains and other data that support this study are available from the
corresponding author upon reasonable request. Source data are provided with this paper. CODE AVAILABILITY Cell-ACDC is available at: https://github.com/SchmollerLab/Cell_ACDC. Custom code
used for quantification of mitochondrial networks and nucleoids is available at: https://github.com/SchmollerLab/SeelMito/releases/tag/v1.0. REFERENCES * Sclafani, R. A. & Holzen, T. M.
Cell cycle regulation of DNA replication. _Annu. Rev. Genet._ 41, 237–280 (2007). Article CAS PubMed PubMed Central Google Scholar * Ekundayo, B. & Bleichert, F. Origins of DNA
replication. _PLoS Genet._ 15, e1008320 (2019). Article CAS PubMed PubMed Central Google Scholar * Gustafsson, C. M., Falkenberg, M. & Larsson, N.-G. Maintenance and expression of
mammalian mitochondrial DNA. _Annu. Rev. Biochem._ 85, 133–160 (2016). Article CAS PubMed Google Scholar * Aretz, I., Jakubke, C. & Osman, C. Power to the daughters—mitochondrial and
mtDNA transmission during cell division. _Biol. Chem._ 401, 533–546 (2020). Article CAS PubMed Google Scholar * Kukat, C. et al. Super-resolution microscopy reveals that mammalian
mitochondrial nucleoids have a uniform size and frequently contain a single copy of mtDNA. _Proc. Natl Acad. Sci. USA_ 108, 13534–13539 (2011). Article CAS PubMed PubMed Central Google
Scholar * Göke, A. et al. Mrx6 regulates mitochondrial DNA copy number in _Saccharomyces cerevisiae_ by engaging the evolutionarily conserved Lon protease Pim1. _Mol. Biol. Cell_ 31,
527–545 (2020). Article PubMed PubMed Central Google Scholar * Ekstrand, M. I. et al. Mitochondrial transcription factor A regulates mtDNA copy number in mammals. _Hum. Mol. Genet._ 13,
935–944 (2004). Article CAS PubMed Google Scholar * Zelenaya-Troitskaya, O., Newman, S. M., Okamoto, K., Perlman, P. S. & Butow, R. A. Functions of the high mobility group protein,
Abf2p, in mitochondrial DNA segregation, recombination and copy number in _Saccharomyces cerevisiae_. _Genetics_ 148, 1763–1776 (1998). Article CAS PubMed PubMed Central Google Scholar
* Stumpf, J. D. et al. mip1 containing mutations associated with mitochondrial disease causes mutagenesis and depletion of mtDNA in _Saccharomyces cerevisiae_. _Hum. Mol. Genet._ 19,
2123–2133 (2010). Article CAS PubMed PubMed Central Google Scholar * Tyynismaa, H. et al. Twinkle helicase is essential for mtDNA maintenance and regulates mtDNA copy number. _Hum. Mol.
Genet._ 13, 3219–3227 (2004). Article CAS PubMed Google Scholar * Taylor, S. D. et al. The conserved Mec1/Rad53 nuclear checkpoint pathway regulates mitochondrial DNA copy number in
_Saccharomyces cerevisiae_. _Mol. Biol. Cell_ 16, 3010–3018 (2005). Article CAS PubMed PubMed Central Google Scholar * Lee, S., Kim, S., Sun, X., Lee, J.-H. & Cho, H. Cell
cycle-dependent mitochondrial biogenesis and dynamics in mammalian cells. _Biochem. Biophys. Res. Commun._ 357, 111–117 (2007). Article PubMed Google Scholar * Chatre, L. & Ricchetti,
M. Prevalent coordination of mitochondrial DNA transcription and initiation of replication with the cell cycle. _Nucleic Acids Res._ 41, 3068–3078 (2013). Article CAS PubMed PubMed
Central Google Scholar * Sasaki, T., Sato, Y., Higashiyama, T. & Sasaki, N. Live imaging reveals the dynamics and regulation of mitochondrial nucleoids during the cell cycle in
Fucci2-HeLa cells. _Sci. Rep._ 7, 11257 (2017). Article PubMed PubMed Central Google Scholar * Petes, T. D. & Fangman, W. L. Preferential synthesis of yeast mitochondrial DNA in
alpha factor-arrested cells. _Biochem. Biophys. Res. Commun._ 55, 603–609 (1973). Article CAS PubMed Google Scholar * Wells, J. R. Mitochondrial DNA synthesis during the cell cycle of
_Saccharomyces cerevisiae_. _Exp. Cell. Res._ 85, 278–286 (1974). Article CAS PubMed Google Scholar * Newlon, C. S. & Fangman, W. L. Mitochondrial DNA synthesis in cell cycle mutants
of _Saccharomyces cerevisiae_. _Cell_ 5, 423–428 (1975). Article CAS PubMed Google Scholar * Conrad, M. N. & Newlon, C. S. The regulation of mitochondrial DNA levels in
_Saccharomyces cerevisiae_. _Curr. Genet._ 6, 147–152 (1982). Article CAS PubMed Google Scholar * Rafelski, S. M. et al. Mitochondrial network size scaling in budding yeast. _Science_
338, 822–824 (2012). Article CAS PubMed PubMed Central Google Scholar * Posakony, J., England, J. & Attardi, G. Mitochondrial growth and division during the cell cycle in HeLa
cells. _J. Cell Biol._ 74, 468–491 (1977). Article CAS PubMed PubMed Central Google Scholar * Miettinen, T. P. et al. Identification of transcriptional and metabolic programs related to
mammalian cell size. _Curr. Biol._ 24, 598–608 (2014). Article CAS PubMed PubMed Central Google Scholar * Miettinen, T. P. & Björklund, M. Cellular allometry of mitochondrial
functionality establishes the optimal cell size. _Dev. Cell_ 39, 370–382 (2016). Article CAS PubMed PubMed Central Google Scholar * Osman, C., Noriega, T. R., Okreglak, V., Fung, J. C.
& Walter, P. Integrity of the yeast mitochondrial genome, but not its distribution and inheritance, relies on mitochondrial fission and fusion. _Proc. Natl Acad. Sci. USA_ 112, E947–E956
(2015). Article CAS PubMed PubMed Central Google Scholar * Jajoo, R. et al. Accurate concentration control of mitochondria and nucleoids. _Science_ 351, 169–172 (2016). Article CAS
PubMed PubMed Central Google Scholar * Ottoz, D. S. M., Rudolf, F. & Stelling, J. Inducible, tightly regulated and growth condition-independent transcription factor in _Saccharomyces
cerevisiae_. _Nucleic Acids Res._ 42, e130 (2014). Article PubMed PubMed Central Google Scholar * Schmoller, K. M., Turner, J. J., Kõivomägi, M. & Skotheim, J. M. Dilution of the
cell cycle inhibitor Whi5 controls budding-yeast cell size. _Nature_ 526, 268–272 (2015). Article CAS PubMed PubMed Central Google Scholar * Claude, K.-L. et al. Transcription
coordinates histone amounts and genome content. _Nat. Commun._ 12, 4202 (2021). Article CAS PubMed PubMed Central Google Scholar * Kukhtevich, I. V., Lohrberg, N., Padovani, F.,
Schneider, R. & Schmoller, K. M. Cell size sets the diameter of the budding yeast contractile ring. _Nat. Commun._ 11, 2952 (2020). Article CAS PubMed PubMed Central Google Scholar
* Ewald, J. C., Kuehne, A., Zamboni, N. & Skotheim, J. M. The yeast cyclin-dependent kinase routes carbon fluxes to fuel cell cycle progression. _Mol. Cell_ 62, 532–545 (2016). Article
CAS PubMed PubMed Central Google Scholar * Padovani, F., Mairhörmann, B., Falter-Braun, P., Lengefeld, J. & Schmoller, K. M. Segmentation, tracking and cell cycle analysis of
live-cell imaging data with Cell-ACDC. _BMC Biol._ 20, 174 (2022). Article PubMed PubMed Central Google Scholar * Klecker, T. & Westermann, B. Pathways shaping the mitochondrial
inner membrane. _Open Biol._ 11, 210238 (2021). Article CAS PubMed PubMed Central Google Scholar * Jakubke, C. et al. Cristae-dependent quality control of the mitochondrial genome.
_Sci. Adv._ 7, eabi8886 (2021). Article CAS PubMed PubMed Central Google Scholar * Hoppins, S. et al. A mitochondrial-focused genetic interaction map reveals a scaffold-like complex
required for inner membrane organization in mitochondria. _J. Cell Biol._ 195, 323–340 (2011). Article CAS PubMed PubMed Central Google Scholar * von der Malsburg, K. et al. Dual role
of mitofilin in mitochondrial membrane organization and protein biogenesis. _Dev. Cell_ 21, 694–707 (2011). Article PubMed Google Scholar * Harner, M. et al. The mitochondrial contact
site complex, a determinant of mitochondrial architecture: Molecular architecture of mitochondria. _EMBO J._ 30, 4356–4370 (2011). Article CAS PubMed PubMed Central Google Scholar *
Swaffer, M. P. et al. Transcriptional and chromatin-based partitioning mechanisms uncouple protein scaling from cell size. _Mol. Cell_ 81, 4861-4875 (2021). * Marguerat, S. & Bähler, J.
Coordinating genome expression with cell size. _Trends Genet._ 28, 560–565 (2012). Article CAS PubMed Google Scholar * Schmoller, K. M. & Skotheim, J. M. The biosynthetic basis of
cell size control. _Trends Cell Biol._ 25, 793–802 (2015). Article PubMed PubMed Central Google Scholar * Wu, C.-Y., Rolfe, P. A., Gifford, D. K. & Fink, G. R. Control of
transcription by cell size. _PLoS Biol._ 8, e1000523 (2010). Article PubMed PubMed Central Google Scholar * Zhurinsky, J. et al. A coordinated global control over cellular transcription.
_Curr. Biol.: CB_ 20, 2010–2015 (2010). Article CAS PubMed Google Scholar * Padovan-Merhar, O. et al. Single mammalian cells compensate for differences in cellular volume and DNA copy
number through independent global transcriptional mechanisms. _Mol. Cell_ 58, 339–352 (2015). Article CAS PubMed PubMed Central Google Scholar * Sun, X.-M. et al. Size-dependent
increase in RNA polymerase II initiation rates mediates gene expression scaling with cell size. _Curr. Biol._ 30, 1217–1230 (2020). Article CAS PubMed Google Scholar * Swaffer, M. P. et
al. RNA polymerase II dynamics and mRNA stability feedback determine mRNA scaling with cell size. Preprint at bioRxiv https://doi.org/10.1101/2021.09.20.461005 (2022). * Parts, L. et al.
Heritability and genetic basis of protein level variation in an outbred population. _Genome Res._ 24, 1363–1370 (2014). Article CAS PubMed PubMed Central Google Scholar * Contamine, V.
& Picard, M. Maintenance and integrity of the mitochondrial genome: a plethora of nuclear genes in the budding yeast. _Microbiol. Mol. Biol. Rev._ 64, 281–315 (2000). Article CAS
PubMed PubMed Central Google Scholar * Van Dyck, E., Foury, F., Stillman, B. & Brill, S. J. A single-stranded DNA binding protein required for mitochondrial DNA replication in S.
cerevisiae is homologous to _E. coli_ SSB. _EMBO J._ 11, 3421–3430 (1992). Article PubMed PubMed Central Google Scholar * Crider, D. G. et al. Rad53 is essential for a mitochondrial DNA
inheritance checkpoint regulating G1 to S progression. _J. Cell Biol._ 198, 793–798 (2012). Article CAS PubMed PubMed Central Google Scholar * Muellner, J. & Schmidt, K. H. Yeast
genome maintenance by the multifunctional PIF1 DNA helicase family. _Genes_ 11, 224 (2020). Article CAS PubMed PubMed Central Google Scholar * Sedman, T., Kuusk, S., Kivi, S. &
Sedman, J. A DNA helicase required for maintenance of the functional mitochondrial genome in _Saccharomyces cerevisiae_. _Mol. Cell. Biol._ 20, 1816–1824 (2000). Article CAS PubMed PubMed
Central Google Scholar * Ling, F. & Yoshida, M. Rolling-circle replication in mitochondrial DNA inheritance: scientific evidence and significance from yeast to human cells. _Genes_
11, 514 (2020). Article CAS PubMed PubMed Central Google Scholar * Torres, E. M., Springer, M. & Amon, A. No current evidence for widespread dosage compensation in _S. cerevisiae_.
_eLife_ 5, e10996 (2016). Article PubMed PubMed Central Google Scholar * Springer, M., Weissman, J. S. & Kirschner, M. W. A general lack of compensation for gene dosage in yeast.
_Mol. Syst. Biol._ 6, 368 (2010). Article PubMed PubMed Central Google Scholar * Viikov, K., Jasnovidova, O., Tamm, T. & Sedman, J. C-terminal extension of the yeast mitochondrial
DNA polymerase determines the balance between synthesis and degradation. _PLoS ONE_ 7, e33482 (2012). Article CAS PubMed PubMed Central Google Scholar * Diffley, J. F. & Stillman,
B. A close relative of the nuclear, chromosomal high-mobility group protein HMG1 in yeast mitochondria. _Proc. Natl Acad. Sci. USA_ 88, 7864–7868 (1991). Article CAS PubMed PubMed Central
Google Scholar * Lee, E. & Johnson, B. F. Volume-related mitochondrial deoxyribonucleic acid synthesis in zygotes and vegetative cells of _Saccharomyces cerevisiae_. _J. Bacteriol._
129, 1066–1071 (1977). Article CAS PubMed PubMed Central Google Scholar * Woodward, R. & Gull, K. Timing of nuclear and kinetoplast DNA replication and early morphological events in
the cell cycle of _Trypanosoma brucei_. _J. Cell Sci._ 95, 49–57 (1990). Article PubMed Google Scholar * Santos, A., Wernersson, R. & Jensen, L. J. Cyclebase 3.0: a multi-organism
database on cell-cycle regulation and phenotypes. _Nucleic Acids Res._ 43, D1140–D1144 (2015). Article CAS PubMed Google Scholar * Larsson, N.-G. et al. Mitochondrial transcription
factor A is necessary for mtDNA maintance and embryogenesis in mice. _Nat. Genet._ 18, 231–236 (1998). Article CAS PubMed Google Scholar * Matsushima, Y. et al. Functional domains of
chicken mitochondrial transcription factor A for the maintenance of mitochondrial DNA copy number in lymphoma cell line DT40. _J. Biol. Chem._ 278, 31149–31158 (2003). Article CAS PubMed
Google Scholar * Lanz, M. C. et al. Increasing cell size remodels the proteome and promotes senescence. _Mol. Cell_ 82, P3255–3269.e8 (2022). Article Google Scholar * Stringer, C., Wang,
T., Michaelos, M. & Pachitariu, M. Cellpose: a generalist algorithm for cellular segmentation. _Nat. Methods_ 18, 100–106 (2021). Article CAS PubMed Google Scholar * Li, C. H. &
Tam, P. K. S. An iterative algorithm for minimum cross entropy thresholding. _Pattern Recognit. Lett._ 19, 771–776 (1998). Article Google Scholar * van der Walt, S. et al. scikit-image:
image processing in Python. _PeerJ_ 2, e453 (2014). Article PubMed PubMed Central Google Scholar * Lee, T. C., Kashyap, R. L. & Chu, C. N. Building skeleton models via 3-D medial
surface axis thinning algorithms. _CVGIP Graph. Models Image Process._ 56, 462–478 (1994). Article Google Scholar * Miyakawa, I., Miyamoto, M., Kuroiwa, T. & Sando, N. DNA content of
individual mitochondrial nucleoids varies depending on the culture conditions of the yeast _Saccharomyces cerevisiae_. _Cytologia_ 69, 101–107 (2004). Article CAS Google Scholar * Viana,
M. P., Lim, S. & Rafelski, S. M. in _Methods in Cell Biology_ 77–93 (Elsevier, 2015). * Perkins, E. M. & McCaffery, J. M. in _Mitochondria Methods in Molecular Biology_ (eds Leister,
D. & Herrmann, J. M.) 467–483 (Humana Press, 2007). * Unger, A.-K. et al. (2017). in _Mitochondria Methods in Molecular Biology_ (eds Mokranjac, D. & Perocchi, F.) 293–314 (Springer
New York, 2017). * Schindelin, J. et al. Fiji: an open-source platform for biological-image analysis. _Nat. Methods_ 9, 676–682 (2012). Article CAS PubMed Google Scholar * Ghaemmaghami,
S. et al. Global analysis of protein expression in yeast. _Nature_ 425, 737–741 (2003). Article CAS PubMed Google Scholar Download references ACKNOWLEDGEMENTS We thank J. Ewald
(Universität Tübingen) for sharing strains, M. Swaffer (Stanford University) for help with data analysis, B. Westermann (Universität Bayreuth) and S. Geimer (Universität Bayreuth) for help
with electron microscopy, and M. Harner (LMU München), J. Frickel (LMU München), S. Schrott (LMU München), A. Göke (UCSF), and members of the Institute of Functional Epigenetics for
discussions. This work was funded by the Deutsche Forschungsgemeinschaft (DFG, German Research Foundation)—431480687 and 459304237, by the Human Frontier Science Program (career development
award to K.M.S.), by the Elitenetzwerk Bayern through the Biological Physics program (T.K.) and the Helmholtz Gesellschaft. FUNDING Open access funding provided by Helmholtz Zentrum München
- Deutsches Forschungszentrum für Gesundheit und Umwelt (GmbH). AUTHOR INFORMATION AUTHORS AND AFFILIATIONS * Institute of Functional Epigenetics, Molecular Targets and Therapeutics Center,
Helmholtz Zentrum München, Neuherberg, Germany Anika Seel, Francesco Padovani, Alissa Finster, Daniela Bureik & Kurt M. Schmoller * Institute of Cell Biology, University of Bayreuth,
Bayreuth, Germany Moritz Mayer & Till Klecker * Faculty of Biology, Ludwig-Maximilians-Universität München, Planegg-Martinsried, Germany Felix Thoma & Christof Osman Authors * Anika
Seel View author publications You can also search for this author inPubMed Google Scholar * Francesco Padovani View author publications You can also search for this author inPubMed Google
Scholar * Moritz Mayer View author publications You can also search for this author inPubMed Google Scholar * Alissa Finster View author publications You can also search for this author
inPubMed Google Scholar * Daniela Bureik View author publications You can also search for this author inPubMed Google Scholar * Felix Thoma View author publications You can also search for
this author inPubMed Google Scholar * Christof Osman View author publications You can also search for this author inPubMed Google Scholar * Till Klecker View author publications You can also
search for this author inPubMed Google Scholar * Kurt M. Schmoller View author publications You can also search for this author inPubMed Google Scholar CONTRIBUTIONS A.S. and K.M.S.
conceived the study. A.S., F.P., M.M., A.F., D.B., F.T., C.O., T.K. and K.M.S. designed the experiments. A.S., F.P., M.M., A.F., D.B., F.T. and K.M.S. performed experiments. All authors
analyzed and interpreted the results. A.S., F.P., M.M., T.K. and K.M.S. wrote the manuscript with input from all authors. CORRESPONDING AUTHOR Correspondence to Kurt M. Schmoller. ETHICS
DECLARATIONS COMPETING INTERESTS The authors declare no competing interests. PEER REVIEW PEER REVIEW INFORMATION _Nature Structural & Molecular Biology_ thanks Paul François, Suliana
Manley and the other, anonymous, reviewer(s) for their contribution to the peer review of this work. Primary handling editor Carolina Perdigoto and Beth Moorefield, in collaboration with the
_Nature Structural & Molecular Biology_ team. ADDITIONAL INFORMATION PUBLISHER’S NOTE Springer Nature remains neutral with regard to jurisdictional claims in published maps and
institutional affiliations. EXTENDED DATA EXTENDED DATA FIG. 1 VALIDATION OF WHI5 OVEREXPRESSION SYSTEM, SIZE DEPENDENCE OF TRANSCRIPTS ENCODED BY MTDNA AND BUDDING INDEX AND CELL VOLUME
DURING G1-ARRESTS CORRESPONDING TO THE EXPERIMENTS SHOWN IN FIG. 1C. Haploid wild-type (WT) and Whi5-inducible strains were grown on SCGE and treated with β-estradiol as indicated (a-d). A)
mtDNA copy number was determined by DNA-qPCR. No effect of β-estradiol was found for wild-type cells, whereas the Whi5-inducible strain shows a 3-fold increase. B) Mean cell volume was
measured with a Coulter counter. As for mtDNA, addition of 30 nM β-estradiol causes no changes in cell volume for wild-type cells. C) RT-qPCR was performed to measure transcript levels in
wild-type. Cq-values were normalized on _RDN18_ and mRNA concentrations were normalized on wild-type levels at 0 nM. No significant changes in transcript levels were found after addition of
30 nM β-estradiol for wild-type cells. Error bars indicate the standard deviation of n = 3 biological replicates (a-c). D) mRNA amounts of mitochondrial encoded genes increase with cell
volume. mRNA concentrations for _COX2_ and _COX3_ from same samples as in c were normalized on _RDN18_ and the ratio of concentrations in big (30 nM) and small (0 nM) haploid cell
populations were calculated. Data points indicate mean of n = 3 biological replicates with error bars indicating the propagated standard error. Cell volumes were measured with a Coulter
counter to estimate the concentration ratio expected for an mRNA that is maintained at constant amount. E) Budding index (fraction of budding cells) was determined by bud counting. F) Cell
volume was measured with a Coulter counter. After 2 h most cells are arrested in G1, and mean cell volume continuously increases. To account for the slower growth of cells on SCGE, growth
was followed for two additional time points. Shown is the mean of n = 3 biological replicates. Error bars depict standard deviations (e-f). Source data EXTENDED DATA FIG. 2 MICROSCOPY IMAGES
AND QUANTIFICATION OF MTDNA COPIES PER NUCLEOID. A) Same images as in Fig. 2b are shown without labeling of network segmentation and identified mtDNA. B) mtDNA copies per nucleoid for
Whi5-inducible haploid and diploid strains. To obtain the presented data, the average mtDNA copy number per cell from Fig. 1b was normalized on cell volume (nHaploid SCGE = 4; ndiploid SCGE
= 4; nhaploid SCD = 3; ndiploid SCD = 4) and divided by the average number of nucleoids per cell volume (measured by the Coulter counter) from Fig. 2d (n = 3). Error bars indicate propagated
standard errors. The observation that on SCD nucleoids contain on average more mtDNA copies than on SCGE supports previous work that reported a dependence on culture conditions65. Source
data EXTENDED DATA FIG. 3 MITOCHONDRIAL DIAMETER DOES NOT DEPEND ON CELL VOLUME IN YEAST. Wild-type (WT) and Whi5-inducible cells were grown in SCGE or SCD medium containing the indicated
concentrations of β-estradiol, chemically fixed and analyzed by transmission electron microscopy. A-D) Quantification of cell volume and mitochondrial diameter corresponding to Fig. 2f. Box
plots depict median (black line), 25th, 75th percentile (box). Whiskers indicate extreme values still within 1.5 interquartile ranges and outliers are depicted as single black points. Shown
is the data from three independent experiments. In Fig. 2f, the mean of the means of all three replicates was plotted for the data for wild-type and Whi5-inducible cells grown without
β-estradiol and Whi5-inducible cells grown in the presence of 10 nM and 30 nM (SCGE) or 60 nM and 150 nM β-estradiol (SCD). A-B) Mitochondrial diameter of cells grown in a) SCGE or b) SCD
medium. For each sample, the diameter of 100 mitochondria was measured from electron micrographs. C-D) DIC images were used to calculate cell volume from cell segmentations performed with
Cell-ACDC for cells grown in c) SCGE or d) SCD medium. The images were taken of live cells of the same cultures that were used for chemical fixation. E-F) Representative electron micrographs
of mitochondria of wild-type and Whi5-inducible cells grown in SCGE (e) or SCD (f) medium containing the indicated concentrations of β-estradiol. Scale bars represent 500 nm. Source data
EXTENDED DATA FIG. 4 MITOCHONDRIAL NETWORK VOLUME AND MTDNA COPY NUMBER ARE COUPLED TO CELL VOLUME. A) Same images of haploid ρ+ and ρ0 cells as in Fig. 3b are shown without network
segmentation. B) The number of separate mitochondrial network fragments in haploid ρ+ and ρ0 cells was calculated for each cell form the mitochondrial network segmentations obtained in Fig.
3a. Cell volume was binned as indicated. Box plots depict median (black line), 25th, 75th percentile (box). Whiskers indicate extreme values still within 1.5 interquartile ranges and
outliers are depicted as single black points. C) Quantification of mitochondrial diameter for haploid ρ+ and ρ0 cells corresponding to Fig. 3d. The cells were analyzed by transmission
electron microscopy and for each replicate the diameter of 100 mitochondria was measured. Shown are box plots for the single replicates. Figure 3d shows the mean of the means of all six
replicates. Box plot depiction as described above. D-E) mtDNA copy number and cell volume for wild-type and _mic60_∆ cells corresponding to Fig. 3g. mtDNA copy number was measured by
DNA-qPCR and mtDNA copy number per cell was calculated by using the budding index. Cell volume measurements were performed with a Coulter counter. Shown is the mean of n = 3 biological
replicates. Error bars depict standard deviations. F) Mitochondrial network volume as a function of cell volume for diploid wild-type and _mic60_∆ cells, determined from confocal images as
in Fig. 3e-f. Here, cells were grown on SCD. Image analysis in f-g was performed in 3D for 3 biological replicates with n > 50 cells each (nWT=223; n_mic60_∆=219 total cells). G) Number
of nucleoids as a function of cell volume, for same cells as in f. Lines connect binned means (shown at the center of the respective bin) with error bars indicating standard errors. H) mtDNA
copies per nucleoid for wild-type and _mic60_∆ strain, measured from n = 3 biological replicates, and obtained by dividing the average mtDNA copy number concentration from Fig. 3g by the
average number of nucleoids per cell volume (measured by Coulter counter) from Fig. 3f/ Extended Data Fig. 4g. Error bars indicate propagated standard errors. Source data EXTENDED DATA FIG.
5 ABF2-MCITRINE AND MIP1-MCITRINE ARE FUNCTIONAL. To measure mtDNA copy numbers, mean cell volume, and transcript levels in tagged strains, DNA-qPCRs, Coulter counter measurements and
RT-qPCR were performed. A-B) We did not observe any significant changes of mtDNA copy number, cell volume (a; n = 5) or _ACT1_ and _ABF2_ transcript levels (b; n = 3) upon tagging Abf2 with
mCitrine. C-D) Tagging Mip1 with mCitrine leads to a significant (p = 0.00002; determined by a by a two-tailed t-test; * p < 0.05, ** p < 0.01,*** p < 0.001) increase of mtDNA copy
number by ∼ 80% (c; n = 6), potentially due to an increased replication rate (Extended Data Fig. 8), while cell volume and transcript levels remain unchanged (d; n = 3). E) To test if
despite the change in mtDNA copy number, the cell-volume-dependent regulation of mtDNA is still intact, we tagged Mip1-mCitrine in a Whi5-inducible strain (filled triangles; darker symbols
show mean of n = 2 biological replicates (light symbols)). We find that the Mip1-mCitrine strain still shows a cell volume-dependent increase of mtDNA. Error bars indicate standard
deviations (a-e). F-G) Increase of mtDNA copy number by mCitrine tagged Mip1 is not influenced by the terminator sequence. F) mtDNA copy number in Mip1 clones with varying terminator
sequences normalized on wild-type. Tested was the endogenous _MIP1_ with a short and a long version of the _ADH1-_terminator sequence and Mip1-mCitrine with the _MIP1_ terminator sequence
(Supplementary Table 5). The strain including _MIP1-mCitrine-ADH1term (long)_ is the same as in c-e and Fig. 4d. G) Cell volume measurements for strains from f) performed with a Coulter
Counter. Data for each clone consists of n = 2 biological replicates, bars show means. Source data EXTENDED DATA FIG. 6 COMPARISON OF FLOW CYTOMETRY SIDE SCATTER AND FORWARD SCATTER
MEASUREMENTS. Whi5-inducible cell populations of haploid (open symbols) and diploid cells (filled symbols) were grown on SCGE with β-estradiol (haploids 0 nM, 10 nM, 30 nM; diploids 0 nM, 25
nM, 50 nM) and measured with a CytoFlex S Flow Cytometer (Beckman Coulter) in technical duplicates, recording SSC (A) and FSC (B). Flow cytometry measurements were compared to mean cell
volumes obtained from Coulter counter measurements. Blue triangles show area and red circles height measurements, both normalized on the Whi5-inducible strain grown with 0 nM β-estradiol.
Normalized Coulter counter measurements are shown to guide the eye (black diamonds). We find that both side scatter measurements correlate well with Coulter counter cell volume measurements.
C) We anticipate that SSC-A should be proportional to cell volume independent of cell-cycle stage. To test if this is the case, we compared the percentiles of scatter signal (SSC-A: blue
circles, FSC-A: red crosses) with the percentiles of Coulter counter measurements for wild-type. Data of n = 3 biological replicates are shown. Lines show linear fits to the pooled data,
with dashed lines showing 95% confidence prediction intervals. D) Example for gating strategy. Source data EXTENDED DATA FIG. 7 MRNA CONCENTRATIONS AND CELL VOLUMES OF HEMIZYGOUS AND
MULTICOPY STRAINS. A) Coulter counter measurements show no significant changes in mean cell volume for hemizygous mutants from Fig. 5b compared to wild-type (nWT=13, n_abf2∆/ABF2_ = 5,
n_hmi1∆/HMI1_ = 4, nother strains = 3). B-D) To verify that transcript levels are not dosage compensated in hemizygous _MIP1_, _ABF2_ and double hemizygous strains, mRNA concentrations were
measured by RT-qPCR for Whi5-inducible (0, 15, 60 nM β-estradiol; filled symbols) and non-inducible strains (open symbols) grown on SCGE, and normalized to the non-inducible wild-type (open
diamond). Shown is the mean of nWT = 5 and nHemizygous = 3 biological replicates. B) _ACT1_ concentrations stay similar for all strains. C) _MIP1_ mRNA concentration is reduced by ∼ 50% in
single and double hemizygous strains. D) _ABF2_ mRNA concentration is reduced by ∼ 50% in single and double hemizygous strains. E-G) To verify that additional gene copies of _MIP1_ and
_ABF2_ are expressed, mRNA concentrations were measured by RT-qPCR for Whi5-inducible (0, 10, 30 nM β-estradiol; filled symbols) and non-inducible strains (open symbols) grown on SCGE, and
normalized on the non-inducible wild-type (open diamond). Shown is the mean of n = 3 biological replicates. E) _ACT1_ concentrations stay comparable for all strains. F) _MIP1_ mRNA
concentrations increase by ∼ 100% in multicopy strains, where an additional _MIP1_ allele was inserted. G) _ABF2_ mRNA concentrations increase by ∼ 100% in multicopy strains, where an
additional _ABF2_ allele was inserted. Error bars depict standard deviations (a-g). Source data EXTENDED DATA FIG. 8 DEPENDENCE OF MTDNA CONCENTRATION ON MODEL RATE CONSTANTS. The steady
state concentration of mtDNA, _n_, is modulated by all four rate constants in the model: _k_R (A), _K_1 (B), _k_D (C), and _K_2 (D). To illustrate the effect of each parameter, all other
parameters were kept constant, respectively (_m_ = 5, a = 100, _T_ = 150, _k_R = 0.01, _K_1 = 5, _k_D = 1, _K_2 = 100). EXTENDED DATA FIG. 9 STANDARD CURVES OF CALIBRATION STANDARD. A
calibration standard was constructed by fusing the amplified sequences of _COX2_, _COX3_, _ACT1_, _MIP1_ and _MRX6_ to one template with PCR. Then a dilution series was prepared and qPCR was
performed in three replicates for each primer pair. Results are shown in a semilog plot. By fitting the data, the equation of the standard curve was obtained and used to calculate
concentrations of the corresponding genes for all DNA qPCR data. Source data EXTENDED DATA FIG. 10 VALIDATION OF MITOCHONDRIA AND MTDNA IMAGE ANALYSIS. Comparison of the mKate A) and mNeon
B) stain indexes between positive control (pooled data from Fig. 2b-e grouped into cells grown in SCD and SCGE medium) and negative control (haploid strain grown in SCGE). The negative
control lacks both mKate and mNeon fluorescent proteins. The stain index is computed as the median of the intensities from the positive pixels minus the median of the intensities from the
negative pixels, all divided by the standard deviation of the intensities from the negative pixels. The positive pixels are the pixels inside the segmented structures, where mitochondria
network was labeled with mKate and nucleoids with mNeon. The negative pixels are the pixels inside each segmented cell but outside of the segmented structure. Box plots depict median (black
line), 25th, 75th percentile (box). Whiskers indicate extreme values still within 1.5 interquartile ranges and outliers are depicted as single black points. C) Correlation plot between the
mitochondria network computed in this paper (see “Nucleoid counting and mitochondrial network segmentation” in the methods section) and the mitochondria network computed by the software
MitoGraph in both SCD and SCGE medium for haploid and diploid WT cells. Thick lines are linear regressions and the shaded area indicates 95% confidence intervals computed with 1000 bootstrap
resamples. Pearson’s correlation coefficients are 0.95, 0.96, 0.94, 0.96, for SCD diploid, SCD haploid, SCGE diploid, and SCGE haploid respectively, indicating a very strong correlation
between the two methods. Source data SUPPLEMENTARY INFORMATION SUPPLEMENTARY INFORMATION Supplementary Tables 1–5 REPORTING SUMMARY SOURCE DATA SOURCE DATA FIGS. 1–5 AND 7 AND EXTENDED DATA
FIGS. 1–7, 9, AND 10 Source data file for all main and Extended Data figures RIGHTS AND PERMISSIONS OPEN ACCESS This article is licensed under a Creative Commons Attribution 4.0
International License, which permits use, sharing, adaptation, distribution and reproduction in any medium or format, as long as you give appropriate credit to the original author(s) and the
source, provide a link to the Creative Commons license, and indicate if changes were made. The images or other third party material in this article are included in the article’s Creative
Commons license, unless indicated otherwise in a credit line to the material. If material is not included in the article’s Creative Commons license and your intended use is not permitted by
statutory regulation or exceeds the permitted use, you will need to obtain permission directly from the copyright holder. To view a copy of this license, visit
http://creativecommons.org/licenses/by/4.0/. Reprints and permissions ABOUT THIS ARTICLE CITE THIS ARTICLE Seel, A., Padovani, F., Mayer, M. _et al._ Regulation with cell size ensures
mitochondrial DNA homeostasis during cell growth. _Nat Struct Mol Biol_ 30, 1549–1560 (2023). https://doi.org/10.1038/s41594-023-01091-8 Download citation * Received: 18 March 2022 *
Accepted: 07 August 2023 * Published: 07 September 2023 * Issue Date: October 2023 * DOI: https://doi.org/10.1038/s41594-023-01091-8 SHARE THIS ARTICLE Anyone you share the following link
with will be able to read this content: Get shareable link Sorry, a shareable link is not currently available for this article. Copy to clipboard Provided by the Springer Nature SharedIt
content-sharing initiative

:max_bytes(150000):strip_icc():focal(216x0:218x2)/benedict-cumberbatch-1-435-4-20cc736017b24435a3498a49d7c22b0e.jpg)