- Select a language for the TTS:
- UK English Female
- UK English Male
- US English Female
- US English Male
- Australian Female
- Australian Male
- Language selected: (auto detect) - EN
Play all audios:
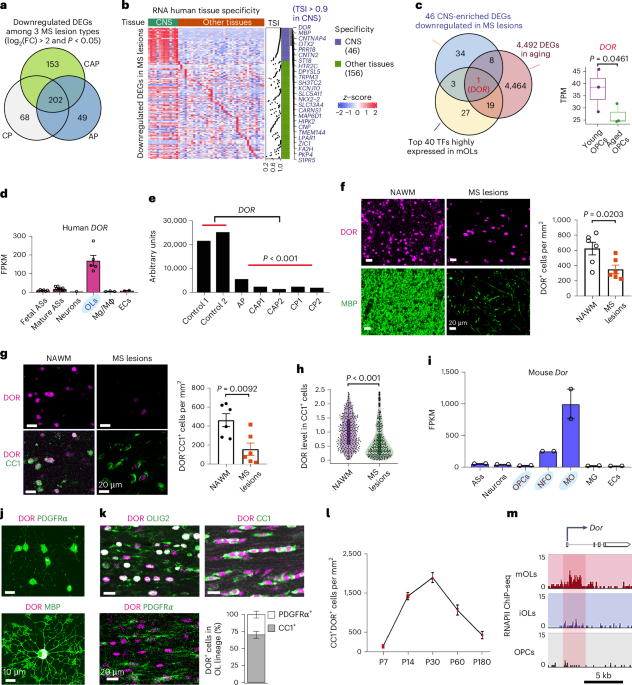
ABSTRACT The decreased ability of mature oligodendrocytes to produce myelin negatively affects remyelination in demyelinating diseases and aging, but the underlying mechanisms are
incompletely understood. In the present study, we identify a mature oligodendrocyte-enriched transcriptional coregulator diabetes- and obesity-related gene (DOR)/tumor protein p53-inducible
nuclear protein 2 (TP53INP2), downregulated in demyelinated lesions of donors with multiple sclerosis and in aged oligodendrocyte-lineage cells. _Dor_ ablation in mice of both sexes results
in defective myelinogenesis and remyelination. Genomic occupancy in oligodendrocytes and transcriptome profiling of the optic nerves of wild-type and _Dor_ conditional knockout mice reveal
that DOR and SOX10 co-occupy enhancers of critical myelinogenesis-associated genes including _Prr18_, encoding an oligodendrocyte-enriched, proline-rich factor. We show that DOR targets
regulatory elements of genes responsible for α-ketoglutarate biosynthesis in mature oligodendrocytes and is essential for α-ketoglutarate production and lipid biosynthesis. Supplementation
with α-ketoglutarate restores oligodendrocyte-maturation defects in _Dor_-deficient adult mice and improves remyelination after lysolecithin-induced demyelination and cognitive function in
17-month-old wild-type mice. Our data suggest that activation of α-ketoglutarate metabolism in mature oligodendrocytes can promote myelin production during demyelination and aging. Access
through your institution Buy or subscribe This is a preview of subscription content, access via your institution ACCESS OPTIONS Access through your institution Access Nature and 54 other
Nature Portfolio journals Get Nature+, our best-value online-access subscription $29.99 / 30 days cancel any time Learn more Subscribe to this journal Receive 12 print issues and online
access $209.00 per year only $17.42 per issue Learn more Buy this article * Purchase on SpringerLink * Instant access to full article PDF Buy now Prices may be subject to local taxes which
are calculated during checkout ADDITIONAL ACCESS OPTIONS: * Log in * Learn about institutional subscriptions * Read our FAQs * Contact customer support SIMILAR CONTENT BEING VIEWED BY OTHERS
SGK1 DRIVES HIPPOCAMPAL DEMYELINATION AND DIABETES-ASSOCIATED COGNITIVE DYSFUNCTION IN MICE Article Open access 17 February 2025 MEDIATOR MED23 CONTROLS OLIGODENDROGENESIS AND MYELINATION
BY MODULATING SP1/P300-DIRECTED GENE PROGRAMS Article Open access 15 October 2024 ENDOGENOUS SOX8 IS A CRITICAL FACTOR FOR TIMELY REMYELINATION AND OLIGODENDROGLIAL CELL REPLETION IN THE
CUPRIZONE MODEL Article Open access 14 December 2023 DATA AVAILABILITY All the RNA-seq and Cut&Tag-seq data produced in the present study have been deposited in the NCBI GEO under
accession no. GSE233593. Other expression data used in the present study are publicly available under GEO accession nos. GSE38010 and GSE134765. Source data are provided with this paper.
CODE AVAILABILITY No customized code was used in the present study. Open-source algorithms were used as detailed in analysis methods including MACS2 (v.2.2.7.1)
(https://pypi.org/project/MACS2), Bowtie 2 (v.2.4.4) (https://bowtie-bio.sourceforge.net/bowtie2/manual.shtml), Sambamba (v.0.8.1) (https://lomereiter.github.io/sambamba), RSeQC (v.4.0.0)
(https://rseqc.sourceforge.net), ChIPseeker (v.1.28.3) (https://guangchuangyu.github.io/software/ChIPseeker), MAnorm (v.1.3.0) (https://anaconda.org/bioconda/manorm), clusterProfiler
(v.4.0.5) (https://bioconductor.org/packages/release/bioc/html/clusterProfiler.html), HOMER (v.4.11.1) (http://homer.ucsd.edu/homer), deepTools (v.3.5.1)
(https://github.com/deeptools/deepTools) and Mochiview (v.1.46) (https://www.johnsonlab.ucsf.edu/mochiview-downloads). CHANGE HISTORY * _ 24 SEPTEMBER 2024 A Correction to this paper has
been published: https://doi.org/10.1038/s41593-024-01785-2 _ REFERENCES * Duncan, I. D., Brower, A., Kondo, Y., Curlee, J. F. Jr. & Schultz, R. D. Extensive remyelination of the CNS
leads to functional recovery. _Proc. Natl Acad. Sci. USA_ 106, 6832–6836 (2009). Article CAS PubMed PubMed Central Google Scholar * Edgar, J. M. & Nave, K. A. The role of CNS glia
in preserving axon function. _Curr. Opin. Neurobiol._ 19, 498–504 (2009). Article CAS PubMed Google Scholar * Kuhlmann, T. et al. Differentiation block of oligodendroglial progenitor
cells as a cause for remyelination failure in chronic multiple sclerosis. _Brain_ 131, 1749–1758 (2008). Article CAS PubMed Google Scholar * Wolswijk, G. Oligodendrocyte precursor cells
in the demyelinated multiple sclerosis spinal cord. _Brain_ 125, 338–349 (2002). Article PubMed Google Scholar * Patani, R., Balaratnam, M., Vora, A. & Reynolds, R. Remyelination can
be extensive in multiple sclerosis despite a long disease course. _Neuropathol. Appl. Neurobiol._ 33, 277–287 (2007). Article CAS PubMed Google Scholar * Patrikios, P. et al.
Remyelination is extensive in a subset of multiple sclerosis patients. _Brain_ 129, 3165–3172 (2006). Article PubMed Google Scholar * Liu, X. et al. Small-molecule-induced epigenetic
rejuvenation promotes SREBP condensation and overcomes barriers to CNS myelin regeneration. _Cell_ 187, 2465–2484.e2422 (2024). Article CAS PubMed Google Scholar * Neumann, B., Segel,
M., Chalut, K. J. & Franklin, R. J. Remyelination and ageing: reversing the ravages of time. _Mult. Scler._ 25, 1835–1841 (2019). Article PubMed PubMed Central Google Scholar *
Filley, C. M. Cognitive dysfunction in white matter disorders: new perspectives in treatment and recovery. _J. Neuropsychiatry Clin. Neurosci._ 33, 349–355 (2021). Article PubMed Google
Scholar * Bergles, D. E. & Richardson, W. D. Oligodendrocyte development and plasticity. _Cold Spring Harb. Perspect. Biol._ 8, a020453 (2015). Article PubMed Google Scholar * Elbaz,
B. & Popko, B. Molecular control of oligodendrocyte development. _Trends Neurosci._ 42, 263–277 (2019). Article CAS PubMed PubMed Central Google Scholar * Jakel, S. et al. Altered
human oligodendrocyte heterogeneity in multiple sclerosis. _Nature_ 566, 543–547 (2019). Article CAS PubMed PubMed Central Google Scholar * Yeung, M. S. Y. et al. Dynamics of
oligodendrocyte generation in multiple sclerosis. _Nature_ 566, 538–542 (2019). Article CAS PubMed PubMed Central Google Scholar * Rinholm, J. E. et al. Regulation of oligodendrocyte
development and myelination by glucose and lactate. _J. Neurosci._ 31, 538–548 (2011). Article CAS PubMed PubMed Central Google Scholar * Tepavcevic, V. Oligodendroglial energy
metabolism and (re)myelination. _Life_ 11, 238 (2021). Article CAS PubMed PubMed Central Google Scholar * Zuccotti, M., Bellone, M., Longo, F., Redi, C. A. & Garagna, S.
Fully-mature antral mouse oocytes are transcriptionally silent but their heterochromatin maintains a transcriptional permissive histone acetylation profile. _J. Assist Reprod. Genet._ 28,
1193–1196 (2011). Article PubMed PubMed Central Google Scholar * Berry, K., Wang, J. & Lu, Q. R. Epigenetic regulation of oligodendrocyte myelination in developmental disorders and
neurodegenerative diseases. _F1000Research_ 9, F1000 (2020). Article PubMed PubMed Central Google Scholar * Basu, A. & Tiwari, V. K. Epigenetic reprogramming of cell identity:
lessons from development for regenerative medicine. _Clin. Epigenet_ 13, 144 (2021). Article Google Scholar * Francis, V. A., Zorzano, A. & Teleman, A. A. dDOR is an EcR coactivator
that forms a feed-forward loop connecting insulin and ecdysone signaling. _Curr. Biol._ 20, 1799–1808 (2010). Article CAS PubMed Google Scholar * Baumgartner, B. G. et al. Identification
of a novel modulator of thyroid hormone receptor-mediated action. _PLoS ONE_ 2, e1183 (2007). Article PubMed PubMed Central Google Scholar * Asadi Shahmirzadi, A. et al.
Alpha-ketoglutarate, an endogenous metabolite, extends lifespan and compresses morbidity in aging mice. _Cell Metab._ 32, 447–456.e446 (2020). Article CAS PubMed PubMed Central Google
Scholar * Chin, R. M. et al. The metabolite alpha-ketoglutarate extends lifespan by inhibiting ATP synthase and TOR. _Nature_ 510, 397–401 (2014). Article CAS PubMed PubMed Central
Google Scholar * Naeini, S. H., Mavaddatiyan, L., Kalkhoran, Z. R., Taherkhani, S. & Talkhabi, M. Alpha-ketoglutarate as a potent regulator for lifespan and healthspan: evidences and
perspectives. _Exp. Gerontol._ 175, 112154 (2023). Article CAS PubMed Google Scholar * Kuhlmann, T. et al. An updated histological classification system for multiple sclerosis lesions.
_Acta Neuropathol._ 133, 13–24 (2017). Article CAS PubMed Google Scholar * Han, M. H. et al. Janus-like opposing roles of CD47 in autoimmune brain inflammation in humans and mice. _J.
Exp. Med._ 209, 1325–1334 (2012). Article CAS PubMed PubMed Central Google Scholar * Kim, S., Lu, H. C., Steelman, A. J. & Li, J. Myeloid caspase-8 restricts RIPK3-dependent
proinflammatory IL-1beta production and CD4 T cell activation in autoimmune demyelination. _Proc. Natl Acad. Sci. USA_ 119, e2117636119 (2022). Article CAS PubMed PubMed Central Google
Scholar * Dong, Y. et al. Oxidized phosphatidylcholines found in multiple sclerosis lesions mediate neurodegeneration and are neutralized by microglia. _Nat. Neurosci._ 24, 489–503 (2021).
Article CAS PubMed Google Scholar * Yanai, I. et al. Genome-wide midrange transcription profiles reveal expression level relationships in human tissue specification. _Bioinformatics_ 21,
650–659 (2005). Article CAS PubMed Google Scholar * Neumann, B. et al. Metformin restores CNS remyelination capacity by rejuvenating aged stem cells. _Cell Stem Cell_ 25, 473–485.e478
(2019). Article CAS PubMed PubMed Central Google Scholar * Fernandez, M. et al. Thyroid hormone administration enhances remyelination in chronic demyelinating inflammatory disease.
_Proc. Natl Acad. Sci. USA_ 101, 16363–16368 (2004). Article CAS PubMed PubMed Central Google Scholar * Yu, Y. et al. Olig2 targets chromatin remodelers to enhancers to initiate
oligodendrocyte differentiation. _Cell_ 152, 248–261 (2013). Article CAS PubMed PubMed Central Google Scholar * Xin, M. et al. Myelinogenesis and axonal recognition by oligodendrocytes
in brain are uncoupled in Olig1-null mice. _J. Neurosci._ 25, 1354–1365 (2005). Article CAS PubMed PubMed Central Google Scholar * Jeruc, J., Vizjak, A., Rozman, B. & Ferluga, D.
Immunohistochemical expression of activated caspase-3 as a marker of apoptosis in glomeruli of human lupus nephritis. _Am. J. Kidney Dis._ 48, 410–418 (2006). Article CAS PubMed Google
Scholar * Lappe-Siefke, C. et al. Disruption of Cnp1 uncouples oligodendroglial functions in axonal support and myelination. _Nat. Genet._ 33, 366–374 (2003). Article CAS PubMed Google
Scholar * Wang, J. et al. Olig2 ablation in immature oligodendrocytes does not enhance CNS myelination and remyelination. _J. Neurosci._ 42, 8542–8555 (2022). Article CAS PubMed PubMed
Central Google Scholar * Doerflinger, N. H., Macklin, W. B. & Popko, B. Inducible site-specific recombination in myelinating cells. _Genesis_ 35, 63–72 (2003). Article CAS PubMed
Google Scholar * Hippenmeyer, S. et al. A developmental switch in the response of DRG neurons to ETS transcription factor signaling. _PLoS Biol._ 3, e159 (2005). Article PubMed PubMed
Central Google Scholar * Conboy, I. M. et al. Rejuvenation of aged progenitor cells by exposure to a young systemic environment. _Nature_ 433, 760–764 (2005). Article CAS PubMed Google
Scholar * Nowak, J. et al. The TP53INP2 protein is required for autophagy in mammalian cells. _Mol. Biol. Cell_ 20, 870–881 (2009). Article CAS PubMed PubMed Central Google Scholar *
Heinz, S. et al. Simple combinations of lineage-determining transcription factors prime _cis_-regulatory elements required for macrophage and B cell identities. _Mol. Cell_ 38, 576–589
(2010). Article CAS PubMed PubMed Central Google Scholar * Stolt, C. C. et al. Terminal differentiation of myelin-forming oligodendrocytes depends on the transcription factor Sox10.
_Genes Dev._ 16, 165–170 (2002). Article CAS PubMed PubMed Central Google Scholar * Sjostedt, E. et al. An atlas of the protein-coding genes in the human, pig, and mouse brain.
_Science_ 367, eaay5947 (2020). Article PubMed Google Scholar * Zdzisinska, B., Zurek, A. & Kandefer-Szerszen, M. Alpha-ketoglutarate as a molecule with pleiotropic activity:
well-known and novel possibilities of therapeutic use. _Arch. Immunol. Ther. Exp._ 65, 21–36 (2017). Article CAS Google Scholar * Sheu, K. F. & Blass, J. P. The alpha-ketoglutarate
dehydrogenase complex. _Ann. N. Y. Acad. Sci._ 893, 61–78 (1999). Article CAS PubMed Google Scholar * Lee, C. F., Caudal, A., Abell, L., Nagana Gowda, G. A. & Tian, R. Targeting NAD+
metabolism as interventions for mitochondrial disease. _Sci. Rep._ 9, 3073 (2019). Article PubMed PubMed Central Google Scholar * Chapman, T. W. & Hill, R. A. Myelin plasticity in
adulthood and aging. _Neurosci. Lett._ 715, 134645 (2020). Article CAS PubMed Google Scholar * Fields, R. D. & Bukalo, O. Myelin makes memories. _Nat. Neurosci._ 23, 469–470 (2020).
Article CAS PubMed PubMed Central Google Scholar * Xin, W. & Chan, J. R. Myelin plasticity: sculpting circuits in learning and memory. _Nat. Rev. Neurosci._ 21, 682–694 (2020).
Article CAS PubMed PubMed Central Google Scholar * Cantuti-Castelvetri, L. et al. Defective cholesterol clearance limits remyelination in the aged central nervous system. _Science_ 359,
684–688 (2018). Article CAS PubMed Google Scholar * Ruckh, J. M. et al. Rejuvenation of regeneration in the aging central nervous system. _Cell Stem Cell_ 10, 96–103 (2012). Article
CAS PubMed PubMed Central Google Scholar * Wang, K. et al. Epigenetic regulation of aging: implications for interventions of aging and diseases. _Signal Transduct. Target Ther._ 7, 374
(2022). Article CAS PubMed PubMed Central Google Scholar * Mezydlo, A. et al. Remyelination by surviving oligodendrocytes is inefficient in the inflamed mammalian cortex. _Neuron_ 111,
1748–1759.e1748 (2023). Article CAS PubMed Google Scholar * Duncan, I. D. et al. The adult oligodendrocyte can participate in remyelination. _Proc. Natl Acad. Sci. USA_ 115,
E11807–E11816 (2018). Article CAS PubMed PubMed Central Google Scholar * Sancho, A. et al. DOR/Tp53inp2 and Tp53inp1 constitute a metazoan gene family encoding dual regulators of
autophagy and transcription. _PLoS ONE_ 7, e34034 (2012). Article CAS PubMed PubMed Central Google Scholar * Narine, M. & Colognato, H. Current insights Into oligodendrocyte
metabolism and its power to sculpt the myelin landscape. _Front Cell Neurosci._ 16, 892968 (2022). Article PubMed PubMed Central Google Scholar * Seldin, M. M. et al. A systems genetics
approach identifies Trp53inp2 as a link between cardiomyocyte glucose utilization and hypertrophic response. _Am. J. Physiol. Heart Circ. Physiol._ 312, H728–H741 (2017). Article PubMed
PubMed Central Google Scholar * Lozoya, O. A. et al. Mitochondrial acetyl-CoA reversibly regulates locus-specific histone acetylation and gene expression. _Life Sci. Alliance_ 2,
e201800228 (2019). Article PubMed PubMed Central Google Scholar * Matias, M. I. et al. Regulatory T cell differentiation is controlled by alphaKG-induced alterations in mitochondrial
metabolism and lipid homeostasis. _Cell Rep._ 37, 109911 (2021). Article CAS PubMed PubMed Central Google Scholar * Tran, T. Q. et al. α-Ketoglutarate attenuates Wnt signaling and
drives differentiation in colorectal cancer. _Nat. Cancer_ 1, 345–358 (2020). Article CAS PubMed PubMed Central Google Scholar * Nishiyama, A., Shimizu, T., Sherafat, A. &
Richardson, W. D. Life-long oligodendrocyte development and plasticity. _Semin. Cell Dev. Biol._ 116, 25–37 (2021). Article CAS PubMed PubMed Central Google Scholar * Islam, M. S.,
Leissing, T. M., Chowdhury, R., Hopkinson, R. J. & Schofield, C. J. 2-Oxoglutarate-dependent oxygenases. _Annu. Rev. Biochem._ 87, 585–620 (2018). Article CAS PubMed Google Scholar *
Moyon, S. et al. TET1-mediated DNA hydroxymethylation regulates adult remyelination in mice. _Nat. Commun._ 12, 3359 (2021). Article CAS PubMed PubMed Central Google Scholar * Zhang,
M. et al. Ten-eleven translocation 1 mediated-DNA hydroxymethylation is required for myelination and remyelination in the mouse brain. _Nat. Commun._ 12, 5091 (2021). Article PubMed PubMed
Central Google Scholar * Uboveja, A. et al. αKG-mediated carnitine synthesis promotes homologous recombination via histone acetylation. Preprint at _bioRxiv_
https://doi.org/10.1101/2024.02.06.578742 (2024). * Lee, J. V. et al. Akt-dependent metabolic reprogramming regulates tumor cell histone acetylation. _Cell Metab._ 20, 306–319 (2014).
Article CAS PubMed PubMed Central Google Scholar * Chen, Y. et al. Isolation and culture of rat and mouse oligodendrocyte precursor cells. _Nat. Protoc._ 2, 1044–1051 (2007). Article
CAS PubMed Google Scholar * Kalfarentzos, F. et al. Oral ornithine α-ketoglutarate accelerates healing of the small intestine and reduces bacterial translocation after abdominal
radiation. _Clin. Nutr._ 15, 29–33 (1996). Article CAS PubMed Google Scholar * Wang, J. et al. EED-mediated histone methylation is critical for CNS myelination and remyelination by
inhibiting WNT, BMP, and senescence pathways. _Sci. Adv._ 6, eaaz6477 (2020). * Othman, M. Z., Hassan, Z. & Che Has, A. T. Morris water maze: a versatile and pertinent tool for assessing
spatial learning and memory. _Exp. Anim._ 71, 264–280 (2022). Article CAS PubMed PubMed Central Google Scholar * Henikoff, S., Henikoff, J. G., Kaya-Okur, H. S. & Ahmad, K.
Efficient chromatin accessibility mapping in situ by nucleosome-tethered tagmentation. _eLife_ 9, e63274 (2020). Article CAS PubMed PubMed Central Google Scholar Download references
ACKNOWLEDGEMENTS We thank C. Liu and Y. Wang for _Cspg4_-_Cre__ERT_ mice, K. A. Nave for the _Cnp_-Cre line, R. Dutta and B. Trapp (supported by National Institutes of Health, grant no.
R35NS097303) for MS tissue samples and E. Hurlock for comments and suggestions. X.L.H. is supported by the National Key R&D Program of China (grant no. 2022YFA1105500), the National
Science Foundation of China (grant nos. 82171356 and 82203832) and the Fundamental Research Funds for the Central Universities (grant no. YJ202325), and Q.R.L. is supported in part by the
National Multiple Sclerosis Society award (grant no. RG-2110-38554). AUTHOR INFORMATION Author notes * These authors contributed equally: Guojiao Huang, Zhidan Li, Xuezhao Liu. * These
authors jointly supervised this work: Xuelian He, Q. Richard Lu. AUTHORS AND AFFILIATIONS * Center for Translational Medicine, Key Laboratory of Birth Defects and Related Disease of Women
and Children of MOE, State Key Laboratory of Biotherapy, West China Second University Hospital, Sichuan University, Chengdu, China Guojiao Huang, Zhidan Li, Menglong Guan, Tao Zheng, Dezhi
Mu, Yingkun Guo, Lin Zhang & Xuelian He * Department of Pediatrics, Division of Experimental Hematology and Cancer Biology, Cincinnati Children’s Hospital Medical Center, Cincinnati, OH,
USA Xuezhao Liu, Xiaowen Zhong, Dazhuan Xin & Q. Richard Lu * Key Laboratory of Neuroregeneration of Jiangsu and Ministry of Education, NMPA Key Laboratory for Research and Evaluation
of Tissue Engineering Technology Products, Jiangsu Clinical Medicine Center of Tissue Engineering and Nerve Injury Repair, Co-Innovation Center of Neuroregeneration, Nantong University,
Nantong, China Songlin Zhou & Xiaosong Gu * Department of Biotherapy, State Key Laboratory of Biotherapy and Cancer Center, West China Hospital, Sichuan University, Chengdu, China Liguo
Zhang Authors * Guojiao Huang View author publications You can also search for this author inPubMed Google Scholar * Zhidan Li View author publications You can also search for this author
inPubMed Google Scholar * Xuezhao Liu View author publications You can also search for this author inPubMed Google Scholar * Menglong Guan View author publications You can also search for
this author inPubMed Google Scholar * Songlin Zhou View author publications You can also search for this author inPubMed Google Scholar * Xiaowen Zhong View author publications You can also
search for this author inPubMed Google Scholar * Tao Zheng View author publications You can also search for this author inPubMed Google Scholar * Dazhuan Xin View author publications You can
also search for this author inPubMed Google Scholar * Xiaosong Gu View author publications You can also search for this author inPubMed Google Scholar * Dezhi Mu View author publications
You can also search for this author inPubMed Google Scholar * Yingkun Guo View author publications You can also search for this author inPubMed Google Scholar * Lin Zhang View author
publications You can also search for this author inPubMed Google Scholar * Liguo Zhang View author publications You can also search for this author inPubMed Google Scholar * Q. Richard Lu
View author publications You can also search for this author inPubMed Google Scholar * Xuelian He View author publications You can also search for this author inPubMed Google Scholar
CONTRIBUTIONS X.H. and Q.R.L. conceptualized the study and designed the experiments and wrote the manuscript. G.H., Z.L., X.L., M.G., S.Z., X.Z., T.Z., D.X. and Liguo Z. carried out most of
the experiments and data processing. Z.L. performed bioinformatic analysis. X.G., D.M., Y.G. and Lin Z. provided resources and inputs and edited the manuscript. CORRESPONDING AUTHOR
Correspondence to Xuelian He. ETHICS DECLARATIONS COMPETING INTERESTS The authors declare no competing interests. PEER REVIEW PEER REVIEW INFORMATION _Nature Neuroscience_ thanks Aiman Saab
and the other, anonymous, reviewer(s) for their contribution to the peer review of this work. ADDITIONAL INFORMATION PUBLISHER’S NOTE Springer Nature remains neutral with regard to
jurisdictional claims in published maps and institutional affiliations. EXTENDED DATA EXTENDED DATA FIG. 1 MATURE OLS WERE ABUNDANTLY DETECTED WITHIN HUMAN MS LESIONS. (A) Schematic diagram
showing an MS brain tissue. (B, C) Representative immunostaining for MBP and CC1 (arrow) in the normal-appearing white matter (NAWM, b) and MS lesion (active and chronic active lesion types,
c) from autopsies of 6 MS subjects of either sex. (D) Quantification of CC1+ cells in NAWM and MS lesions from 6 MS tissues (Supplementary Table 1). Each point represents one case. (E)
Left: representative image of CC1+OLIG2+ cells (arrow) in MS lesions. Right: quantification of CC1+/OLIG2+ cells in in NAWM and MS lesions from 6 MS tissues. Each point represents one case.
(F) Left: co-immunolabeling (arrow) of DOR with PDGFRα in the NAWM. Right: the percentages of CC1+ cells and PDGFRα+ cells among total DOR+ cells in the NAWM (n = 6 cases). Error bars
indicate mean ± SEM. unpaired two-tailed t-test. Source data EXTENDED DATA FIG. 2 DYNAMIC DOR EXPRESSION IN THE CNS AT DEVELOPMENTAL AND ADULT STAGES. (A) Left: co-localization of DOR with
OLIG2 (arrows) from P7 to P14 by immunofluorescence labeling in corpus callosum. Right: quantification of DOR+/OLIG2+ cells on the corpus callosum of wild-type mice of either sex. n = 5
mice/stage, each point represents one mouse. One-way ANOVA (F = 9.068) with Tukey’s multiple comparisons test. (B) The percentages of DOR+ cells among CC1+ cells or PDGFRα+ cells in the
corpus callosum at P14 wild-type mice (n = 3 mice). (C) DOR and CC1 immunostaining in the corpus callosum of wild-type brain (n = 5 mice) at the indicated stages. (D) Left: DOR and CC1
immunostaining at the indicated stages in the spinal cord. Right, quantification of DOR+ CC1+cells in the ventral white matter of spinal cord. n = 3 mice/stage. (E) Left: DOR with PDGFRα
immunostaining at the indicated stages in the spinal cord. Right: the percentage of PDGFRα+ cells among DOR+ cells in the ventral white matter of spinal cord. n = 3 mice/stage. (F)
Immunostaining of the corpus callosum of P14 _Dor_ cKO mice for DOR and PDGFRα (left) or CC1 (right). n = 3 mice. (G) Photographs of optic nerves of control and _Dor_ cKO mice at P10 (left)
and P60 (right). (H, I) Representative RNA in situ hybridization for _Mbp_ (h) and _Plp1_ (i) in P2 and P14 spinal cord sections from control and _Dor_ cKO mice. n = 3 mice/group. Error bars
indicate mean ± SEM. Source data EXTENDED DATA FIG. 3 _DOR_ DELETION IN THE OL LINEAGE DOES NOT AFFECT OPCS OR OTHER CELL TYPES IN THE BRAIN. (A) Left: RNA in situ hybridization for
_PDGFRa_ in control and _Dor_ cKO brains at P2 and P7. Right: quantification of _PDGFRα_+ OPCs in the cortex. (B) Left: immunostaining for PDGFRα and Ki67 in the corpus callosum from P7 Ctrl
and _Dor_ cKO mice of either sex. Right: quantification of Ki67+ cells as a percentage of PDGFRα+ OPCs. (C) Immunolabeling (left) and quantification for the percentages of Ki67+PDGFRα+
cells (middle) and PDGFRα+ cells (right) in cortex from P60 control and _Dor_ cKO mice. (D, E) Immunolabeling and quantification for GFAP (d) and IBA1(e) in control and _Dor_ cKO mice at
P14. (F) Immunolabeling (left) and quantification (right) for cleaved caspase 3 (CC3) and CC1 in the corpus callosum of control and _Dor_ cKO mice at P14. (G) Left: quantification of g
ratios of myelinated axons in the corpus callosum from control and _Dor_ cKO mice at P14. n = 300 axons from 3 mice for each group. Each point represents one axon. Right: average g-ratio
values for different fiber diameters in control and _Dor_ cKO mice at P14. (H) Quantification of the percentage of axons with different diameters in the optic nerve (left) and corpus
callosum (right). (I) Immunostaining for GST-\(\pi\) (left) and quantification of GST-\(\pi\)+ OLs (right) in control and _Dor_ cKO brains at 7 months (7 M). (J) Immunostaining for OLIG2
(left) and quantification of OLIG2+ cells (right) in control and _Dor_ cKO cortices at 7 months. (K) EM (left) and quantification of myelinated axons (right) in control and _Dor_ cKO optic
nerves at 7 months. Error bars indicate mean ± SEM. a-g(right), h-k, n = 3 animals/genotype. Each point represents one mouse. Unpaired two-tailed t-test. Source data EXTENDED DATA FIG. 4
_DOR_ DELETION IMPAIRS MYELINOGENESIS BY OLS. (A) The brains of Ctrl (_Cnp-Cre__+/−_) and _Dor-_cKO_Cnp_ (_Dor_fl/fl;_Cnp-Cre__+/−_) mcie of either sex at P11 immunolabeled for MBP and
OLIG2. n = 3 mice/genotype. (B, C) Immunolabeling for CC1 and OLIG2 (b) and quantification (c) for CC1+ cells in Ctrl and _Dor-_cKO_Cnp_ brains at P11. (D) Top, schematic of tamoxifen (TAM)
administration and harvest at P28. Bottom, immunolabeling of corpus callosum of control (Ctrl, _Plp-Cre__ERT_) and _Dor_-iKO mice for DOR and tdTomato (tdTOM). Arrows indicate the absence of
DOR in tdTOM+ cells. Right: quantification of tdTOM+ cells. (E) Representative image of MBP immunostaining of Ctrl and _Dor_-iKO cortices at P28. Arrows, superficial cortex. n = 3
mice/genotype. (F) Immunofluorescence staining (left) and quantification (right) in Ctrl and _Dor_-iKO corpus callosum at P28. (G) Representative EM of transverse optic nerve sections from
Ctrl and _Dor_ iKO mice at P28. Middle: quantification of myelinated axons. Right: average g-ratio values for different fiber diameters in control and _Dor-_iKO mice at P28. (H)
Representative EM of corpus callosum from Ctrl and _Dor_ iKO mice at P28. Middle: quantification of myelinated axons. Right: average g-ratio values for different fiber diameters in corpus
callosum from Ctrl and _Dor_-iKO mice at P28. (I) P28 Ctrl and _Dor_-iKO brains (n = 3 mice/group) immunolabeled for PDGFRα and OLIG2. (J) Quantification of OLIG2+ and PDGFRα+ cells in
corpus callosum or cortex from Ctrl and _Dor_-iKO mice at P28. (K) The percentage of CC3+ cells among total CC1+ OLs in corpus callosum of control and _Dor_-iKO at P28. Error bars indicate
mean ± SEM. c, d, f-h, j, k, n = 3 animals/genotype. Each point represents one mouse. Unpaired two-tailed t-test. Source data EXTENDED DATA FIG. 5 DELETION OF _DOR_ IMPAIRS REMYELINATION
AFTER LPC-INDUCED DEMYELINATION. (A) Schematic of tamoxifen (TAM) administration (top). Representative image of CC1 and OLIG2 in the spinal cord of Ctrl and _Dor_-iKO mice of either sex
(bottom). Quantification of CC1+ OLIG2+ cells (right). (B) Left: EM in P120 spinal cords. Right: percentage of myelinated axons. (C) Top: schematic of TAM administration and harvest
one-month after TAM administration. Bottom: immunolabeling of spinal cords of adult mice for DOR, CC1 and tdTomato (tdTOM). Arrows indicate the absence of DOR in tdTOM+ cells in _Dor_-iKO
mice. Right: quantification of CC1+ cells among tdTomato+ cells in ventral spinal white matter. (D) Left: representative images of control and _Dor_-iKO spinal cord stained for cleaved
caspase 3 (CC3). Right: quantification for CC3. (E) ASPA immunostaining in LPC lesions from control and _Dor_-iKO spinal cords at 21 dpl. n = 5 mice/group. (F) Left: quantification of ASPA+
cells among total tdTOM+ OLs in LPC lesion sites at 21 dpl. Right: quantification of tdTOM+ cells. (G) Left: PDGFRα and OLIG2 immunostaining in LPC lesions from control and _Dor_-iKO spinal
cords at 21 dpl. Right: quantification of PDGFRα+ cells among total OLIG2+ OLs in LPC lesion sites at 21 dpl. (H) EM of LPC lesions from control and _Dor_-iKO spinal cords at 21 dpl. (I)
Left: the percentage of remyelinated axons in LPC-induced lesions of control and _Dor_-iKO spinal cords at 21 dpl. Right: scatter plot of g-ratio from LPC-induced lesions at 21dpl. n >
300 axons were counted from 5 mice/group. Each point represents one axon. Error bars indicate mean ± SEM. a-d, n = 3 mice/group, each point represents one mouse; f, g, i(left), n = 5
mice/group, each point represents one mouse; a–d, f, g, i, unpaired two-tailed t-test. Source data EXTENDED DATA FIG. 6 DOR ACTIVATES THE TRANSCRIPTIONAL PROGRAM FOR OL MATURATION. (A)
qRT-PCR analysis of WNT signaling pathway genes in O4+ OLs from P14 cortices of control and _Dor_ cKO mice of either sex. (B) qRT-PCR analysis of indicated autophagy-related genes in O4+ OLs
from P14 cortices of control and Dor cKO. (C) Left: schematic of TAM administration and OL isolation at P14. Right: heatmap representing expression of myelination–related genes in O4+ OLs
from the transcriptome of P14 cortices of control and _Dor_ iKO mice. (D) The gene ontology (GO) enrichment of the significantly downregulated genes between control and _Dor_ iKO mice.
Significance was determined by P-value derived from ClusterProfiler. (E) Binding profiles of H3K27ac around DOR peak summits in iOL and mOL. (F) Pie chart of relative percentages of
DOR-target genes in mOLs that were significantly upregulated or downregulated in _Dor_ cKO. (G, H) Genomic track visualization of DOR, H3K27ac, and SOX10-binding profiles in iOLs and mOLs on
the regulatory elements of indicated myelin-associated genes loci (g) and loci of OL-enriched genes (h). RNA abundance represented as FPKM in indicated neural cell types. n = 2 biological
replicates. Error bars indicate mean ± SEM. a, b, n = 3 independent experiments per group, each point represents one experiment, unpaired two-tailed t-test. Source data EXTENDED DATA FIG. 7
DOR-REGULATED PRR18 IS REQUIRED FOR OL MATURATION AND MYELINATION. (A) Expression profile in different human organs. (B) The cortex of control and _Prr18_ cKO mice of either sex at P60 was
immunostained with MBP and OLIG2. Right, quantification of MBP-positive myelin areas and OLIG2+ cells in the layers I–IV of the cortex. n = 3 mice/group, each point represents one mouse. (C)
Immunolabeled for PDGFRα and OLIG2 (left) and quantification of OLIG2+ or PDGFRα+ cells (right) in the corpus callosum of control and _Prr18_ cKO mice at P60. n = 3 mice/group, each point
represents one mouse. Error bars indicate mean ± SEM. Unpaired two-tailed t-test. ns, not significant (p > 0.05). Source data EXTENDED DATA FIG. 8 DOR REGULATES THE GENES CRITICAL FOR ΑKG
BIOSYNTHESIS. (A) Expression of indicated genes quantified by real-time qPCR in rat OPCs treated with non-targeted control or _Dor_-targeted siRNA for 48 h (left). αKG measured in rat OPCs
transfected with siRNAs against _Dor_ under T3-induced differentiation condition (right). (B) qRT-PCR analyses of indicated genes (left) and αKG measurement (right) in primary rat OPCs
transfected with control (pCIG) and vector-expressing _Dor_. (C) Top: qRT-PCR analyses of TCA–associated genes following treatments with scrambled control and _Dor_-targeted siRNAs. Bottom:
DOR, SOX10, and H3K27ac occupancy on loci of genes associated with TCA cycle. (D) Heatmap of the differential metabolites (P < 0.05) between P14 Ctrl and Dor-cKOCnp O4+ OLs. n = two
independent experiments. (E) Schematic of DMKG administration (left). MBP and OLIG2 immunostaining in Veh or DMKG treated mice (middle). Right, quantification of MBP+/OLIG2+ cells. n = 3
mice/group, each point represents one mouse. Error bars indicate mean ± SEM. a-c, n = 3 independent experiments per group, each point represents one experiment. a-c, e, unpaired two-tailed
t-test. Source data EXTENDED DATA FIG. 9 ΑKG SUPPLEMENTATION ENHANCES MYELIN FORMATION. (A) A schematic of DMKG treatment (left). Immunolabeling for DOR (middle) and quantification of
DOR+/DAPI+ cells (right) in the corpus callosum of mice of either sex at P12. (B) Left: a schematic of DMKG treatment. Middle: representative EM of corpus callosum sections taken at P30 from
mice treated with Veh and DMKG. Right: quantification of g ratios and myelinated axons in corpus callosum. (C) A schematic of DMKG treatment (left). Immunolabeling for GST-\(\pi\) and OLIG2
(middle) and quantification of GST\(\pi\)+ cells (right) in the corpus callosum sections at P60. (D) A schematic of TAM and DMKG treatment (left). ASPA immunostaining in the cortex of
vehicle and DMKG treated _Dor_ iKO (middle) mice. Right, quantification of mGFP+ area and ASPA+ cells in the cortical layers I-IV. (E) qRT-PCR analysis of _Prr18_ expression in Ctrl
(_Olig1-Cre_) and _Prr18_ cKO (Prr18fl/fl;_Olig1-Cre_) optic nerves at P10. n = 3 tissues per group, each point represents one experiment. (F) Heat map representing the expression of
myelination–related genes and αKG biosynthesis-associated genes from the transcriptomic profiles of P10 optic nerves of control and _Prr18_ cKO mice. n = two independent experiments. (G) GO
enrichment of the significantly downregulated genes between control and _Prr18_ cKO. Significance was determined by P-value derived from ClusterProfiler. (H) Top: a schematic of DMKG
treatment of control and _Prr18_ cKO mice. Bottom: representative EM of optic nerve sections taken at P15 from mice treated with Veh and DMKG. Right: quantification of myelinated axons in
optic nerves. Error bars indicate mean ± SEM. a-d, h, n = 3 mice/group, each point represents one mouse. a-c, h, one-way ANOVA with Tukey’s multiple comparisons test (a, F = 20.53; b,
Fg-ratio = 34.61, F%myelinated axons = 22.07; c, F = 20.56; h, F = 27.08); d, e, unpaired two-tailed t-test. Source data EXTENDED DATA FIG. 10 MEMORY IMPAIRMENT IN _DOR_ CKO MICE AND
DMKG-INDUCED REMYELINATION IN AGED MICE. (A, B) Performance of adult control and _Dor_ cKO mice of either sex. after platform removal as measured by paths traveled (a) and number of platform
crossings, and time spent in the southwest quadrant (b). (C) Left: in situ hybridization analysis of _Mbp_ and _Plp1_ in the lesions at 14 dpl in spinal cords of aged mice treated with Veh
and DMKG. Right: quantification of the numbers of _Plp1_+ cells at 14 dpl in spinal cords of aged mice treated with Veh and DMKG. (D) Left: immunolabeling of Ki67 in the lesion regions of
aged mice carrying a PDGFRα-H2B-GFP reporter and treated with Veh and DMKG at 21 dpl. Right: quantification of GFP+Ki67+ cells. Nuclei are counterstained with DAPI. Error bars indicate mean
± SEM. b, n = 6 mice/group; c, d, n = 5 mice/group; each point represents one mouse. b, c, d, unpaired two-tailed t-test. Source data SUPPLEMENTARY INFORMATION SUPPLEMENTARY INFORMATION
Supplementary Tables 1 and 2. REPORTING SUMMARY SUPPLEMENTARY TABLE 3 Supplementary Table 3 Metabolome datasets. SOURCE DATA SOURCE DATA FIGS. 1–7 Statistical source data for Figs.1–7.
SOURCE DATA FIGS. 2, 5 AND 7 Unprocessed western blots for Figs. 2, 5 and 7. SOURCE DATA EXTENDED DATA FIGS. 1–10 Statistical source data for Extended Data Figs. 1–10. RIGHTS AND PERMISSIONS
Springer Nature or its licensor (e.g. a society or other partner) holds exclusive rights to this article under a publishing agreement with the author(s) or other rightsholder(s); author
self-archiving of the accepted manuscript version of this article is solely governed by the terms of such publishing agreement and applicable law. Reprints and permissions ABOUT THIS ARTICLE
CITE THIS ARTICLE Huang, G., Li, Z., Liu, X. _et al._ DOR activation in mature oligodendrocytes regulates α-ketoglutarate metabolism leading to enhanced remyelination in aged mice. _Nat
Neurosci_ 27, 2073–2085 (2024). https://doi.org/10.1038/s41593-024-01754-9 Download citation * Received: 20 July 2023 * Accepted: 07 August 2024 * Published: 12 September 2024 * Issue Date:
November 2024 * DOI: https://doi.org/10.1038/s41593-024-01754-9 SHARE THIS ARTICLE Anyone you share the following link with will be able to read this content: Get shareable link Sorry, a
shareable link is not currently available for this article. Copy to clipboard Provided by the Springer Nature SharedIt content-sharing initiative


:max_bytes(150000):strip_icc():focal(999x0:1001x2)/judy-dean-2000-5760c3d3e97048d1b23b4f8d4cf8cd1f.jpg)