- Select a language for the TTS:
- UK English Female
- UK English Male
- US English Female
- US English Male
- Australian Female
- Australian Male
- Language selected: (auto detect) - EN
Play all audios:
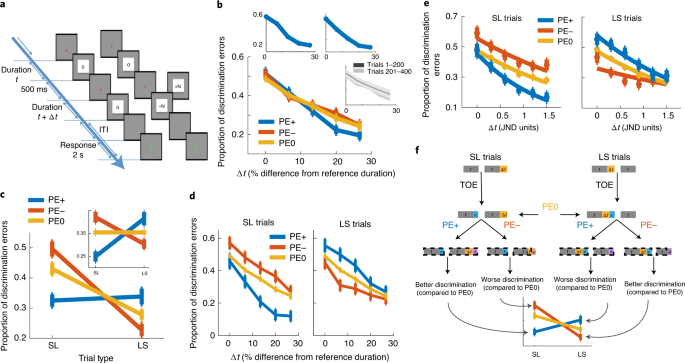
ABSTRACT Time perception and prediction errors are essential for everyday life. We hypothesized that their putative shared circuitry in the striatum might enable these two functions to
interact. We show that positive and negative prediction errors bias time perception by increasing and decreasing perceived time, respectively. Imaging and behavioral modeling identify this
interaction to occur in the putamen. Depending on context, this interaction may have beneficial or adverse effects. Access through your institution Buy or subscribe This is a preview of
subscription content, access via your institution ACCESS OPTIONS Access through your institution Access Nature and 54 other Nature Portfolio journals Get Nature+, our best-value
online-access subscription $32.99 / 30 days cancel any time Learn more Subscribe to this journal Receive 12 print issues and online access $209.00 per year only $17.42 per issue Learn more
Buy this article * Purchase on SpringerLink * Instant access to full article PDF Buy now Prices may be subject to local taxes which are calculated during checkout ADDITIONAL ACCESS OPTIONS:
* Log in * Learn about institutional subscriptions * Read our FAQs * Contact customer support SIMILAR CONTENT BEING VIEWED BY OTHERS PREDICTION-ERROR-DEPENDENT PROCESSING OF IMMEDIATE AND
DELAYED POSITIVE FEEDBACK Article Open access 27 April 2024 LONGITUDINAL EVIDENCE THAT EVENT RELATED POTENTIAL MEASURES OF SELF-REGULATION DO NOT PREDICT EVERYDAY GOAL PURSUIT Article Open
access 09 June 2022 DOPAMINE PRECURSOR DEPLETION AFFECTS PERFORMANCE AND CONFIDENCE JUDGEMENTS WHEN EVENTS ARE TIMED FROM AN EXPLICIT, BUT NOT AN IMPLICIT ONSET Article Open access 11
December 2023 DATA AVAILABILITY All data supporting the findings of this study are available from the corresponding author upon reasonable request. CODE AVAILABILITY Custom code for
behavioral and imaging tests is available from the corresponding author upon reasonable request. REFERENCES * Mauk, M. D. & Buonomano, D. V. The neural basis of temporal processing.
_Annu. Rev. Neurosci._ 27, 307–340 (2004). Article CAS Google Scholar * Dirnberger, G. et al. Give it time: neural evidence for distorted time perception and enhanced memory encoding in
emotional situations. _Neuroimage_ 63, 591–599 (2012). Article Google Scholar * Droit-Volet, S. & Meck, W. H. How emotions colour our perception of time. _Trends Cogn. Sci._ 11,
504–513 (2007). Article Google Scholar * Schultz, W., Dayan, P. & Montague, P. R. A neural substrate of prediction and reward. _Science_ 275, 1593–1599 (1997). Article CAS Google
Scholar * Niv, Y. & Schoenbaum, G. Dialogues on prediction errors. _Trends Cogn. Sci._ 12, 265–272 (2008). Article Google Scholar * Petter, E. A., Gershman, S. J. & Meck, W. H.
Integrating models of interval timing and reinforcement learning. _Trends Cogn. Sci._ 22, 911–922 (2018). Article Google Scholar * Mikhael, J. G. & Gershman, S. J. Adapting the flow of
time with dopamine. _J. Neurophysiol._ 121, 1748–1760 (2019). Article CAS Google Scholar * Coull, J. & Nobre, A. Dissociating explicit timing from temporal expectation with fMRI.
_Curr. Opin. Neurobiol._ 18, 137–144 (2008). Article CAS Google Scholar * Jahanshahi, M., Jones, C. R., Dirnberger, G. & Frith, C. D. The substantia nigra pars compacta and temporal
processing. _J. Neurosci._ 26, 12266–12273 (2006). Article CAS Google Scholar * D'ardenne, K., McClure, S. M., Nystrom, L. E. & Cohen, J. D. BOLD responses reflecting
dopaminergic signals in the human ventral tegmental area. _Science_ 319, 1264–1267 (2008). Article CAS Google Scholar * Soares, S., Atallah, B. V. & Paton, J. J. Midbrain dopamine
neurons control judgment of time. _Science_ 354, 1273–1277 (2016). Article CAS Google Scholar * Allman, M. J. & Meck, W. H. Pathophysiological distortions in time perception and timed
performance. _Brain_ 135, 656–677 (2012). Article Google Scholar * Jones, C. R. & Jahanshahi, M. Motor and perceptual timing in Parkinson’s disease. _Adv. Exp. Med. Biol._ 829,
265–290 (2014). Article Google Scholar * Bavard, S., Lebreton, M., Khamassi, M., Coricelli, G. & Palminteri, S. Reference-point centering and range-adaptation enhance human
reinforcement learning at the cost of irrational preferences. _Nat. Commun._ 9, 1–12 (2018). Article CAS Google Scholar * Klein, T. A., Ullsperger, M. & Jocham, G. Learning relative
values in the striatum induces violations of normative decision making. _Nat. Commun._ 8, 16033 (2017). Article CAS Google Scholar * Fayolle, S., Gil, S. & Droit-Volet, S. Fear and
time: fear speeds up the internal clock. _Behav. Processes_ 120, 135–140 (2015). Article Google Scholar * Smith, S. D., McIver, T. A., Di Nella, M. S. & Crease, M. L. The effects of
valence and arousal on the emotional modulation of time perception: evidence for multiple stages of processing. _Emotion_ 11, 1305–1313 (2011). Article Google Scholar * Eagleman, D. M.
Human time perception and its illusions. _Curr. Opin. Neurobiol._ 18, 131–136 (2008). Article CAS Google Scholar * Failing, M. & Theeuwes, J. Reward alters the perception of time.
_Cognition_ 148, 19–26 (2016). Article Google Scholar * Tse, P. U. Attention underlies subjective temporal expansion. in _Attention and Time_ (eds Nobre, A. C. & Coull, J. T.) 137–150
(Oxford University Press, 2010). * Brainard, D. H. & Vision, S. The psychophysics toolbox. _Spat. Vis._ 10, 433–436 (1997). Article CAS Google Scholar * Pelli, D. G. The VideoToolbox
software for visual psychophysics: transforming numbers into movies. _Spat. Vis._ 10, 437–442 (1997). Article CAS Google Scholar * Rammsayer, T. & Ulrich, R. The greater temporal
acuity in the reminder task than in the 2AFC task is independent of standard duration and sensory modality. _Can. J. exp. Psychol._ 66, 26–31 (2012). Article Google Scholar * Ulrich, R.
& Vorberg, D. Estimating the difference limen in 2AFC tasks: pitfalls and improved estimators. _Atten. Percept. Psychophys._ 71, 1219–1227 (2009). Article Google Scholar * Kahneman, D.
Prospect theory: an analysis of decisions under risk. _Econometrica_ 47, 263–292 (1979). Article Google Scholar * Tom, S. M., Fox, C. R., Trepel, C. & Poldrack, R. A. The neural basis
of loss aversion in decision-making under risk. _Science_ 315, 515–518 (2007). Article CAS Google Scholar * Levitt, H. Transformed up‐down methods in psychoacoustics. _J. Acoust. Soc.
Am._ 49, 467–477 (1971). Article Google Scholar * Allan, L. G. The time-order error in judgments of duration. _Can. J. Psychol._ 31, 24–31 (1977). Article Google Scholar * Hellström, Å.
The time-order error and its relatives: mirrors of cognitive processes in comparing. _Psychol. Bull._ 97, 35–61 (1985). Article Google Scholar * Laufer, O. & Paz, R. Monetary loss
alters perceptual thresholds and compromises future decisions via amygdala and prefrontal networks. _J. Neurosci._ 32, 6304–6311 (2012). Article CAS Google Scholar * Taatgen, N. A., Van
Rijn, H. & Anderson, J. An integrated theory of prospective time interval estimation: the role of cognition, attention and learning. _Psychol. Rev._ 114, 577–598 (2007). Article Google
Scholar * Deichmann, R., Gottfried, J. A., Hutton, C. & Turner, R. Optimized EPI for fMRI studies of the orbitofrontal cortex. _Neuroimage_ 19, 430–441 (2003). Article CAS Google
Scholar * Dale, A. M. Optimal experimental design for event-related fMRI. _Hum. Brain Mapp._ 8, 109–114 (1999). Article CAS Google Scholar * Goebel, R., Esposito, F. & Formisano, E.
Analysis of functional image analysis contest (FIAC) data with brainvoyager QX: from single‐subject to cortically aligned group general linear model analysis and self‐organizing group
independent component analysis. _Hum. Brain Mapp._ 27, 392–401 (2006). Article Google Scholar * Talairach, J. & Tournoux, P. _Co-planar Stereotaxic Atlas of the Human Brain_ (Thieme
Medical Publishers, 1988). * Eklund, A., Nichols, T. E. & Knutsson, H. Cluster failure: why fMRI inferences for spatial extent have inflated false-positive rates. _Proc. Natl Acad. Sci.
USA_ 113, 7900–7905 (2016). Article CAS Google Scholar * Woo, C.-W., Krishnan, A. & Wager, T. D. Cluster-extent based thresholding in fMRI analyses: pitfalls and recommendations.
_Neuroimage_ 91, 412–419 (2014). Article Google Scholar * Stephan, K. E., Penny, W. D., Daunizeau, J., Moran, R. J. & Friston, K. J. Bayesian model selection for group studies.
_Neuroimage_ 46, 1004–1017 (2009). Article Google Scholar Download references ACKNOWLEDGEMENTS We thank E. Furman-Haran and F. Attar for MRI procedures. This work was supported by a
Joy-Ventures grant, Israel Science Foundation grant no.2352/19 and a European Research Council grant (ERC-2016-CoG no. 724910) to R.P. AUTHOR INFORMATION AUTHORS AND AFFILIATIONS *
Department of Neurobiology, Weizmann Institute of Science, Rehovot, Israel Ido Toren, Kristoffer C. Aberg & Rony Paz Authors * Ido Toren View author publications You can also search for
this author inPubMed Google Scholar * Kristoffer C. Aberg View author publications You can also search for this author inPubMed Google Scholar * Rony Paz View author publications You can
also search for this author inPubMed Google Scholar CONTRIBUTIONS I.T. and R.P. designed the study. I.T. performed the experiments and analyzed the data. K.C.A. contributed ideas for
analysis. I.T., K.C.A. and R.P. wrote the manuscript. CORRESPONDING AUTHOR Correspondence to Rony Paz. ETHICS DECLARATIONS COMPETING INTERESTS The authors declare no competing interests.
ADDITIONAL INFORMATION PUBLISHER’S NOTE Springer Nature remains neutral with regard to jurisdictional claims in published maps and institutional affiliations. EXTENDED DATA EXTENDED DATA
FIG. 1 BEHAVIOR-ONLY GROUP’S PERFORMANCE, SEPARATED INTO FIVE LEVELS OF PE. Data presented is similar to main Fig. 1, but only for participants in the behavior-only group, when separating
trials into 5 levels of PE (PE0, small (<|3|) and large (>=|3|) PE+/PE-). A. Proportion of discrimination errors as a function of objective time difference between the two images (Δt),
averaged across all trials separately for each PE-type. Shown is the main effect of Δt (_F_4,68 = 26.9, p <10−12, η2 = 0.61), but no difference between PE types (_F_4,68 = 0.7, p =
0.59). B. Proportion of discrimination errors as a function of PE-type and Trial-type. An interaction between PE-type and Trial-type is evident as PE+ and PE- bias performance in opposite
directions relative to PE0 trials (_F_4,68 = 9.79, p < 10−5, η2 = 0.36). Inset: after correction for individual Time-Order Error (TOE). C. Proportion of discrimination errors as a
function of time difference between images (Δt), separately for LS and SL trials. PE+ and PE- bias performance in opposite directions relative to PE0, for all values of Δt. Different outcome
magnitudes are not significantly different (p>0.12), and no main effect of Trial-type (_F_1,17 = 4.1, p = 0.06). D. Proportion of discrimination errors as a function of time difference
between images (Δt), separately for LS and SL trials and corrected for TOE. PE+ and PE- bias performance in opposite directions relative to PE0, for all values of Δt. E. Proportion of
discrimination errors as a function of individual Just-Noticeable-Difference (JND), corrected for TOE, fitted to a logistic function after JND normalization. Error bars represent SEM (n=18).
EXTENDED DATA FIG. 2 BEHAVIOR-ONLY GROUP’S PERFORMANCE, SEPARATED INTO THREE LEVELS OF PE. Data is presented for participants in the behavior-only group, when separating trials into three
levels of PE. A. Proportion of discrimination errors as a function of objective time difference between the two images (Δt), averaged across all trials separately for each PE-type. No
difference between PE-types (_F_2,34 = 1.5, p = 0.24). B. Proportion of discrimination errors as a function of PE-type and Trial-type. An interaction between PE-type and Trial-type (_F_2,34
= 10.89, p = 0.0002, _η_2 = 0.39). SL trials: mean PE+ = 0.3, mean PE- = 0.49, mean PE0 = 0.37. Better performance in PE+ vs. PE- (p=0.008, _Cohen’s d_ = 0.81), worse performance in PE-
compared to PE0 (p = 0.05, _Cohen’s d_ = 0.6). LS trials: mean PE+ = 0.39, mean PE- = 0.21, mean PE0 = 0.275. Worse performance during PE+ vs. PE- (p = 0.005, _Cohen’s d_ = 0.86) and PE0 (p
= 0.02, _Cohen’s d_ = 0.68). There was no significant difference between PE- and PE0 trials (p = 0.11). Inset: Performance after correcting for individual Time-Order Error (TOE). C.
Proportion of discrimination errors as a function of the time difference between images (Δt), separately for LS and SL trials. PE+ and PE- bias performance in opposite directions relative to
PE0 for all values of Δt. No main effect of Trial-type (_F_1,17 = 4.03, p = 0.06). D. Proportion of discrimination errors as a function of the time difference between images (Δt),
separately for LS and SL trials and corrected for TOE. PE+ and PE- bias performance in opposite directions relative to PE0 for all values of Δt. E. Proportion of discrimination errors as a
function of the individual Just-Noticeable-Difference (JND), corrected for TOE, fitted to a logistic function after JND normalization. F. Model fit to individual behavioral data, averaged
over subjects. Error bars and error bands represent SEM (n=18). EXTENDED DATA FIG. 3 IMAGING-GROUP’S PERFORMANCE. Data is presented for participants in the imaging (fMRI) group, similar to
main Fig. 1 and Supplementary Fig. 1, 2. A. Proportion of discrimination errors as a function of objective time difference between the two images (Δt), averaged across all trials separately
for each PE-type. Shown is the main effect of Δt (_F_4,136 = 59.05, p < 10−5, _η_2 = 0.63), as well as significant interaction between Trial type and Δt (_F_4,136 = 6.6, p < 10−5, _η_2
= 0.16). B. Proportion of discrimination errors as a function of PE-type and Trial-type. An interaction between PE-type and Trial-type (_F_2,68 = 9.1, p = 0.003, _η_2 = 0.21). SL trials:
mean PE+ = 0.33, mean PE- = 0.5, mean PE0 = 0.46. Better performance in PE+ vs. PE- (p<0.001, _Cohen’s d_ = 0.77) and PE0 (p<0.001, _Cohen’s d_ = 0.64), no difference between PE- and
PE0. LS trials: mean PE+ = 0.31, mean PE- = 0.23, mean PE0 = 0.28, worse performance in for PE+ vs. PE- (p=0.05, _Cohen’s d_ = 0.4), no difference in performance between PE+ or PE- and PE0.
Inset: Performance after correcting for individual Time-Order Error (TOE). C. Proportion of discrimination errors as a function of time difference between images (Δt), separately for LS and
SL trials. PE+ and PE- bias performance in opposite directions relative to PE0, for all values of Δt. D. Proportion of discrimination errors as a function of time difference between images
(Δt), separately for LS and SL trials and corrected for TOE. PE+ and PE- bias performance in opposite directions relative to PE0, for all values of Δt. E. Proportion of discrimination errors
as a function of individual Just-Noticeable-Difference (JND), corrected for TOE, fitted to a logistic function after JND normalization. F. Model fit to individual behavioral data, averaged
over subjects. Error bars and error bands represent SEM (n=35). Notice that in this group (imaging), PE0 induced a slight time perception bias, because the distance between PE+ and PE0 is
not similar to the distance between PE- and PE0 (see b, c, d, e). This is explained by the different values used in this experiment (−2,4), that create an expected value of 0.2 on average,
and hence PE0 also has a small negative PE. For a full explanation and direct experimental evidence, see Supplementary Note subsection “A behavioral difference between the imaging and the
behavior-only groups and its explanation (or: why does PE0 also have a slight bias in the fMRI group)”. EXTENDED DATA FIG. 4 COMPARING PERFORMANCE BETWEEN THE BEHAVIOR-ONLY AND THE IMAGING
GROUP. A. Time order error (TOE) as a function of Δt, measured from the behavior. TOE is positive in both groups across all Δt, indicating that the first stimulus is perceived as longer. B.
Mean expected value from the model in the last 50 trials. Overall, a higher expected value can be seen in the imaging group (two-samples t-test; _t_49 = 2.4, p = 0.02). This difference is
caused by a larger difference in magnitude between the positive and negative outcomes used for the imaging group (+4/−2), as compared to the behavior-only group (+2.5/−2.5). C. Proportion of
discrimination errors grouped by PE-type. No difference in performance is seen between the groups for PE+/- (_t_51 = 0.8/0.9, p = 0.4/0.37, Bayes-Factor >2.5). However, higher proportion
of errors in PE0 was found in the imaging group (_t_51 = 2.52, p = 0.01, _Cohen’s d_ = 0.185), suggesting a non-zero value assigned to these trials during the main paradigm. Right:
Proportion of discrimination errors for PE0 trials in the first and second half of main paradigm in the imaging group. The shallower slope (that is indicating worse discrimination) for later
trials may result from the fact that the expected value of a trial becomes non-zero as a result of the imbalance between positive and negative outcomes (+4/−2, see b and c, same Figure).
Error bars and error bands represent SEM (n=18, 35 for behavior-only and imaging groups, respectively). EXTENDED DATA FIG. 5 PROPORTION OF DISCRIMINATION ERRORS AND TOE CORRECTION.
Proportion of discrimination errors as a function of trial type (Long-Short; LS or Short-Long; SL) and (Δt). A. Left: For the raw data, there is a larger difference in performance between LS
and SL trials for small Δt (“hard” trials, Δt < 67 ms) compared with large Δt (“easy” trials; mean difference = 0.2 in “hard” and 0.08 in “easy” trials), resulted from significant
interaction between Trial-type and Δt (F4,208 = 11.3, p < 10−7, η2 = 0.175). Right: Data corrected for TOE shows similar performance differences between the different levels of Δt for LS
and SL trials (F4,208 = 0.75, p = 0.55). B. Separated according to group (before correction to TOE). TOE occurred in all groups, and was therefore corrected for all (see top-right). Error
bars represent SEM (n=18, 35 for behavior-only and imaging groups, respectively). EXTENDED DATA FIG. 6 STABILITY OF PERCEPTUAL THRESHOLDS AND VALUE CONTROL. A. Comparison of four different
methods for computing individual Just-Noticeable-Difference (JND), estimated on the behavior-only group, indicating no difference between the approaches (see Methods for the different
approaches; _F_2,46 = 0.7, p = 0.5, Bayes-Factor > 1.5) which validates the use of staircase JND to normalize the results (n=18). B. Comparison between JND before and after main paradigm.
Left plot demonstrates no difference between different measures of JND after main paradigm, whereas right plot demonstrates that perceptual threshold did not change (after minus before) due
to main paradigm and was identical across different images (n=47 for first three violins, n=22 for last two violins). The two sets of left violins measure JND when the two consecutive
images were overlaid with the same number (positive or negative), to control for value and visual differences. The middle (PE0) and right set of violins (PE+/PE-) measure JND when the two
consecutive images are either [0 0],[0 +4],[0–2], correspondingly. Therefore, although we denote it as PE here for clarity, there is no real prediction-error because the outcome is fully
predicted within the block. Before the paradigm numbers did not have any meaning (that is did not provide reward/loss), while at the end they did (like in the main paradigm). Overall, the
different conditions show that perceptual thresholds did not change: before to after the main paradigm, with or w/o real outcome, and with outcome that is predicted (that is no PE). Error
bars represent SEM. EXTENDED DATA FIG. 7 PERFORMANCE IN THE GAIN-ONLY GROUP. A. Proportion of discrimination errors as a function of objective time difference between the two images (Δt),
averaged across all trials separately for each PE-type. Shown is main effect of Δt (_F_5,90 = 21.1, p <10−13, _η_2 = 0.5) but there was no difference between PE-types (_F_2,36 = 0.59, p =
0.55) or Trial-type (_F_1,18 = 3.4, p = 0.078), as seen in the main experiment. B. Proportion of discrimination errors as a function of PE-type and Trial-type. An interaction between
PE-type and Trial-type (PE-Type x Trial-type: F2,36 = 6.77, p = 0.003, η2 = 0.273). SL trials: mean PE+ = 0.38, mean PE- = 0.48, mean PE0 = 0.41. Better performance in PE+ vs. PE- (p=0.03,
Cohen’s d = 0.64). LS trials: mean PE+ = 0.4, mean PE- = 0.3, mean PE0 = 0.32. Worse performance in PE+ vs. PE- (p=0.07, Cohen’s d = 0.54). Inset: Performance after correcting for individual
Time-Order Error (TOE). C. Proportion of discrimination errors as a function of time difference between images (Δt), separately for LS and SL trials. PE+ and PE- bias performance in
opposite directions. D. Proportion of discrimination errors as a function of individual Just-Noticeable-Difference (JND), fitted to a logistic function after JND normalization. Error bars
represent SEM (n=19). EXTENDED DATA FIG. 8 ROIS WHERE ACTIVATION CORRELATES WITH TRIAL-TO-TRIAL MODEL-DERIVED PE+ SIGNALS. Shown are activations in the dACC and PCC (n=35). Displayed on
average brain. Time courses represent mean % signal change extracted from the ROIs ± SEM. Black vertical lines represent trial onset, trial offset and average onset of next trial,
respectively. Activation was set to statistical threshold of q = 0.055 for visualization. SUPPLEMENTARY INFORMATION SUPPLEMENTARY INFORMATION Supplementary Note and Supplementary Tables 1–4.
REPORTING SUMMARY RIGHTS AND PERMISSIONS Reprints and permissions ABOUT THIS ARTICLE CITE THIS ARTICLE Toren, I., Aberg, K.C. & Paz, R. Prediction errors bidirectionally bias time
perception. _Nat Neurosci_ 23, 1198–1202 (2020). https://doi.org/10.1038/s41593-020-0698-3 Download citation * Received: 01 October 2019 * Accepted: 27 July 2020 * Published: 24 August 2020
* Issue Date: October 2020 * DOI: https://doi.org/10.1038/s41593-020-0698-3 SHARE THIS ARTICLE Anyone you share the following link with will be able to read this content: Get shareable link
Sorry, a shareable link is not currently available for this article. Copy to clipboard Provided by the Springer Nature SharedIt content-sharing initiative