- Select a language for the TTS:
- UK English Female
- UK English Male
- US English Female
- US English Male
- Australian Female
- Australian Male
- Language selected: (auto detect) - EN
Play all audios:
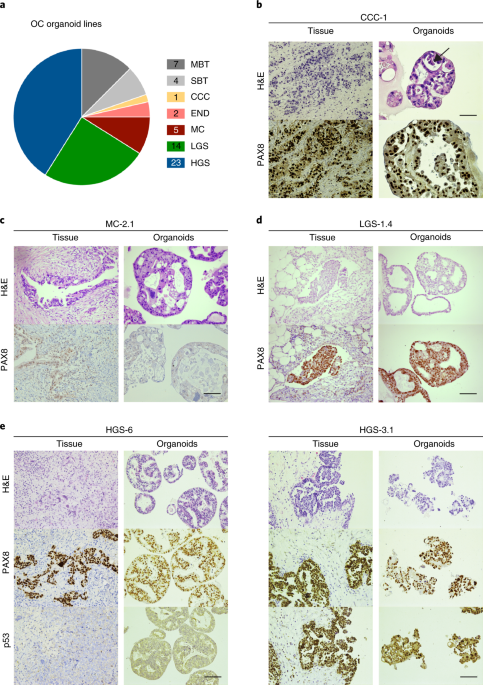
ABSTRACT Ovarian cancer (OC) is a heterogeneous disease usually diagnosed at a late stage. Experimental in vitro models that faithfully capture the hallmarks and tumor heterogeneity of OC
are limited and hard to establish. We present a protocol that enables efficient derivation and long-term expansion of OC organoids. Utilizing this protocol, we have established 56 organoid
lines from 32 patients, representing all main subtypes of OC. OC organoids recapitulate histological and genomic features of the pertinent lesion from which they were derived, illustrating
intra- and interpatient heterogeneity, and can be genetically modified. We show that OC organoids can be used for drug-screening assays and capture different tumor subtype responses to the
gold standard platinum-based chemotherapy, including acquisition of chemoresistance in recurrent disease. Finally, OC organoids can be xenografted, enabling in vivo drug-sensitivity assays.
Taken together, this demonstrates their potential application for research and personalized medicine. Access through your institution Buy or subscribe This is a preview of subscription
content, access via your institution ACCESS OPTIONS Access through your institution Access Nature and 54 other Nature Portfolio journals Get Nature+, our best-value online-access
subscription $29.99 / 30 days cancel any time Learn more Subscribe to this journal Receive 12 print issues and online access $209.00 per year only $17.42 per issue Learn more Buy this
article * Purchase on SpringerLink * Instant access to full article PDF Buy now Prices may be subject to local taxes which are calculated during checkout ADDITIONAL ACCESS OPTIONS: * Log in
* Learn about institutional subscriptions * Read our FAQs * Contact customer support SIMILAR CONTENT BEING VIEWED BY OTHERS PATIENT-DERIVED OVARIAN CANCER ORGANOIDS CAPTURE THE GENOMIC
PROFILES OF PRIMARY TUMOURS APPLICABLE FOR DRUG SENSITIVITY AND RESISTANCE TESTING Article Open access 28 July 2020 ESTABLISHMENT OF PATIENT-DERIVED CANCER ORGANOIDS FOR DRUG-SCREENING
APPLICATIONS Article 14 September 2020 PATIENT-DERIVED ORGANOIDS REFLECT THE GENETIC PROFILE OF ENDOMETRIAL TUMORS AND PREDICT PATIENT PROGNOSIS Article Open access 30 July 2021 DATA
AVAILABILITY BAM files for DNA and RNA sequencing data are made available through controlled access at the European Genome-phenome Archive (EGA) which is hosted at the EBI and the CRG
(https://ega-archive.org), under accession number EGA: EGAS00001003073. Data access requests will be evaluated by the UMCU Department of Genetics Data Access Board (EGAC00001000432) and
transferred on completion of a material transfer agreement and authorization by the medical ethical committee UMCU at request of the HUB to ensure compliance with the Dutch ‘medical research
involving human subjects’ act. CODE AVAILABILITY Illumina data processing pipeline v2.2.1 is available at https://github.com/UMCUGenetics/IAP/releases/tag/v2.2.1 and RNA analysis pipeline
v2.3.0 is available at https://github.com/UMCUGenetics/RNASeq. All other custom code used for this study is available at https://github.com/UMCUGenetics/OvCaBiobank REFERENCES * Vaughan, S.
et al. Rethinking ovarian cancer: recommendations for improving outcomes. _Nat. Rev. Cancer_ 11, 719–725 (2011). Article CAS Google Scholar * Bowtell, D. D. et al. Rethinking ovarian
cancer II: reducing mortality from high-grade serous ovarian cancer. _Nat. Rev. Cancer_ 15, 668–679 (2015). Article CAS Google Scholar * Fischerova, D. et al. Diagnosis, treatment, and
follow-up of borderline ovarian tumors. _Oncologist_ 17, 1515–1533 (2012). Article Google Scholar * Koshiyama, M., Matsumura, N. & Konishi, I. Recent concepts of ovarian
carcinogenesis: type I and type II. _Biomed. Res. Int._ 2014, 934261 (2014). Article Google Scholar * Cancer Genome Atlas Research Network Integrated genomic analyses of ovarian carcinoma.
_Nature_ 474, 609–615 (2011). Article Google Scholar * Ciriello, G. et al. Emerging landscape of oncogenic signatures across human cancers. _Nat. Genet._ 45, 1127–1133 (2013). Article
CAS Google Scholar * Piek, J. M. et al. Dysplastic changes in prophylactically removed Fallopian tubes of women predisposed to developing ovarian cancer. _J. Pathol._ 195, 451–456 (2001).
Article CAS Google Scholar * Kurman, R. J. & Shih Ie, M. The origin and pathogenesis of epithelial ovarian cancer: a proposed unifying theory. _Am. J. Surg. Pathol._ 34, 433–443
(2010). Article Google Scholar * Thu, K. L. et al. A comprehensively characterized cell line panel highly representative of clinical ovarian high-grade serous carcinomas. _Oncotarget_ 8,
50489–50499 (2017). Article Google Scholar * Fleury, H. et al. Novel high-grade serous epithelial ovarian cancer cell lines that reflect the molecular diversity of both the sporadic and
hereditary disease. _Genes Cancer_ 6, 378–398 (2015). CAS PubMed PubMed Central Google Scholar * Ince, T. A. et al. Characterization of twenty-five ovarian tumour cell lines that
phenocopy primary tumours. _Nat. Commun._ 6, 7419 (2015). Article CAS Google Scholar * Letourneau, I. J. et al. Derivation and characterization of matched cell lines from primary and
recurrent serous ovarian cancer. _BMC Cancer_ 12, 379 (2012). Article CAS Google Scholar * Kreuzinger, C. et al. Molecular characterization of 7 new established cell lines from high grade
serous ovarian cancer. _Cancer Lett._ 362, 218–228 (2015). Article CAS Google Scholar * Sachs, N. & Clevers, H. Organoid cultures for the analysis of cancer phenotypes. _Curr. Opin.
Genet. Dev._ 24, 68–73 (2014). Article CAS Google Scholar * Domcke, S. et al. Evaluating cell lines as tumour models by comparison of genomic profiles. _Nat. Commun._ 4, 2126 (2013).
Article Google Scholar * Jones, P. M. & Drapkin, R. Modeling high-grade serous carcinoma: how converging insights into pathogenesis and genetics are driving better experimental
platforms. _Front. Oncol._ 3, 217 (2013). Article Google Scholar * Ben-David, U. et al. Patient-derived xenografts undergo mouse-specific tumor evolution. _Nat. Genet._ 49, 1567–1575
(2017). Article CAS Google Scholar * Sato, T. et al. Long-term expansion of epithelial organoids from human colon, adenoma, adenocarcinoma, and Barrett’s epithelium. _Gastroenterology_
141, 1762–1772 (2011). Article CAS Google Scholar * Gao, D. et al. _O_rganoid cultures derived from patients with advanced prostate cancer. _Cell_ 159, 176–187 (2014). Article CAS
Google Scholar * Fujii, M. et al. A colorectal tumor organoid library demonstrates progressive loss of niche factor requirements during tumorigenesis. _Cell Stem Cell_ 18, 827–838 (2016).
Article CAS Google Scholar * Boj, S. F. et al. Organoid models of human and mouse ductal pancreatic cancer. _Cell_ 160, 324–338 (2015). Article CAS Google Scholar * van de Wetering, M.
et al. Prospective derivation of a living organoid biobank of colorectal cancer patients. _Cell_ 161, 933–945 (2015). Article Google Scholar * Roerink, S. F. et al. Intra-tumour
diversification in colorectal cancer at the single-cell level. _Nature_ 556, 457–462 (2018). Article CAS Google Scholar * Vlachogiannis, G. et al. Patient-derived organoids model
treatment response of metastatic gastrointestinal cancers. _Science_ 359, 920–926 (2018). Article CAS Google Scholar * Sachs, N. et al. A living biobank of breast cancer organoids
captures disease heterogeneity. _Cell_ 172, 373–386.e10 (2018). Article CAS Google Scholar * Verissimo, C. S. et al. Targeting mutant RAS in patient-derived colorectal cancer organoids by
combinatorial drug screening. _Elife_ 5, e18489 (2016). Article Google Scholar * Hill, S. J. et al. Prediction of DNA repair inhibitor response in short term patient-derived ovarian
cancer organoids. _Cancer Discov._ 8, 1404–1421 (2018). Article Google Scholar * Kessler, M. et al. The Notch and Wnt pathways regulate stemness and differentiation in human fallopian tube
organoids. _Nat. Commun._ 6, 8989 (2015). Article CAS Google Scholar * Gilmour, L. M. et al. Neuregulin expression, function, and signaling in human ovarian cancer cells. _Clin. Cancer
Res._ 8, 3933–3942 (2002). CAS PubMed Google Scholar * Aune, G. et al. Increased circulating hepatocyte growth factor (HGF): a marker of epithelial ovarian cancer and an indicator of poor
prognosis. _Gynecol. Oncol._ 121, 402–406 (2011). Article CAS Google Scholar * Sheng, Q. et al. An activated ErbB3/NRG1 autocrine loop supports in vivo proliferation in ovarian cancer
cells. _Cancer Cell_ 17, 298–310 (2010). Article CAS Google Scholar * Bourgeois, D. L. et al. High-grade serous ovarian cancer cell lines exhibit heterogeneous responses to growth factor
stimulation. _Cancer Cell Int._ 15, 112 (2015). Article Google Scholar * Antoniou, A. et al. Average risks of breast and ovarian cancer associated with _BRCA1_ or _BRCA2_ mutations
detected in case series unselected for family history: a combined analysis of 22 studies. _Am. J. Hum. Genet._ 72, 1117–1130 (2003). Article CAS Google Scholar * Gabai-Kapara, E. et al.
Population-based screening for breast and ovarian cancer risk due to _BRCA1_ and _BRCA2_. _Proc. Natl Acad. Sci. USA_ 111, 14205–14210 (2014). Article CAS Google Scholar * Wang, M. et al.
PAX2 and PAX8 reliably distinguishes ovarian serous tumors from mucinous tumors. _Appl. Immunohistochem. Mol. Morphol._ 23, 280–287 (2015). Article CAS Google Scholar * Rajagopalan, H.
& Lengauer, C. Aneuploidy and cancer. _Nature_ 432, 338–341 (2004). Article CAS Google Scholar * Priestley, P. et al. Pan-cancer whole genome analyses of metastatic solid tumors.
Preprint at https://doi.org/10.1101/415133 (2018). * Gorringe, K. L. et al. High-resolution single nucleotide polymorphism array analysis of epithelial ovarian cancer reveals numerous
microdeletions and amplifications. _Clin. Cancer Res._ 13, 4731–4739 (2007). Article CAS Google Scholar * Hunter, S. M. et al. Pre-invasive ovarian mucinous tumors are characterized by
CDKN2A and RAS pathway aberrations. _Clin. Cancer Res._ 18, 5267–5277 (2012). Article CAS Google Scholar * Romero, I. et al. Low-grade serous carcinoma: new concepts and emerging
therapies. _Gynecol. Oncol._ 130, 660–666 (2013). Article Google Scholar * Kuo, K. T. et al. Analysis of DNA copy number alterations in ovarian serous tumors identifies new molecular
genetic changes in low-grade and high-grade carcinomas. _Cancer Res._ 69, 4036–4042 (2009). Article CAS Google Scholar * Seidman, J. D. et al. The fallopian tube–peritoneal junction: a
potential site of carcinogenesis. _Int. J. Gynecol. Pathol._ 30, 4–11 (2011). Article Google Scholar * Kurman, R. J. & Shih Ie, M. Molecular pathogenesis and extraovarian origin of
epithelial ovarian cancer–shifting the paradigm. _Hum. Pathol._ 42, 918–931 (2011). Article CAS Google Scholar * Seidman, J. D. & Khedmati, F. Exploring the histogenesis of ovarian
mucinous and transitional cell (Brenner) neoplasms and their relationship with Walthard cell nests: a study of 120 tumors. _Arch. Pathol. Lab. Med._ 132, 1753–1760 (2008). PubMed Google
Scholar * Vassilev, L. T. et al. In vivo activation of the p53 pathway by small-molecule antagonists of MDM2. _Science_ 303, 844–848 (2004). Article CAS Google Scholar * Yadav, B. et al.
Quantitative scoring of differential drug sensitivity for individually optimized anticancer therapies. _Sci. Rep._ 4, 5193 (2014). Article CAS Google Scholar * Lord, C. J. &
Ashworth, A. PARP inhibitors: synthetic lethality in the clinic. _Science_ 355, 1152–1158 (2017). Article CAS Google Scholar * Murai, J. Targeting DNA repair and replication stress in the
treatment of ovarian cancer. _Int. J. Clin. Oncol._ 22, 619–628 (2017). Article CAS Google Scholar * Meijer, T. G. et al. Functional ex vivo assay reveals homologous recombination
deficiency in breast cancer beyond _BRCA_ gene defects. _Clin. Cancer Res._ 24, 6277–6287 (2018). Article Google Scholar * Drost, J. et al. Sequential cancer mutations in cultured human
intestinal stem cells. _Nature_ 521, 43–47 (2015). Article CAS Google Scholar * Matano, M. et al. Modeling colorectal cancer using CRISPR-Cas9-mediated engineering of human intestinal
organoids. _Nat. Med._ 21, 256–262 (2015). Article CAS Google Scholar * Drost, J. et al. Use of CRISPR-modified human stem cell organoids to study the origin of mutational signatures in
cancer. _Science_ 358, 234–238 (2017). Article CAS Google Scholar * Fumagalli, A. et al. Genetic dissection of colorectal cancer progression by orthotopic transplantation of engineered
cancer organoids. _Proc. Natl Acad. Sci. USA_ 114, E2357–E2364 (2017). Article CAS Google Scholar * Schmeler, K. M. et al. Neoadjuvant chemotherapy for low-grade serous carcinoma of the
ovary or peritoneum. _Gynecol. Oncol._ 108, 510–514 (2008). Article CAS Google Scholar * Gershenson, D. M. et al. Recurrent low-grade serous ovarian carcinoma is relatively
chemoresistant. _Gynecol. Oncol._ 114, 48–52 (2009). Article Google Scholar * Pectasides, D. et al. Advanced stage mucinous epithelial ovarian cancer: the Hellenic Cooperative Oncology
Group experience. _Gynecol. Oncol._ 97, 436–441 (2005). Article Google Scholar * Brown, J. & Frumovitz, M. Mucinous tumors of the ovary: current thoughts on diagnosis and management.
_Curr. Oncol. Rep._ 16, 389 (2014). Article Google Scholar * Li, H. Aligning sequence reads, clone sequences and assembly contigs with BWA-MEM.Preprint at https://arxiv.org/abs/1303.3997
(2013). * Van der Auwera, G. A. et al. From FastQ data to high confidence variant calls: the Genome Analysis Toolkit best practices pipeline. _Curr. Protoc. Bioinformatics_ 43,
11.10.1–11.10.33 (2013). Google Scholar * McKenna, A. et al. The genome analysis toolkit: a MapReduce framework for analyzing next-generation DNA sequencing data. _Genome Res._ 20,
1297–1303 (2010). Article CAS Google Scholar * Saunders, C. T. et al. Strelka: accurate somatic small-variant calling from sequenced tumor-normal sample pairs. _Bioinformatics_ 28,
1811–1817 (2012). Article CAS Google Scholar * Koboldt, D. C. et al. VarScan 2: somatic mutation and copy number alteration discovery in cancer by exome sequencing. _Genome Res._ 22,
568–576 (2012). Article CAS Google Scholar * Garrison, E. & Marth, G. Haplotype-based variant detection from short-read sequencing. Preprint at https://arxiv.org/abs/1207.3907 (2012).
* Cibulskis, K. et al. Sensitive detection of somatic point mutations in impure and heterogeneous cancer samples. _Nat. Biotechnol._ 31, 213–219 (2013). Article CAS Google Scholar *
Cingolani, P. et al. A program for annotating and predicting the effects of single nucleotide polymorphisms, SnpEff: SNPs in the genome of _Drosophila melanogaster_ strain w1118; iso-2;
iso-3. _Fly (Austin)_ 6, 80–92 (2012). Article CAS Google Scholar * Boeva, V. et al. Control-FREEC: a tool for assessing copy number and allelic content using next-generation sequencing
data. _Bioinformatics_ 28, 423–425 (2012). Article CAS Google Scholar * Chen, X. et al. Manta: rapid detection of structural variants and indels for germline and cancer sequencing
applications. _Bioinformatics_ 32, 1220–1222 (2016). Article CAS Google Scholar * The Genome of the Netherlands Consortium. Whole-genome sequence variation, population structure and
demographic history of the Dutch population. _Nat. Genet._ 46, 818–825 (2014). * Genomes Project, C. et al. A global reference for human genetic variation. _Nature_ 526, 68–74 (2015).
Article Google Scholar * Muraro, M. J. et al. A single-cell transcriptome atlas of the human pancreas. _Cell Syst._ 3, 385–394.e3 (2016). Article CAS Google Scholar * Li, H. &
Durbin, R. Fast and accurate short read alignment with Burrows-Wheeler transform. _Bioinformatics_ 8, 1754–1760 (2009). Article Google Scholar * Dobin, A. et al. STAR: ultrafast universal
RNA-seq aligner. _Bioinformatics_ 29, 15–21 (2013). Article CAS Google Scholar * Anders, S., Pyl, P. T. & Huber, W. HTSeq—a Python framework to work with high-throughput sequencing
data. _Bioinformatics_ 31, 166–169 (2015). Article CAS Google Scholar * Durinck, S. et al. Mapping identifiers for the integration of genomic datasets with the R/Bioconductor package
biomaRt. _Nat. Protoc._ 4, 1184–1191 (2009). Article CAS Google Scholar * Love, M. I., Huber, W. & Anders, S. Moderated estimation of fold change and dispersion for RNA-seq data with
DESeq2. _Genome Biol._ 15, 550 (2014). Article Google Scholar * Aryee, M. J. et al. Minfi: a flexible and comprehensive Bioconductor package for the analysis of Infinium DNA methylation
microarrays. _Bioinformatics_ 30, 1363–1369 (2014). Article CAS Google Scholar * Ran, F. A. et al. Genome engineering using the CRISPR–Cas9 system. _Nat. Protoc._ 8, 2281–2308 (2013).
Article CAS Google Scholar * Koo, B. K. et al. Controlled gene expression in primary Lgr5 organoid cultures. _Nat. Methods_ 9, 81–83 (2011). Article Google Scholar Download references
ACKNOWLEDGEMENTS We thank T. Bayram for supporting of ethical regulatory affairs. We acknowledge A. Brousali, P. van der Groep, A. Constantinides, A. Snelting and O. Kranenburg of the
Utrecht Platform for Organoid Technology (U-PORT; UMC Utrecht) for patient inclusion and tissue acquisition. We thank the Integraal Kankercentrum Nederland (IKNL) and M. van der Aa for
supplying clinical data, and I. Renkens for help with DNA isolations. We acknowledge E. Stelloo for her help with culturing organoids. We thank the people from the Preclinical Intervention
Unit of the Mouse Clinic for Cancer and Ageing (MCCA) at the NKI for performing the intervention studies. We thank B. Artegiani and T. Dayton for critically reading the manuscript. O.K. was
supported by Marie Skłodowska-Curie IF grant 658933 – HGSOC. This work was funded by the gravitation program CancerGenomiCs.nl from the Netherlands Organisation for Scientific Research
(NWO), MKMD grant (114021012) from Netherlands Organization for Scientific Research (NWO-ZonMw), Stand Up to Cancer International Translational Cancer Research Grant, a program of the
Entertainment Industry Foundation administered by the AACR, Dutch Cancer Society (KWF) grant UU2015-7743, Dutch Cancer Society (Alpe d’HuZes) grant EMCR 2014-7048, and a grant from the
Gieskes Strijbis Foundation (1816199). The Oncode Institute is supported by the Dutch Cancer Society. AUTHOR INFORMATION Author notes * These authors contributed equally: Chris J. De Witte,
Kadi Lõhmussaar, Jose Espejo Valle-Inclan AUTHORS AND AFFILIATIONS * Hubrecht Institute, Royal Netherlands Academy of Arts and Sciences and UMC Utrecht, Utrecht, the Netherlands Oded Kopper,
Kadi Lõhmussaar, Lennart Kester, Anjali Vanita Balgobind, Jeroen Korving, Harry Begthel, Sonia Aristín Revilla, Alexander van Oudenaarden & Hans Clevers * Oncode Institute, Utrecht, the
Netherlands Oded Kopper, Kadi Lõhmussaar, Nizar Hami, Lennart Kester, Anjali Vanita Balgobind, Jeroen Korving, Harry Begthel, Sonia Aristín Revilla, Bas Ponsioen, Johannes L. Bos, Alexander
van Oudenaarden, Hugo J. G. Snippert & Hans Clevers * Center for Molecular Medicine, University Medical Center Utrecht, Utrecht University, Utrecht, the Netherlands Chris J. de Witte,
Jose Espejo Valle-Inclan, Markus J. van Roosmalen & Wigard P. Kloosterman * Molecular Cancer Research, Center for Molecular Medicine, University Medical Center Utrecht, Utrecht
University, Utrecht, the Netherlands Nizar Hami, Bas Ponsioen, Johannes L. Bos & Hugo J. G. Snippert * Preclinical Intervention Unit of the Mouse Clinic for Cancer and Ageing (MCCA) at
the NKI, Amsterdam, the Netherlands Natalie Proost, Rebecca Theeuwsen & Marieke van de Ven * Department of Human Genetics, Leiden University Medical Center, Leiden, the Netherlands Lise
M. van Wijk, Harry Vrieling & Maaike P. G. Vreeswijk * Princess Margaret Cancer Center, University Health Network, Toronto, Ontario, Canada Victor W. H. Ho & Benjamin G. Neel *
Perlmutter Cancer Center, NYU Langone Health, New York, NY, USA Benjamin G. Neel * Department of Pathology, Leiden University Medical Center, Leiden, the Netherlands Tjalling Bosse *
Department of Gynecology, Leiden University Medical Center, Leiden, the Netherlands Katja N. Gaarenstroom * Department of Pathology, University Medical Center Utrecht, Utrecht University,
Utrecht, the Netherlands Paul J. van Diest & Trudy Jonges * Department of Medical Oncology, Cancer Center, University Medical Center Utrecht, Utrecht University, Utrecht, the Netherlands
Petronella O. Witteveen * Department of Gynaecological Oncology, Cancer Center, University Medical Center Utrecht, Utrecht University, Utrecht, the Netherlands Ronald P. Zweemer * The
Netherlands Princess Máxima Center for Pediatric Oncology, Utrecht, the Netherlands Hans Clevers Authors * Oded Kopper View author publications You can also search for this author inPubMed
Google Scholar * Chris J. de Witte View author publications You can also search for this author inPubMed Google Scholar * Kadi Lõhmussaar View author publications You can also search for
this author inPubMed Google Scholar * Jose Espejo Valle-Inclan View author publications You can also search for this author inPubMed Google Scholar * Nizar Hami View author publications You
can also search for this author inPubMed Google Scholar * Lennart Kester View author publications You can also search for this author inPubMed Google Scholar * Anjali Vanita Balgobind View
author publications You can also search for this author inPubMed Google Scholar * Jeroen Korving View author publications You can also search for this author inPubMed Google Scholar *
Natalie Proost View author publications You can also search for this author inPubMed Google Scholar * Harry Begthel View author publications You can also search for this author inPubMed
Google Scholar * Lise M. van Wijk View author publications You can also search for this author inPubMed Google Scholar * Sonia Aristín Revilla View author publications You can also search
for this author inPubMed Google Scholar * Rebecca Theeuwsen View author publications You can also search for this author inPubMed Google Scholar * Marieke van de Ven View author publications
You can also search for this author inPubMed Google Scholar * Markus J. van Roosmalen View author publications You can also search for this author inPubMed Google Scholar * Bas Ponsioen
View author publications You can also search for this author inPubMed Google Scholar * Victor W. H. Ho View author publications You can also search for this author inPubMed Google Scholar *
Benjamin G. Neel View author publications You can also search for this author inPubMed Google Scholar * Tjalling Bosse View author publications You can also search for this author inPubMed
Google Scholar * Katja N. Gaarenstroom View author publications You can also search for this author inPubMed Google Scholar * Harry Vrieling View author publications You can also search for
this author inPubMed Google Scholar * Maaike P. G. Vreeswijk View author publications You can also search for this author inPubMed Google Scholar * Paul J. van Diest View author publications
You can also search for this author inPubMed Google Scholar * Petronella O. Witteveen View author publications You can also search for this author inPubMed Google Scholar * Trudy Jonges
View author publications You can also search for this author inPubMed Google Scholar * Johannes L. Bos View author publications You can also search for this author inPubMed Google Scholar *
Alexander van Oudenaarden View author publications You can also search for this author inPubMed Google Scholar * Ronald P. Zweemer View author publications You can also search for this
author inPubMed Google Scholar * Hugo J. G. Snippert View author publications You can also search for this author inPubMed Google Scholar * Wigard P. Kloosterman View author publications You
can also search for this author inPubMed Google Scholar * Hans Clevers View author publications You can also search for this author inPubMed Google Scholar CONTRIBUTIONS Conceptualization:
O.K. and H.C. Methodology: O.K. and H.C. Software: J.E.V.-I., M.J.v.R., L.K. and W.P.K. Formal analysis: O.K., K.L., N.H., J.E.V.-I., M.J.v.R., T.J., P.J.V.D., S.A.R., L.K. and W.P.K.
Investigation: O.K., K.L., C.J.d.W., N.H., A.V.B., H.B., J.K., S.A.R., L.K., N.P., R.T., L.M.v.W. and B.P. Resources: C.J.d.W., L.M.v.W., H.V., M.P.G.V., V.W.H.H., B.G.N., P.O.W., M.V.D.V.,
T.B, K.N.G. and R.P.Z. Data curation: O.K., C.J.d.W. and J.E.V.-I. Writing—original draft: O.K., C.J.d.W., J.E.V.-I., W.P.K. and H.C. Visualization: O.K., C.J.d.W., K.L., J.E.V.-I., W.P.K.,
L.K. and N.H. Supervision: M.V.D.V., J.L.B., R.P.Z., H.J.G.S., W.P.K., A.v.O. and H.C. Project administration: O.K., C.J.d.W., W.P.K. and H.C. Funding acquisition: J.L.B., R.P.Z., P.O.W.,
W.P.K. and H.C. CORRESPONDING AUTHORS Correspondence to Wigard P. Kloosterman or Hans Clevers. ETHICS DECLARATIONS COMPETING INTERESTS The authors declare no competing interests. ADDITIONAL
INFORMATION PUBLISHER’S NOTE: Springer Nature remains neutral with regard to jurisdictional claims in published maps and institutional affiliations. EXTENDED DATA EXTENDED DATA FIG. 1
DERIVATION AND MORPHOLOGICAL DIFFERENCES OF OC ORGANOIDS. A, Schematic of OC organoid derivation. B, Bright-field images of MBT, SBT, MC, LGS, END and CCC organoids (left to right),
depicting different organoid morphologies. Morphological description of 50 independent organoid lines is provided in Supplementary Table 6. Scale bar, 100 μm. C, Bright-field (top) and SEM
(bottom) images demonstrating main morphologies among different HGS organoid lines. Starting with cystic and well-organized cellular polarity, where microvilli are directed toward the
organoid lumen (most left) to dense organoids that gradually (from left to right) show reduced circularity and cellular cohesiveness up to a grape-like shape morphology (most right). Scale
bar, 100 μm. D, High-magnification H&E staining images displaying representative examples of HGS organoid morphologies as well as nuclear and cellular atypia, typically displayed by HGS
tumors. Histological description of 50 independent organoid lines is provided in Supplementary Table 6. Scale bar, 100 μm. EXTENDED DATA FIG. 2 ORGANOID PASSAGE NUMBER OVERVIEW AND NORMAL
CELL CONTAMINATION IN TUMORS AND ORGANOIDS. A, Column bar graph depicting organoid maximum passage number up until the moment of submission. Organoids that stopped/slowed down their growth
are indicated in orange. B, Representative images of Ki67 staining of six independent organoid lines show a high percentage of ki67-positive proliferating cells. C, Histological and
immunohistochemical images of tumor tissue (derived from two independent patients) showing tumor cell purity within different samples, based on H&E and p53 staining. Scale bar, 0.5 mm.
D, Tukey box-and-whisker plot (1.5× interquartile range) presenting bioinformatic estimation of tumor cell purity percentage of both tissue (_n_ = 35) and organoid (_n_ = 36) based on WGS
data using PURPLE. Horizontal bars represent median of all dots. Mean and standard deviation across all samples are as follows: 45 ± 9.2% (tissue) and 88.1 ± 23% (organoids). E, Stacked bar
chart showing the percentage of organoid lines that are positive for p53, PAX8 and periodic acid–Schiff (PAS) staining (orange) and negative (blue) grouped per original tumor staining status
(see also Supplementary Table 6). Total number (_n_) of tissues stained per group are indicated. EXTENDED DATA FIG. 3 FT AND OSE ORGANOIDS. A, An overview image of normal FT organoids
embedded in 40 μl BME drops, displaying a cystic morphology. All FT organoid lines that were established (_n_ = 22) displayed cystic morphology. B, Representative SEM image showing ciliated
cells facing FT organoid lumen. Scale bar, 50 μm. SEM was performed on one FT organoid line. C, Histological analysis of FT organoids demonstrating H&E, Ki67, PAX8 and Ac-α-tubb
staining. Histological analysis was performed on three independent FT organoid lines with similar results. Scale bar, 100 μm. D, An overview image of normal OSE organoids embedded in 40 μl
BME drops displaying cystic morphology (top left image). Seven out of eight OSE organoid lines that were established displayed cystic morphology. OSE organoid images of H&E, Ki67 and
cytokeratin 8 (CK8) staining, demonstrating a cystic morphology of proliferative epithelial cells. Histological analysis was performed on two independent OSE organoid lines with similar
results. Scale bar, 100 μm. E, First row: bright-field images of LGS-2.2 (left) and OSE(P)7 (right) organoid lines. Unlike normal FT and OSE that display cystic morphology both lines show
dense phenotype. OSE(P)7 is the only OSE organoid line that display dense phenotype. Scale bar, 200 μm. Second to last rows: histological and immunohistochemical images demonstrate that
organoids are positively stained for PAX8 and WT1, markers of OC serous subtypes. Organoids display reduced cellular organization in comparison to normal FT and OSE organoids. Scale bar, 100
μm. F, Scatter plot presenting metaphase spread analysis and mean for each line. Both lines present aneuploidy. EXTENDED DATA FIG. 4 GENOME-WIDE TUMOR AND ORGANOID PAIR COMPARISON. A,
Genome-wide CNVs in tumor/organoid pairs (black, tumors; pink, organoids early passage; blue, organoids late passage) depicting gains (red) and losses (blue). B, Number of shared (yellow)
and unique (blue) SNVs (on the left) and SVs (on the right) between tumor/organoid pairs. Shared variants are those that can be found in the corresponding paired sample. Passage number at
which organoid lines were sequenced is given in Supplementary Table 7. EXTENDED DATA FIG. 5 MOLECULAR CHARACTERIZATION, DRUG SCREENING AND XENOGRAFTS OF OC ORGANOIDS. A, Tukey box and
whisker plot (1.5× interquartile range) summarizing the percentage of shared variants across all tumor (red) and organoid (green) samples. Right and left panels display SNVs and SVs,
respectively. Horizontal bars represent median of all dots. Mean and standard deviation across all samples are as follows: SNVs, 82.95 ± 8.18% (tissue, _n_ = 31) and 75.62 ± 23.13%
(organoids, n = 31); SVs, 78.14 ± 22.11% (tissue, _n_ = 31) and 60.47 ± 29.13% (organoids, _n_ = 31). Samples with a low percentage of shared variants are indicated. B, Heat map of five
independent organoid lines from both early and late passages based on 11,720 methylation probes. The heat map colors represent Pearson correlation values, as calculated from the methylation
beta-values. Clustering of the correlation values was performed using hierarchical clustering based on complete linkage. C, Scatter plot of AUC values across all drug screening data,
displaying high correlation between technical replicates (Pearson correlation = 0.94, _R_2 = 0.88, _n_ = 105). D, Scatter plot of AUC values of biological replicates, displaying high
correlation (Pearson correlation = 0.87, _R_2 = 0.74, _n_ = 45). Colored dots represent biological replicates in which passage differences between experimental repetition is as follows: 1–2
passages, _n_ = 29 (black); 3–5 passages, _n_ = 10 (blue) and 13–22 passages, _n_ = 6, (red), demonstrating stable drug sensitivity even after prolonged passaging. E, Box-and-whisker plot
(10th–90th percentile) showing _Z_-factor distribution and mean across all drug screening plates. Mean = 0.61, ranging between 0.2 and 0.91, _n_ = 55. F, Bioluminescence imaging of mice,
orthotopically transplanted with luciferase expressing organoid lines depicting tumor growth. A summary of organoid-derived xenograft experiments is presented in Supplementary Table 8. G,
p53 staining of organoid-derived xenograft (HGS-3.1) on orthotopic transplantation into the mouse bursa shows p53 overexpression in tumor cells. H, Histological analysis of an
organoid-derived xenograft (MC-2.1) on subcutaneous transplantation. H&E staining shows haphazardly arranged neoplastic glands lined by columnar cells with variable numbers of goblet
cells (arrows), which are specific features of MC. A summary of organoid-derived xenograft experiments is presented in Supplementary Table 8. Left image scale bar, 1 mm. Right image scale
bar, 200 μm. EXTENDED DATA FIG. 6 CRISPR–CAS9 MEDIATED GENETIC MANIPULATION IN FT ORGANOIDS. A, Schematic of normal FT organoid electroporation. FT organoids were dissociated into small cell
clumps and electroporated with either an empty vector or a vector containing a gRNA directed against _TP53_. Cells were plated and after 2 d of recovery nutlin3a was added. B, Overview
images of organoids 2 weeks after electroporation. Organoids that were electroporated with an empty vector and not treated with nutlin3a showed nice recovery following electroporation (top),
whereas the growth of organoids electroporated in a similar manner was dramatically inhibited when nutlin3a was added (middle). Surviving clones that are not inhibited by nutlin3a treatment
are visible only when organoids were electroporated with a vector containing _TP53_ gRNA (bottom). Four independent electroporation experiments followed by nutlin3A treatment were conducted
giving rise to multiple Nutlin3A resistant clones. C, A representative flow cytometry analysis of organoids 48 h following electroporation demonstrating 25% of the cell express GFP. Summary
of six independent repetitions of this experiment are presented in D. D, Box-and-whisker plot (minimum to maximum) showing the percentage of GFP positive cells following electroporation.
Horizontal bars and dashed horizonal bars represent median and mean of all dots, respectively. Mean ± s.d. = 23.8 ± 5.5%, median = 25.5%. Six independent experiments that were conducted with
three different FT organoid lines are presented, demonstrating high and robust electroporation efficiency. E, An example of CRISPR–Cas9 mediated editing of _TP53_ gene in FT organoids.
Targeted locus is presented and gRNA (solid line), PAM sequence (red highlight) and cut point (arrow head) are indicated. Sequencing results revealed out-of-frame deletions induced by
CRISPR–Cas9 editing. F, Table presenting six FT genetically engineered clones derived from two independent donors (FT(P)1 and FT(P)2). For each clone, targeted gene description (in both
_TP53_ and _RB1_ genes) including HGVS nomenclature is presented. (HET, heterozygous; HOM, homozygous). G, BF images (top) and H&E staining (bottom) of four independent clones show
deviation from cystic and well-organized normal FT organoid morphology. Passage number is indicated. This analysis was conducted on three independent TP clones (loss-of-function mutations in
the _TP53_ gene) and three independent TPR clones (loss-of-function mutations in the _TP53_ and _RB1_ genes) with similar results. H, Heat map of Spearman correlation values of three
independent normal FT organoid lines (derived from different donors) and genetically engineered clones (_n_ = 3 independent TP clones (loss-of-function mutations in the _TP53_ gene) and 3
independent TPR clones (loss-of-function mutations in the _TP53_ and _RB1_ genes)), using RNA-seq expression data. Read counts were normalized for sequencing depth and the 1,000
most-variable genes were used. Clones were assigned into different groups according to their mutational profile. SUPPLEMENTARY INFORMATION SUPPLEMENTARY TABLES Supplementary Tables 2, 4 and
8 REPORTING SUMMARY SUPPLEMENTARY TABLES Supplementary Tables 1, 3, 5–7 and 9–11 SUPPLEMENTARY VIDEO 1 High speed time-lapse imaging of normal FT line with beating cilia. High magnification
of FT organoid epithelial cell layer and lumen. Beating ciliated cells are directed into the organoid lumen. High speed time-lapse imaging was conducted on one FT organoid line.
SUPPLEMENTARY VIDEO 2 Live cell imaging of chromosomal segregation in OC organoids (HGS-3.2). Four independent organoid lines were subjected to confocal imaging for 11 h with 4 min
intervals. All demonstrated normal and abnormal chromosomal segregations. Shown is a representative time-lapse imaging of HGS-3.2 line. Upper right panel shows H2B-Neon fluorescence after
maximum-projection of three-dimensional _z_-stacks; upper left panel displays the same data, color coded for depth (_z_), facilitating tracking of individual events; lower panels consist of
transmitted light images with and without merged H2B-Neon (green). Scale bar, 20 μm SUPPLEMENTARY VIDEO 3 Live cell imaging of chromosomal segregation in OC organoids (HGS-3.2). Example of
normal chromosomal segregation. Color coded for depth (_z)_. SUPPLEMENTARY VIDEO 4 Live cell imaging of chromosomal segregation in OC organoids (HGS-3.2). Example of chromosomal segregation
into three poles and lagging chromosomes. Color coded for depth (_z_). SUPPLEMENTARY VIDEO 5 Live cell imaging of chromosomal segregation in OC organoids (HGS-3.2). Example of chromatin
bridge during chromosomal segregation. Color coded for depth (_z_). SUPPLEMENTARY VIDEO 6 Live cell imaging of chromosomal segregation in OC organoids (HGS-3.2). Example of mitotic
catastrophe that follows chromosomal segregation into three poles. Color coded for depth (_z_). RIGHTS AND PERMISSIONS Reprints and permissions ABOUT THIS ARTICLE CITE THIS ARTICLE Kopper,
O., de Witte, C.J., Lõhmussaar, K. _et al._ An organoid platform for ovarian cancer captures intra- and interpatient heterogeneity. _Nat Med_ 25, 838–849 (2019).
https://doi.org/10.1038/s41591-019-0422-6 Download citation * Received: 28 November 2017 * Accepted: 12 March 2019 * Published: 22 April 2019 * Issue Date: May 2019 * DOI:
https://doi.org/10.1038/s41591-019-0422-6 SHARE THIS ARTICLE Anyone you share the following link with will be able to read this content: Get shareable link Sorry, a shareable link is not
currently available for this article. Copy to clipboard Provided by the Springer Nature SharedIt content-sharing initiative