- Select a language for the TTS:
- UK English Female
- UK English Male
- US English Female
- US English Male
- Australian Female
- Australian Male
- Language selected: (auto detect) - EN
Play all audios:
ABSTRACT Intrinsically disordered proteins can bind via the formation of highly disordered protein complexes without the formation of three-dimensional structure1. Most naturally occurring
proteins are levorotatory (l)—that is, made up only of l-amino acids—imprinting molecular structure and communication with stereochemistry2. By contrast, their mirror-image dextrorotatory
(d)-amino acids are rare in nature. Whether disordered protein complexes are truly independent of chiral constraints is not clear. Here, to investigate the chiral constraints of disordered
protein–protein interactions, we chose as representative examples a set of five interacting protein pairs covering the disorder–order continuum. By observing the natural ligands and their
stereochemical mirror images in free and bound states, we found that chirality was inconsequential in a fully disordered complex. However, if the interaction relied on the ligand undergoing
extensive coupled folding and binding, correct stereochemistry was essential. Between these extremes, binding could be observed for the d-ligand with a strength that correlated with disorder
in the final complex. These findings have important implications for our understanding of the molecular processes that lead to complex formation, the use of d-peptides in drug discovery and
the chemistry of protein evolution of the first living entities on Earth. SIMILAR CONTENT BEING VIEWED BY OTHERS ROLE OF CHARGES IN A DYNAMIC DISORDERED COMPLEX BETWEEN AN IDP AND A FOLDED
DOMAIN Article Open access 04 April 2025 CHIRALITY TRANSMISSION IN MACROMOLECULAR DOMAINS Article Open access 10 January 2022 IDENTIFICATION OF LIGAND BINDING SITES IN INTRINSICALLY
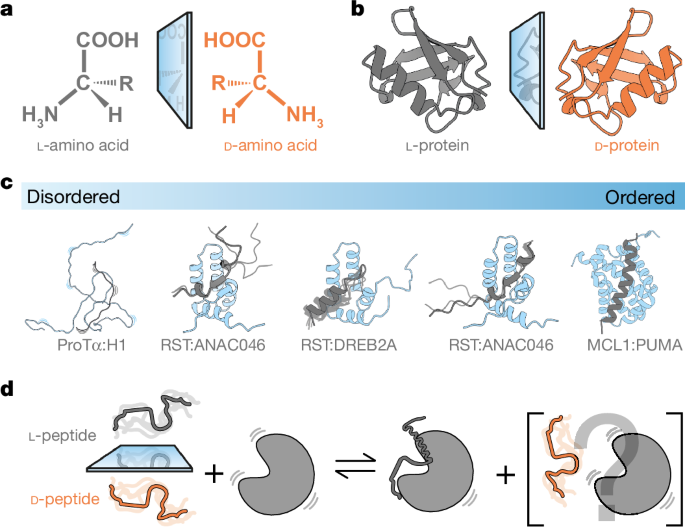
DISORDERED PROTEINS WITH A DIFFERENTIAL BINDING SCORE Article Open access 19 November 2021 MAIN The stereochemistry of amino acids, and therefore of proteins, is biological canon. The
chirality of the Cα atom means that the mirror images (enantiomers) of amino acids cannot be superimposed—that is, they have a ‘handedness’. Amino acids in nature are predominantly
‘left-handed’ or levorotatory (l), whereas their enantiomers are ‘right-handed’ or dextrorotatory (d) (Fig. 1a)—so named because of how they affect circularly polarized light3. Thus, l- and
d-amino acids and proteins composed of l- and d-amino acids (l- and d-proteins, respectively) are mirror images of each other (Fig. 1b). The preference for l-proteins is so strong that we
may generally say that l-proteins make up the molecular structure and machinery of Nature. However, d-amino acids do exist, and Nature typically exploits these in signalling, as free amino
acids, or in defence systems, as parts of short peptides, or in peptidoglycans (for example, in the bacterial cell wall4,5), as neurotransmitters6, toxins and venoms7, and as antibiotics8
(reviewed in ref. 9). Proteins are key to the activity of biological systems; they function through interactions with one or several binding partners. It is widely accepted that the
d-enantiomer of a protein would be unable to bind a partner l-protein. However, in a pharmaceutical context, it would be desirable to overcome this lack of binding, owing to the metabolic
stability of d-peptides in biological systems, where they are not recognized by natural metabolic processes10. Thus, peptides based on d-amino acids have been explored as constituents of
peptide drugs and synthetic d-proteins have been used as scaffolds for screening natural or de novo designed l-peptides in mirror-image phage displays11,12. In the ‘retro-inverso’ strategy,
d-amino acid-based peptides mimic the l-peptide enantiomer when the d-amino acid sequence is produced in reverse13. This strategy relies on the d-peptide forming the same secondary structure
as the l-peptide, enabling interaction with its l-protein binding partners. Examples can be found in the treatment of diabetes14,15, breast cancer16 and inflammation17. The past 25 years
have uncovered the functional relevance of intrinsically disordered proteins and protein regions (referred to collectively here as IDPs) existing in dynamic ensembles of interconverting
conformations1. Although structural disorder can persist in complexes and has important functional roles there, it remains unclear whether IDPs are confined to chiral constraints18,19,20.
The continuum of complexes formed by IDPs ranges from folded, induced-fit interactions to fuzzy, or fully disordered complexes with structural heterogeneity21,22. Not much is known about the
atomic structure of heterogeneous complexes, and less is known about the structure of fully disordered complexes where the ligand at the extreme can be comparably dynamic in the free and
the bound states22,23. This raises the fundamental question of whether these complexes are truly independent of 3D topology and thus independent of the chiral constraints of folded
complexes, or whether there are configurational constraints, perhaps too subtle to be resolved experimentally. To answer this question, we selected an assortment of interacting protein pairs
in which the ligand is disordered in its unbound state, and either stays disordered in the complex or adopts different degrees of structure upon binding (Fig. 1c). Peptide ligands were
synthesized using d-amino acids and their binding to folded partners was compared to that of their l-peptide enantiomers using a range of biophysical and structural methodologies (Fig. 1d).
We found that sensitivity to chirality in binding correlates with retained disorder in the complex, with fully disordered protein complexes forming regardless of the ‘handedness’ of the
ligand. To test whether disordered protein interactions could persist regardless of chirality, we initially focused on the interaction of prothymosin-α (ProTα) with histone H1.0 (H1), which
has been shown to be a high-affinity, disordered interaction22,24 (Fig. 1c). We used a 21-residue peptide from the C-terminal tail of H1, H1155–175 (Fig. 2a), which contains a high charge
density with a fraction of charged residues of 0.52 (Extended Data Table 1), and procured l- and d-enantiomers (l-H1155–175 and d-H1155–175). Far-UV circular dichroism (CD) confirmed that
the two peptides were mirror images of each other (Fig. 2b), and nuclear magnetic resonance (NMR) spectroscopy analyses showed identical chemical shifts (Extended Data Fig. 1a). The CD
spectra also showed that the peptides were disordered, as expected. We next used NMR to measure the chemical shift perturbations (CSPs) of ProTα caused by each enantiomer upon their
addition. In this case, we found that l-H1155–175 and d-H1155–175 produced similar CSPs in ProTα (Fig. 2c), which we quantified by calculating the difference between the CSPs induced by l-
and d-enantiomers (ΔCSPl-d) at equimolar concentrations of each enantiomer of the H1155–175 peptide (Fig. 2d). We probed the affinity (_K_d) and thermodynamic properties using isothermal
titration calorimetry (ITC), finding the same values for the enantiomers in terms of _K_d (Fig. 2e and Extended Data Table 2). We observed that the changes in binding enthalpy (−_T_Δ_S_) and
entropy (Δ_H_) were similar for l-H1155–175 and d-H1155–175 (Extended Data Table 2), and that the _K_d value was in the low micromolar range for both enantiomers. ProTα and full-length H1
interact with nanomolar to picomolar affinity at near-physiological ionic strength22,24, but we observed micromolar affinity with the peptides, mostly because of the lower total charge of
the H1155–175 fragment (ProTα: −43 (or −44 depending on isoform24); l/d-H1155–175: + 11; full-length H1: + 53). We also obtained binding affinities using single-molecule Förster resonance
energy transfer (smFRET) spectroscopy, labelling ProTα with donor and acceptor fluorophores (Fig. 2f). The agreement between the affinities obtained by ITC and smFRET using very different
ProTα concentrations suggests that the complex is predominantly of 1:1 stoichiometry (Fig. 2). Furthermore, analogous to the NMR CSPs, the smFRET data showed that the changes in transfer
efficiencies on binding are very similar for l-H1155–175 and d-H1155–175, indicating that the conformational ensembles of ProTα bound to l-H1155–175 or d-H1155–175 are highly similar, again
highlighting that there is no significant difference between the interactions of ProTα with the l- or d-enantiomers of H1155–175. As an example, representing the other end of the
disorder–order continuum, we probed the interaction between induced myeloid leukaemia cell differentiation protein (MCL1) and p53 upregulated modulator of apoptosis (PUMA, also known as
Bcl-2-binding component 3) l- and d-peptides (Extended Data Table 1). This nanomolar-affinity complex has previously been characterized as a folding-upon-binding induced-fit interaction that
leads to the folding of disordered PUMA130–156 into a stable α-helix within the complex25 (Figs. 1c and 2g). We therefore postulated that the d-enantiomer of PUMA would be unlikely to bind
MCL1. As PUMA tends to form homodimers in solution, we used the strictly monomeric M144I variant, which is a fully functional binding partner of MCL126. Far-UV CD and NMR analyses indicated
that the PUMA peptide was disordered, with l- and d- enantiomers producing mirror-image CD spectra and identical chemical shifts (Fig. 2h and Extended Data Fig. 1). We first performed ITC
using the same concentrations for both l-PUMA and d-PUMA, finding that l-PUMA bound with nanomolar affinity, whereas d-PUMA appeared not to bind (Fig. 2i and Extended Data Table 2). By
increasing the concentrations of both MCL1 and d-PUMA considerably, we were able to observe a _K_d value in the high micromolar to low millimolar range (Fig. 2j). All thermodynamic
properties (Extended Data Table 2) were very different for l-PUMA and d-PUMA, which further suggests that there is a fundamental difference between l-PUMA and d-PUMA in their ability to
interact with MCL1. We then compared the NMR CSPs induced at equally saturated levels (90% bound) of either l-PUMA or d-PUMA to MCL1. Only l-PUMA caused substantial CSPs for MCL1 (Fig. 2k).
Since the interaction between MCL1 and l-PUMA was in slow exchange on the NMR timescale, the relative contributions of the bound and unbound species could be assessed from relative peak
intensities. Reduced intensity of peaks representing the free state of MCL1 was observed in the presence of d-PUMA, suggesting some compatibility but a failure to achieve the folded bound
state, as also supported by the very small chemical shift changes in MCL1 (Fig. 2l). This might indicate that d-PUMA can interact weakly with MCL1 but cannot undergo the folding required for
an induced-fit interaction. Overall, using l- and d-peptides and comparing interactions at the extremes of the disorder–order continuum confirms the need for homochirality in structurally
ordered complexes. However, a fully disordered heterochiral complex can form, even with binding characteristics that are indistinguishable from the natural counterpart. Having probed the
extremes of the disorder–order continuum, the next step was to understand how intermediate systems respond to chirality. As intermediate systems, we used the RCD1–SRO–TAF4 (RST) domain from
RCD1, interacting with various transcription factors that form different degrees of structure in their RST-bound states27 (Fig. 1c). We characterized interactions of RST with l- and
d-peptides derived from the transcription factors ANAC046 (ANAC046319–338; Fig. 3a), DREB2A (DREB2A255–272; Fig. 3b) and ANAC013 (ANAC013254–274; Fig. 3c and Extended Data Table 1). Previous
far-UV CD analyses suggested an induced helical structure for the DREB2A in complex with RST; an effect that was less pronounced for the two other ligands27. Whereas an NMR-based HADDOCK
model exists for the RST–DREB2A complex28 (Fig. 3b), the structures formed by ANAC046 and ANAC013 in their complexes with RST were unknown. Thus, we generated a structural prediction for
these interactions using AlphaFold329,30 (Fig. 3a,c and Extended Data Fig. 2). We first confirmed using far-UV CD and NMR that the l- and d-peptides were disordered and enantiomeric (Fig.
3a–c and Extended Data Fig. 1). To determine the thermodynamics and the affinity of the interactions of l- or d-peptides with RST, we used ITC (Fig. 3d−f and Extended Data Table 2). We
observed very different thermodynamic profiles for the three l-peptides, with more favourable enthalpy (\(\Delta {H}^{^\circ }\)) for DREB2A and ANAC013 than for ANAC046, whereas the
opposite was the case for the entropy (\(-T\Delta {S}^{^\circ }\)), suggesting that the complexes had different characteristics. Comparing the effect of stereochemistry, we observed larger
differences in _K_d values as the interactions probably became more structured—that is, the difference between l-ANAC046 and d-ANAC046 was 15-fold (Fig. 3d), the difference between l-DREB2A
and d-DREB2A was 72-fold (Fig. 3e) and the difference between l-ANAC013 and d-ANAC013 500-fold (Fig. 3f). The trend suggested that the amount of structure required for binding reduced the
propensity of the d-enantiomer to interact with RST. This interpretation was further supported by comparing ΔCSPl-d of RST induced by ANAC046 (Fig. 3g), DREB2A (Fig. 3h) and ANAC013 (Fig.
3i). The ΔCSPl-d values of RST were substantial upon addition of ANAC013 and minimal upon addition of ANAC046. The same trend was observed in the pattern of peak intensity changes of RST
(Extended Data Fig. 3), suggesting that ANAC046 is relatively disordered in complex with RST, whereas ANAC013 is more structured, and therefore less likely to interact with RST as a
d-enantiomer. The ΔCSPl-d values of RST for binding of DREB2A were between those for binding of ANAC046 and ANAC013, consistent with the differences in binding affinity for RST and effect of
the d-enantiomer. Finally, we extracted _K_d values and the dissociation rate constant (_k_off) after fitting NMR titration data to a two-state model using NMR 2D lineshape analysis31,32
(Extended Data Fig. 4), finding only minor effects of stereochemistry on the transition state energies (−2 to 1 kJ mol−1 (ΔΔ_G_unbound-‡,d-l)) (Extended Data Fig. 5 and Extended Data Table
3). This observation highlights that the major effect of stereochemistry occurs after the transition state, in agreement with previous observations that native contacts consolidate late in
the binding reaction pathway of IDPs33,34,35. In summary, it is apparent that the stereosensitivity of protein–protein interactions is not an all-or-none phenomenon, but instead occurs on a
continuum. The results presented here indicate that sensitivity to chirality reflects the degree of disorder in the native complex. To understand the sensitivity to chirality better, we
investigated the RST complexes in more detail. We obtained insight into the RST-bound structures from Cα chemical shifts determined from chemical exchange saturation transfer (CEST) NMR for
l-ANAC046 (Extended Data Fig. 6) and ZZ-exchange NMR for l-ANAC013 (Extended Data Fig. 7; 50% saturation), comparing them to similar available data for l-DREB2A28. A distinct pattern in
structure emerges from the secondary chemical shifts (SCSs) (Fig. 4a). In their bound state, all three peptides have a similar core region comprising a short strand followed by a turn.
Comparing the SCSs to the AlphaFold3-predicted structures of the complexes shows remarkable agreement between the NMR data and the predicted structures (Fig. 4a,b) unanimously suggesting the
existence of a common structural core in all three bound RST partners. Aligning the peptides based on the core structure displaces the conserved Phe/Tyr residue of the sequence-based
RST-binding motif27 to align with an acidic and hydrophobic residue, respectively, suggesting that features beyond specific residue types are important (Fig. 4c). Indeed, all core structures
are highly acidic and hydrophobic with a large and similar salt dependence in RST binding (Fig. 4d and data in ref. 36), further supporting the idea that binding of the core structure to
RST is dependent on geometrically relaxed hydrophobic, ionic and π–cation interactions. DREB2A and ANAC013 form additional structures in the core flanking regions, extending into a helix
C-terminally (DREB2A) and forming a helical turn N-terminally (ANAC013) (Fig. 4a). This additional structuring was confirmed by the transverse relaxation rates (_R_2 rates) obtained in the
free and RST-bound states (Fig. 4c). In the bound states, DREB2A showed increased _R_2 rates in the C-terminal flanking region, and ANAC013 increased _R_2 rates in the N-terminal flanking
region, compared with ANAC046 (Fig. 4c). Within the core structure, the number of residues exhibiting dynamics on an intermediate timescale originating from exchange between free and bound
states or from heterogeneity in the bound state differed, as indicated by increased _R_2 rates or missing signals. In complex with RST, ANAC046 showed increased dynamics in its core
structure compared with that of DREB2A, which again was more dynamic than in ANAC013 (Fig. 4c). This observation provides an explanation for the observed variation in sensitivity to
chirality, suggesting that the RST complexes with greater bound-state dynamics are less sensitive to chirality. The enthalpic and entropic contributions to binding provide insight into the
interaction mechanisms37,38 (Fig. 4e). For the RST complexes, a linear relationship between the changes in enthalpy and entropy is observed across the binding partners, with disordered and
d-enantiomer interactions producing smaller changes and an entropic driving force (Fig. 4f). d-DREB2A and d-ANAC013 still bind and do so with an affinity and a thermodynamic profile
analogous to those of l-ANAC046 and d-ANAC046. The thermodynamics of RST binding to l-ANAC046 and d-ANAC046 are similar, and in both cases, binding is driven by both entropy and enthalpy,
highlighting a near independence from stereochemistry. Assuming that the interaction in these two cases mainly involves the core structure, this on its own has an affinity in the low
micromolar range. As the thermodynamic profiles and the affinities for d-DREB2A and d-ANAC013 are similar to those for l-ANAC046 and d-ANAC046, their flanking regions are likely to engage
very little with RST in the bound state (Fig. 4e). To assess the apparent graded response to chirality, we calculated for each binding pair the difference in ∆_G_ between l- and d-peptides
(∆∆_G_d-l) and normalized the ∆∆_G_d-l to the strength of the interaction by dividing by the Gibbs free energy of binding the l-enantiomer |∆_G_L| (Fig. 4f). There is no difference in these
parameters between l-H1155–175 and d-H1155–175 interacting with ProTα, whereas interactions requiring backbone structuring show larger ∆∆_G_ values, which increase when more backbone
structure is formed. When optimal binding is independent of backbone folding, ambidextrous binding emerges, as for the RST:ANAC046 interaction and is most pronounced for the ProTα:H1
interaction. As more backbone folding occurs, as for the flanking regions of DREB2A and ANAC013 and for PUMA, the dynamics decreases and sensitivity towards chirality increases. Finally,
focusing on the folded partner, we assessed the sensitivity to chirality across all systems. We correlated the total CSP induced by the l-enantiomer (CSPtotal–l; Methods) to the
stereosensitivity expressed by the fractional loss of binding energy (∆∆_G_d-l/∣Δ_G_l∣). Although the CSPtotal_l is a crude measure that depends, for example, on the size of the protein, the
number of residues involved in binding, resolved peaks, dynamics, allostery and the chemistry, we observe a correlation between the NMR data for l-enantiomer binding and stereosensitivity
(Fig. 4g). Thus, the larger the CSPtotal_L of the folded partner, the greater the stereosensitivity. In conclusion, the analyses of the RST complexes highlight that the propensity for
interaction with a d-enantiomer, and thus the sensitivity towards chirality, depends on the extent of disorder and dynamics in the complex. Extending to the full set of five protein pairs,
we find that CSPs of the binding partner could provide a method for predicting stereosensitivity. DISCUSSION It is counterintuitive that an l-protein should be able to interact with a
d-version of its natural partner. However, when considered further, we interrogated whether this applies to a truly disordered interaction. We find that protein complexes that are fully
disordered (for example, ProTα:H1) form regardless of chirality. To our surprise, the observation was not limited to completely disordered polyelectrolyte binding partners. Instead, the
propensity for interaction between l- and d-proteins exists on a continuum of disorder and order, irrespective of charge and hydrophobicity. The more disordered and dynamic the complex is,
the less sensitive it is to chirality (Fig. 4 and Extended Data Table 1). These results, which were obtained from analyses of a set of five different complexes involving IDPs, provide an
approach for assessing the degree of disorder within a protein complex directly from its sensitivity to chirality and vice versa. The approach is applicable not only in the case of a fully
disordered complex driven by electrostatics, but also for complexes in which critical side chain interactions can be accommodated with adaptable and limited backbone structuring. This
continuum of stereosensitivity has translational applications in drug design and implications for our understanding of protein evolution. Chirality is an important feature for interactions
that rely on structure or the formation of structure, but an electrostatic, disordered interaction can proceed regardless. Each of the peptides studied here relies on electrostatics to
interact with their respective binding partner24,28,39, therefore, the determining factor appears to be the degree of disorder. PUMA forms an encounter complex with MCL1 owing to long-range
electrostatics39, and electrostatics are also integral to the interactions of RST28 (Fig. 4d). For the RST:ANAC046 complex, the interaction is achieved by arranging a few hydrophobic side
chains, charges and π-electrons in a way that requires minimal backbone structuring of the core structure providing low sensitivity to chirality. Conversely, interactions of DREB2A and
ANAC013 that rely on more extensive backbone folding have higher sensitivity to chirality. Thus, stereosensitivity appears to be rooted in backbone folding. Notably, adaptation of the
associating folded partner also contributes to the sensitivity to chirality. The central core structure, present in all tested RST partners, binds almost independently of chirality in a
dynamic state driven by both entropy and enthalpy, while interactions of the flanking regions of the bound DREB2A and ANAC013 impose order, both to the core structure and to the flanking
regions. Such strong enthalpy–entropy compensation within the core binding region imposed by dynamic flanking regions was reported previously for the N-terminal flanking region of DREB2A40,
and the larger enthalpic contribution for DREB2A binding shows that context matters41. In this study, we have investigated the disorder–order continuum of protein interactions with similar
electrostatic and hydrophobic features (Extended Data Table 1). However, we do not know whether fully disordered hydrophobic complexes exist and whether they are sensitive to chirality,
although hydrophobic ligands have been shown to remain disordered in complexes42, and chaperones (such as GroEL/ES) can assist the folding of both l- and d-enantiomers43. Research into
highly hydrophobic d-amino acid-based transcriptional coactivators has demonstrated that they can induce transcription to a similar level as their l-enantiomer counterparts44, suggesting
that at least some hydrophobic disordered proteins can still be functional regardless of chirality. An implication from our work is that such functional hydrophobic disordered complexes
probably rely little on backbone folding. Thus, as IDPs have been historically difficult to target, requiring novel strategies45,46, the presented results have substantial implications for
the development of new, stable d-peptide drugs directed against IDPs. Protein–protein interactions are fundamental for sustaining the information network that separates life from non-living
systems. For simplicity, we assume that the quantities of abiotic amino acids of either chirality in the ‘primordial soup’ were equal47. Moreover, peptide bonds may form equally well between
l-amino acids and d-amino acids, d-amino acids and d-amino acids, or l-amino acids and l-amino acids48. Therefore, peptide–peptide interactions between heterochiral peptides can be
envisaged to have existed before biological systems became homochiral49. METHODS SYNTHETIC PEPTIDES Synthetic l- and d-peptides of H1155–175, PUMA130–156, ANAC013254–274, ANAC046319–338 and
DREB2A255–272 were purchased from Pepscan (now Biosynth) at a minimum purity of 95% and purified by HPLC. The d-peptides contain amino acid residues with a stereoisomeric d-form of each
chiral carbon. The peptides were either resuspended in MilliQ H2O or in MilliQ H2O containing 50 mM NH4HCO3 and lyophilized repeatedly to remove leftover trifluoroacetic acid from the last
purification step by the manufacturer. Peptides were then either resuspended directly in the buffer used for experiments or in H2O without 50 mM NH4HCO3 to measure the concentration. If no
aromatic residue was present in the peptide sequence, the absorbance at 214 nm was used. The extinction coefficient was calculated using Bestsel51. EXPRESSION AND PURIFICATION OF PROTEINS
15N-labelled and unlabelled full-length ProTα was expressed and purified as described22. The double-cysteine variant of ProTα (E56C/D110C) used in smFRET experiments was expressed and
purified as described24, with some modifications. In brief, ProTα was dialysed against Tris buffer (50 mM Tris, 200 mM NaCl, 2 mM DTT, 1 mM EDTA; pH 8), during which the hexa-histidine tag
was cleaved using HRV 3 C protease. Cleaved ProTα was purified further using Ni Sepharose Excel resin (Cytiva, formerly GE Healthcare) and a HiPrep Q FF column (Cytiva) with a gradient from
200 mM to 1 M NaCl. Buffer was exchanged (HiTrap Desalting column (Cytiva)) to labelling buffer potassium phosphate (100 mM, pH 7). 15N-labelled and unlabelled GST–MCL1152–308 was expressed
in BL21(DE3)pLysS _Escherichia coli_ in the presence of ampicillin. Cells were grown at 37 °C in LB or M9 minimal medium (for 15N labelling) until OD600 reached 0.6, then induced with IPTG
(1 mM final concentration) and collected after 4 h. The cell pellet was resuspended in Tris buffer (20 mM Tris, 100 mM NaCl; pH 8), then lysed by sonication. After pelleting again, the
supernatant was applied to GST Sepharose beads (Cytiva), and GST–MCL1152-308 was eluted using Tris-GSH buffer (20 mM Tris, 100 mM NaCl, 10 mM GSH; pH 8). The GST tag was removed using TEV
protease (0.7 mg) overnight at room temperature. Final purity was reached using a Superdex 75 26/60 column (Cytiva), equilibrated with 50 mM phosphate buffer (pH 7). 13C,15N-labelled
MCL1152–308 was expressed as described52 and purified as above. The expression and purification of 15N-labelled and unlabelled RCD1-RST499–572 were carried out as previously described28 with
the lysis buffer changed to 20 mM Tris-HCl, pH 9.0, 20 mM NaCl. The buffer used in the last purification step by size exclusion chromatography on a Superdex 75 10/300 GL column (Cytiva) was
the buffer described for the individual methods. 13C,15N-labelled ANAC046319–338 or ANAC013254–274 were expressed with a His6-SUMO fusion tag in BL21(DE3) _E. coli_ in the presence of
kanamycin (50 μg ml−1). Cells were grown in LB at 37 °C until OD600 reached 0.6 and the medium was changed to M9 minimal medium, followed by induction with IPTG to 1 mM final concentration
and collected after incubation overnight at 16 °C. The cells were resuspended in lysate buffer (50 mM and 20 mM Tris-HCl for ANAC046319–338 and ANAC013254–274, respectively, pH 8.0, 300 mM
NaCl) and sonicated. After the centrifugation, the lysate was purified using TALON resin equilibrated in the buffers just described. The fusion peptides were eluted with an equivalent buffer
containing 250 mM imidazole. After a dialysis step into 20 mM Tris-HCl pH 8.0, 100 mM NaCl, the fusion tag was cleaved with ubiquitin-like-specific protease 1 (ULP1) (molar ratio between
peptide and protease were 1:320 and 1:500 for ANAC046319–338 and ANAC013254–274, respectively) overnight at 4 °C. A second purification step with TALON resin was performed resulting in the
peptides in the flowthrough. The purification of the peptides was finalized by size exclusion chromatography on a Superdex peptide 10/300 GL column (Cytiva) and freeze-dried to be
resuspended in the desired buffer. ALPHAFOLD STRUCTURE MODELLING Protein interaction models of RCD1-RST499–572 in complex with ANAC046319–338 or ANAC013254–274 were generated using
AlphaFold330 and analysed in PyMOL (The PyMOL Molecular Graphics System, version 3.0 Schrödinger, LLC.). The five generated models for each complex were assessed manually and compared with
the secondary chemical shifts of Cα of the l-ligand recorded using ZZ-exchange or CEST (see NMR spectroscopy method). The structures agreeing with the experimental data were visualized in
PyMOL or Chimera X53. FAR-UV CD SPECTROPOLARIMETRY Far-UV CD spectra of l- and d-peptides of H1155–175, PUMA130–156, ANAC013254–274, ANAC046319–338, and DREB2A255–272 were measured on a
Jasco 815 spectropolarimeter with a Jasco Peltier control in the range of 260–190 nm at 20 °C. Concentrations of peptides varied between 10–30 µM in either MilliQ H2O, pH 7.0 (PUMA130–156,
H1155–175) or 20 mM NaH2PO4/Na2HPO4, pH 7.0 (ANAC013254–274, ANAC046319–338, DREB2A255–272) with 1 mM TCEP in the samples containing ANAC046 peptides. A quartz cuvette with a 1 mm path
length was used and 10 scans were recorded and averaged with a scanning speed of 20 nm min−1 and response time of 2 s. A spectrum of the buffer using identical setting was recorded for each
protein and subtracted the sample spectrum. NMR SPECTROSCOPY All NMR spectra were recorded on Bruker Avance III 600 MHz, 750 MHz or an Avance NEO 800 MHz (for 1H) spectrometers equipped with
cryoprobes. Natural abundance 1H,15N and 1H,13C-HSQC spectra were recorded on all peptides at either 10 °C or 25 °C. Peptides (0.5 mM) in sample buffer containing 20 mM Na2HPO4/NaH2PO4 pH
7.0, 100 mM NaCl, 10 % (v/v) D2O, 0.02 % (w/v) NaN3 and 0.7 mM 4,4-dimethyl-4-silapentane-1-sulfonic acid (DSS) for ANAC046319–338, ANAC013254–274 and DREB2A255–272 with the addition of 1 mM
DTT in the samples containing ANAC046 peptides. 1H,15N-HSQC spectra were recorded on 50 µM ProTα, with or without 500 µM l- or d-H1155–175 in TBSK (ionic strength 165 mM; pH 7.4).
1H,15N-HSQC spectra were recorded on 50 µM MCL1, with or without 45 µM l- or 2.5 mM d-PUMA130–156, in Tris (50 mM; pH 7.0) to compare at 90% saturation, as calculated from _K_d values.
Assignments of 13C,15N-MCL1 in complex with l-PUMA130–156 were completed from a series of HNCACB and HNCOCACB 3D spectra as described54, and deposited to Biological Magnetic Resonance Data
Bank (BMRB) under accession 52264. 1H,15N-HSQC spectra were recorded on 15N-labelled 100 µM RCD1-RST499–572 in 20 mM Na2HPO4/NaH2PO4 pH 7.0, 100 mM NaCl, 10 % (v/v) D2O, 0.02 % (w/v) NaN3
and 0.7 mM DSS at 25 °C in the absence and presence of each stereoisomeric forms of 0−200 µM ANAC046319–338, ANAC013254–274 and DREB2A255–272 in the following ratios; 1:0, 1:0.2, 1:0.4,
1:0.6, 1:0.8, 1:1 and 1:2. Assignments of free ProTα and free RCD1-RST were taken from BMRB entries 27215 and 50545, respectively22,28. Amide CSPs were calculated from the 1H,15N-HSQCs in
the absence and presence of the highest concentration of peptide used for each interaction using equation (1): $${\Delta \delta }_{{\rm{NH}}}\,({\rm{ppm}})=\sqrt{{(\Delta {\delta
}^{1}{\rm{H}})}^{2}+{(0.154\times \Delta {\delta }^{15}{\rm{N}})}^{2}}$$ (1) The total protein CSP (CSPtotal_L) induced by the binding of the l-enantiomer peptide was quantified by recording
the CSPs of all visible 15N,1HN backbone resonances at >90% saturation (MCL1: 90%, RST (all cases): >99%, ProTα: >98%). The CSP for all visible residues were summed to obtain the
total CSP. To adjust for unassigned residues, which include prolines, residues that could not be assigned, or residues not visible in either the bound or unbound states, the total CSP was
divided by the fraction of residues for which CSPs were recorded. For instance, if CSPs were obtained for only half of the residues, the calculated total CSP was doubled to estimate the
perturbation as if all residues were visible. This adjustment ensured that the total CSP could be compared between interactions, accounting for the lack of data from unassigned or invisible
residues. The adjustment does not account for the fact that disappearing residues are likely involved in the interaction and thus also likely to experience larger than average CSPs. 2D NMR
LINESHAPE ANALYSIS 2D NMR lineshape analyses were performed for interactions of l-and d-peptides with RCD1-RST499–572. The recorded 1H,15N-HSQC spectra were processed using qMDD with
exponential weighting functions with 4 Hz and 8 Hz line broadening in the direct and indirect dimensions, respectively. The 2D lineshape analysis was performed using the tool TITAN31 in
Matlab (Mathworks) and was based on well-separated spin systems that were easily followed. If the trajectory of spin systems overlapped, the spin systems were grouped during fitting. All
titrations were fitted to a two-state binding model, and at least 12 spin systems were picked for each analysis. Due to initial poor fitting for the titrations of the interaction
15N-RCD1-RST499–572 and l- ANAC013254–274, the _K_d value was fixed using the values determined from ITC. Errors were determined by a bootstrap analysis using 100 replicas to determine the
standard error from the mean. From the lineshape analysis, the fitted _K_d and _k_off values were used to calculate the association rate constant (_k_on) based on equation (2):
$${K}_{{\rm{d}}}=\frac{{k}_{{\rm{off}}}}{{k}_{{\rm{on}}}}$$ (2) The differences in activation free energies for binding between d- and l-peptides were estimated from the ratios of the
association rate constants for both stereoisomers, \({k}_{{\rm{on}}}^{{\rm{D}}}\) and \({k}_{{\rm{on}}}^{{\rm{L}}}\), based on equation (3): $${\Delta \Delta G}_{{\rm{unbound}}-\ddagger
,{\rm{D}}-{\rm{L}}}=RT{\rm{ln}}\left(\frac{{k}_{{\rm{on}}}^{{\rm{L}}}}{{k}_{{\rm{on}}}^{{\rm{D}}}}\right),$$ (3) which was rewritten from Fersht (equation 18.22 in ref. 55). CEST NMR CEST
experiments were recorded for the l-peptide of ANAC046319–338 to determine the chemical shift of its bound state with RCD1-RST499–572. All experiments were recorded on a Bruker Avance Neo
800 spectrometer with a cryoprobe. A sample of 1 mM 13C,15N-labelled l-ANAC046319–338 was prepared with 5% molar ratio of RCD1-RST499–572 in 20 mM Na2HPO4/NaH2PO4 pH 6.5, 100 mM NaCl, 10 %
(v/v) D2O, 0.02 % (w/v) NaN3, 0.7 mM DSS and 5 mM DTT. 15N-CEST data was acquired using pulse sequences as previously described56 at 25 °C using three different B1 field strengths: 6.25,
12.5 and 25 Hz. 13C-CEST data were acquired using special pulse sequences57,58 (provided by L. Kay) as done in ref. 59 at 25 °C with a B1 field strength of 25 Hz. The free induction decays
were transformed using NMRPipe60 and peak intensities were extracted from each specific peak position. The intensities were analysed using ChemEx61 by fitting to a global two-state model
implemented in the program. The fits reported on the change in chemical shifts for peaks experiencing CEST-transfer which directly reflects the chemical shift of the bound state of the
peptide. The chemical shifts were extracted for the Cα and compared to a reference set62. ZZ-EXCHANGE For the complex between RST and 15N-ANAC013254–274, identification of residues and their
assignments were resolved by 3D heteronuclear NMR experiments with additional ZZ-exchange63 NMR spectra recorded on a 50% saturated sample of 100 µM 13C, 15N-ANAC013254–274 with 50 µM
RCD1-RST499–572 in20 mM Na2HPO4/NaH2PO4 pH 6.5, 200 mM NaCl, 10 % (v/v) D2O, 0.02 % (w/v) NaN3, and 0.7 mM DSS. The ZZ-exchange connections made it possible to manually track the assignment
from the 1H,15N-HSQC spectrum of the unbound 15N-ANAC013254–274 to the RST-bound 15N-ANAC013254–274. For the assignments of carbon resonances of ANAC013, two samples were prepared: 13C,
15N-ANAC013254–274 (650 µM) w/wo RCD1-RST499–572 (800 µM) in 20 mM Na2HPO4/NaH2PO4 pH 6.5, 200 mM NaCl, 10 % (v/v) D2O, 0.02 % (w/v) NaN3, and 0.7 mM DSS. Backbone resonances for the unbound
peptide were manually assigned from analysis of 15N-HSQC, HNCA, HNCO and HNCACB experiments. All NMR spectra were acquired at 25 °C on a Bruker Avance III 750 MHz, except for ZZ-exchange
which was on Bruker Avance III 600 MHz. All 3D experiments were recorded using non-uniform sampling. SECONDARY CHEMICAL SHIFTS SCSs were calculated using the POTENCI62 web tool. TRANSVERSE
RELAXATION To determine the dynamics of l-ANAC046319–338 and l-ANAC013254–274 w/wo RCD1-RST499–572, the sample from ANAC013254–274 assignment was reused whereas a new for ANAC046319–338 was
made: 75 µM 13C, 15N-ANAC046319–338 with 180 µM RCD1-RST499–572 in 20 mM Na2HPO4/NaH2PO4 pH 6.5, 100 mM NaCl, 10 % (v/v) D2O, 0.02 % (w/v) NaN3, 0.7 mM DSS and 5 mM DTT. The transverse
relaxation rates, _R_2 values, were acquired on a Bruker Avance Neo 800 spectrometer with the following relaxation delays: 33.8 ms, 67.6 ms, 101.4 ms, 169.0 ms, 236.6 ms, 270.4 ms, 338.0 ms
and 405.6 ms (all triplicates), and a recycle delay of 2 s. Data were fitted to a one phase decay function. ISOTHERMAL TITRATION CALORIMETRY Prior to ITC, all samples were spun down at
17,000_g_ for 10 min at the experimental temperature. ITC experiments involving ProTα and MCL1152–308 as interaction partners were recorded on MicroCal PEAQ-ITC microcalorimeter (Malvern
Panalytical). ProTα (7.1 µM) was placed in the cell and either l- or d-H1155–175 (99.1 µM) in the syringe, in TBSK (165 µM ionic strength) at 20 °C. Each injection was 2 µl, with a total of
19 injections at an interval of 150 s between each. Data were fit using a fixed number of binding sites (fixed to one) so that fits could be standardized. For the MCL1152-308 interactions,
MCL1152-308 (10 µM) was placed in the cell, with either l- or d-PUMA130–156 (100 µM) in the syringe, in Tris (50 mM; pH 7.0) at 25 °C. Each of the 35 injections was 1 µl, with an interval of
150 s between each. The experiment was repeated for MCL1:d-PUMA130–156, increasing the concentrations to 70 and 700 µM, respectively, while keeping the remaining experimental conditions
identical. ITC experiments involving RCD1-RST499–572 as interaction partner were recorded on a MicroCal ITC200 microcalorimeter (MicroCal Instruments) at 25 °C in 50 mM Na2HPO4/NaH2PO4 pH
7.0, 100 mM NaCl. TCEP (1 mM) was added the sample buffer for interactions involving ANAC046 peptides. Concentrations of RCD1-RST499–572 varied between 10–100 µM in the cell and 100-1000 µM
of the ANAC046, ANAC013 or DREB2A peptides in the syringe. The first injection was 0.5 µl followed by 18 repetitions of 2 µl injections separated by 180 seconds. These experiments were
processed using the Origin7 software package supplied by the manufacturer. The last 18 injections of each experiment were fitted to a one set of sites binding model. Triplicates were
recorded for each interaction. A salt titration was performed measuring the interaction between RCD1-RST499-572 and the l-peptides of ANAC046319–338 and ANAC013254–274 by ITC, varying the
NaCl concentration in the experimental buffer. Experiments were recorded on a MicroCal PEAQ-ITC microcalorimeter or a MicroCal ITC200 microcalorimeter at 25 °C. A 50 mM Na2HPO4/NaH2PO4 pH
7.0, 1 mM TCEP buffer was used with NaCl concentrations at 0, 50, 150 and 200 mM, with data at 100 mM NaCl recorded prior to and included in the analysis. Protein and peptide concentrations
varied from 10–30 µM in the cell (RCD1-RST) and 100–300 µM in the syringe (peptides). A replica of each experiment was produced, and the isotherm were fitted as described above. FLUOROPHORE
LABELLING FOR SMFRET ProTα was labelled by incubating it with Alexa Fluor 488 (0.7:1 dye to protein molar ratio) for 1 h at room temperature and sequentially with Alexa Fluor 594 (1.5:1 dye
to protein molar ratio) overnight at 4 °C. Labelled protein was purified using a HiTrap Desalting column and reversed-phase high-performance liquid chromatography (RP-HPLC) on a SunFire C18
column (Waters Corporation) with an elution gradient from 20% acetonitrile and 0.1% trifluoroacetic acid in aqueous solution to 37% acetonitrile. ProTα-containing fractions were lyophilized
and dissolved in buffer (10 mM Tris, 200 mM KCl, 1 mM EDTA; pH 7.4). SINGLE-MOLECULE FRET MEASUREMENTS AND ANALYSIS Single-molecule fluorescence experiments were conducted using either a
custom-built confocal microscope or a MicroTime 200 confocal microscope (PicoQuant) equipped with a 485-nm diode laser and an Olympus UplanApo 60×/1.20 W objective. Microscope and filter
setup were used as previously described24. The 485-nm diode laser was set to an average power of 100 μW (measured at the back aperture of the objective), either in continuous-wave or pulsed
mode with alternating excitation of the dyes, achieved using pulsed interleaved excitation (PIE)64. The wavelength range used for acceptor excitation in PIE mode was selected with a z582/15
band pass filter (Chroma) from the emission of a supercontinuum laser (EXW-12 SuperK Extreme, NKT Photonics) driven at 20 MHz, which triggers interleaved pulses from the 485-nm diode laser
used for donor excitation. In our experiments, photon bursts (at least 3000 bursts) were selected against the background mean fluorescence counts and, in case of PIE, by having a
stoichiometry ratio _S_ of \(0.2 < S < 0.75\), each originating from an individual molecule diffusing through the confocal volume. Transfer efficiencies were quantified according to
\(E={n}_{{\rm{A}}}/({n}_{{\rm{A}}}+{n}_{{\rm{D}}})\), where \({n}_{{\rm{D}}}\) and \({n}_{{\rm{A}}}\) are the numbers of donor and acceptor photons in each burst, respectively, corrected for
background, channel crosstalk, acceptor direct excitation, differences in quantum yields of the dyes, and detection efficiencies. All smFRET experiments were performed in µ-Slide sample
chambers (Ibidi) at 22 °C in TEK buffer with an ionic strength of 165 mM fixed with KCl; 140 mM 2-mercaptoethanol and 0.01% (v/v) Tween-20 were added for photoprotection and for minimizing
surface adhesion, respectively. Single-molecule data were analysed using the Mathematica (Wolfram Research) package Fretica (https://schuler.bioc.uzh.ch/programs). For quantifying binding
affinities, transfer efficiency histograms were constructed from single-molecule photon bursts identified as described above. Each histogram was normalized to an area of 1 and fit with a
Gaussian peak function to extract its mean transfer efficiency \(\langle E\rangle \). The mean transfer efficiency as a function of increasing concentration of d/l-H1155–175, \(\langle
E\rangle ({C}_{{\rm{D/L-H1}}})\), was fit with: $$\begin{array}{l}\langle E\rangle ({C}_{{\rm{D}}/{\rm{L}}-{\rm{H}}1}^{{\rm{t}}{\rm{o}}{\rm{t}}})\,=\Delta {\langle E\rangle
}^{{\rm{s}}{\rm{a}}{\rm{t}}}\\ \times \frac{{C}_{{\rm{D}}/{\rm{L}}-{\rm{H}}1}^{{\rm{t}}{\rm{o}}{\rm{t}}}+{K}_{{\rm{d}}}+{C}_{{\rm{P}}{\rm{r}}{\rm{o}}{\rm{T}}\alpha
}^{{\rm{t}}{\rm{o}}{\rm{t}}}-\sqrt{{({C}_{{\rm{D}}/{\rm{L}}-{\rm{H}}1}^{{\rm{t}}{\rm{o}}{\rm{t}}}+{K}_{{\rm{d}}}+{C}_{{\rm{P}}{\rm{r}}{\rm{o}}{\rm{T}}\alpha
}^{{\rm{t}}{\rm{o}}{\rm{t}}})}^{2}-4{C}_{{\rm{D}}/{\rm{L}}-{\rm{H}}1}^{{\rm{t}}{\rm{o}}{\rm{t}}}{C}_{{\rm{P}}{\rm{r}}{\rm{o}}{\rm{T}}\alpha
}^{{\rm{t}}{\rm{o}}{\rm{t}}}}}{2{C}_{{\rm{P}}{\rm{r}}{\rm{o}}{\rm{T}}\alpha }^{{\rm{t}}{\rm{o}}{\rm{t}}}}+{\langle E\rangle }_{0}\end{array}$$ (4) Here, \({C}_{{\rm{D/L-H1}}}^{{\rm{tot}}}\)
and \({C}_{{\rm{ProT\alpha }}}^{{\rm{tot}}}\) are the total concentration of d/l-H1155–175 and ProTα, respectively, \({\langle E\rangle }_{0}\) is the mean transfer efficiency of free ProTα,
and \({\Delta \langle E\rangle }^{{\rm{sat}}}\) is the increase in transfer efficiency from free ProTα to ProTα saturated with d/l-H1155–175, while \({K}_{{\rm{d}}}\) is the equilibrium
dissociation constant. REPORTING SUMMARY Further information on research design is available in the Nature Portfolio Reporting Summary linked to this article. DATA AVAILABILITY Chemical
shifts of MCL1 in the PUMA-bound state have been submitted to BMRB under the accession number 52264. Source data are provided with this paper. REFERENCES * Holehouse, A. S. & Kragelund,
B. B. The molecular basis for cellular function of intrinsically disordered protein regions. _Nat. Rev. Mol. Cell Biol._ 25, 187–211 (2024). Article CAS PubMed Google Scholar * Mason, S.
F. Origins of biomolecular handedness. _Nature_ 311, 19–23 (1984). Article ADS CAS PubMed Google Scholar * Silverman, M. P., Badoz, J. & Briat, B. Chiral reflection from a
naturally optically active medium. _Opt. Lett._ 17, 886 (1992). Article ADS CAS PubMed Google Scholar * Ikawa, M. & Snell, E. E. Cell wall composition of lactic acid bacteria. _J.
Biol. Chem._ 235, 1376–1382 (1960). Article CAS PubMed Google Scholar * Ikawa, M. & Snell, E. E. d-glutamic acid and amino sugars as cell wall constituents in lactic acid bacteria.
_Biochim. Biophys. Acta_ 19, 576–578 (1956). Article CAS PubMed Google Scholar * Zhao, J. et al. EphA4 regulates hippocampal neural precursor proliferation in the adult mouse brain by
d-serine modulation of _N_-methyl-d-aspartate receptor signaling. _Cereb. Cortex_ 29, 4381–4397 (2019). Article PubMed Google Scholar * Teramoto, T. et al. A novel peptide from funnel web
spider venom, ω-Aga-TK, selectively blocks, P-type calcium channels. _Biochem. Biophys. Res. Commun._ 196, 134–140 (1993). Article CAS PubMed Google Scholar * Mignogna, G., Simmaco, M.,
Kreil, G. & Barra, D. Antibacterial and haemolytic peptides containing d-alloisoleucine from the skin of _Bombina variegata_. _EMBO J._ 12, 4829–4832 (1993). Article CAS PubMed
PubMed Central Google Scholar * Martínez-Rodríguez, S., Martínez-Gómez, A. I., Rodríguez-Vico, F., Clemente-Jiménez, J. M. & Las Heras-Vázquez, F. J. Natural occurrence and industrial
applications of d-amino acids: an overview. _Chem. Biodivers._ 7, 1531–1548 (2010). Article PubMed Google Scholar * Tugyi, R. et al. Partial d-amino acid substitution: Improved enzymatic
stability and preserved Ab recognition of a MUC2 epitope peptide. _Proc. Natl Acad. Sci. USA_ 102, 413–418 (2005). Article ADS CAS PubMed PubMed Central Google Scholar * Schumacher, T.
N. et al. Identification of d-peptide ligands through mirror-image phage display. _Science_ 271, 1854–1857 (1996). Article ADS CAS PubMed Google Scholar * Sun, K. et al. Accurate de
novo design of heterochiral protein–protein interactions. _Cell Res._ https://doi.org/10.1038/s41422-024-01014-2 (2024). * Doti, N., Mardirossian, M., Sandomenico, A., Ruvo, M. &
Caporale, A. Recent applications of retro-inverso peptides. _Int. J. Mol. Sci._ 22, 8677 (2021). Article CAS PubMed PubMed Central Google Scholar * Lombardi, A. et al. Retro-inverso
d-peptides as a novel targeted immunotherapy for type 1 diabetes. _J. Autoimmun._ 115, 102543 (2020). Article CAS PubMed PubMed Central Google Scholar * Bonny, C., Oberson, A., Negri,
S., Sauser, C. & Schorderet, D. F. Cell-permeable peptide inhibitors of JNK: novel blockers of beta-cell death. _Diabetes_ 50, 77–82 (2001). Article CAS PubMed Google Scholar *
Shangary, S. & Wang, S. Targeting the MDM2–p53 interaction for cancer therapy. _Clin. Cancer Res._ 14, 5318 (2008). Article CAS PubMed PubMed Central Google Scholar * Beydoun, T. et
al. Subconjunctival injection of XG-102, a JNK inhibitor peptide, in patients with intraocular inflammation: a safety and tolerability study. _J. Ocul. Pharmacol. Ther._ 31, 93–99 (2015).
Article CAS PubMed Google Scholar * Mao, A. H., Crick, S. L., Vitalis, A., Chicoine, C. L. & Pappu, R. V. Net charge per residue modulates conformational ensembles of intrinsically
disordered proteins. _Proc. Natl Acad. Sci. USA_ 107, 8183–8188 (2010). Article ADS CAS PubMed PubMed Central Google Scholar * Wright, P. E. & Dyson, H. J. Intrinsically disordered
proteins in cellular signalling and regulation. _Nat. Rev. Mol. Cell Biol._ 16, 18–29 (2015). Article CAS PubMed PubMed Central Google Scholar * van der Lee, R. et al. Classification
of intrinsically disordered regions and proteins. _Chem. Rev._ 114, 6589–6631 (2014). Article PubMed PubMed Central Google Scholar * Tuttle, L. M. et al. Gcn4-mediator specificity is
mediated by a large and dynamic fuzzy protein–protein complex. _Cell Rep._ 22, 3251–3264 (2018). Article CAS PubMed PubMed Central Google Scholar * Borgia, A. et al. Extreme disorder in
an ultrahigh-affinity protein complex. _Nature_ 555, 61–66 (2018). Article ADS CAS PubMed PubMed Central Google Scholar * Turner, A. L. et al. Highly disordered histone H1–DNA model
complexes and their condensates. _Proc. Natl Acad. Sci. USA_ 115, 11964–11969 (2018). Article ADS CAS PubMed PubMed Central Google Scholar * Sottini, A. et al. Polyelectrolyte
interactions enable rapid association and dissociation in high-affinity disordered protein complexes. _Nat. Commun._ 11, 5736 (2020). Article ADS CAS PubMed PubMed Central Google
Scholar * Day, C. L. et al. Structure of the BH3 domains from the p53-inducible BH3-only proteins Noxa and Puma in complex with Mcl-1. _J. Mol. Biol._ 380, 958–971 (2008). Article CAS
PubMed Google Scholar * Rogers, J. M. et al. Interplay between partner and ligand facilitates the folding and binding of an intrinsically disordered protein. _Proc. Natl Acad. Sci. USA_
111, 15420–15425 (2014). Article ADS CAS PubMed PubMed Central Google Scholar * O’Shea, C. et al. Structures and short linear motif of disordered transcription factor regions provide
clues to the interactome of the cellular hub protein radical-induced cell death 1. _J. Biol. Chem._ 292, 512–527 (2017). Article PubMed Google Scholar * Bugge, K. et al. Structure of
radical-induced cell death1 hub domain reveals a common αα-scaffold for disorder in transcriptional networks. _Structure_ 26, 734–746.e7 (2018). Article CAS PubMed Google Scholar *
Mirdita, M. et al. ColabFold: making protein folding accessible to all. _Nat. Methods_ 19, 679–682 (2022). Article CAS PubMed PubMed Central Google Scholar * Abramson, J. et al.
Accurate structure prediction of biomolecular interactions with AlphaFold 3. _Nature_ 630, 493–500 (2024). Article ADS CAS PubMed PubMed Central Google Scholar * Waudby, C. A., Ramos,
A., Cabrita, L. D. & Christodoulou, J. Two-dimensional NMR lineshape analysis. _Sci. Rep._ 6, 24826 (2016). Article ADS CAS PubMed PubMed Central Google Scholar * Waudby, C. A.
& Christodoulou, J. NMR lineshape analysis of intrinsically disordered protein interactions. _Methods Mol. Biol._ 2141, 477–504 (2020). Article CAS PubMed PubMed Central Google
Scholar * Haq, S. R. et al. Side-chain interactions form late and cooperatively in the binding reaction between disordered peptides and PDZ domains. _J. Am. Chem. Soc._ 134, 599–605 (2012).
Article CAS PubMed Google Scholar * Gianni, S., Morrone, A., Giri, R. & Brunori, M. A folding-after-binding mechanism describes the recognition between the transactivation domain of
c-Myb and the KIX domain of the CREB-binding protein. _Biochem. Biophys. Res. Commun._ 428, 205–209 (2012). Article CAS PubMed Google Scholar * Dogan, J., Mu, X., Engström, Å. &
Jemth, P. The transition state structure for coupled binding and folding of disordered protein domains. _Sci. Rep._ 3, 2076 (2013). Article PubMed PubMed Central Google Scholar * Elkjær,
S. et al. Evolutionary fine-tuning of residual helix structure in disordered proteins manifests in complex structure and lifetime. _Commun. Biol._ 6, 63 (2023). Article PubMed PubMed
Central Google Scholar * Teilum, K., Olsen, J. G. & Kragelund, B. B. Globular and disordered-the non-identical twins in protein–protein interactions. _Front. Mol. Biosci._ 2, 40
(2015). Article PubMed PubMed Central Google Scholar * Skriver, K., Theisen, F. F. & Kragelund, B. B. Conformational entropy in molecular recognition of intrinsically disordered
proteins. _Curr. Opin. Struct. Biol._ 83, 102697 (2023). Article CAS PubMed Google Scholar * Chu, W. T., Clarke, J., Shammas, S. L. & Wang, J. Role of non-native electrostatic
interactions in the coupled folding and binding of PUMA with Mcl-1. _PLoS Comput. Biol._ 13, e1005468 (2017). Article PubMed PubMed Central Google Scholar * Theisen, F. F. et al.
Quantification of conformational entropy unravels effect of disordered flanking region in coupled folding and binding. _J. Am. Chem. Soc._ 143, 14540–14550 (2021). Article CAS PubMed
Google Scholar * Bugge, K. et al. Interactions by disorder—a matter of context. _Front. Mol. Biosci._ 7, 110 (2020). Article ADS CAS PubMed PubMed Central Google Scholar * Wiggers, F.
et al. Diffusion of a disordered protein on its folded ligand. _Proc. Natl Acad. Sci. USA_ 118, e2106690118 (2021). Article CAS PubMed PubMed Central Google Scholar * Weinstock, M. T.,
Jacobsen, M. T. & Kay, M. S. Synthesis and folding of a mirror-image enzyme reveals ambidextrous chaperone activity. _Proc. Natl Acad. Sci. USA_ 111, 11679–11684 (2014). Article ADS
CAS PubMed PubMed Central Google Scholar * Nyanguile, O., Uesugi, M., Austin, D. J. & Verdine, G. L. A nonnatural transcriptional coactivator. _Proc. Natl Acad. Sci. USA_ 94,
13402–13406 (1997). Article ADS CAS PubMed PubMed Central Google Scholar * Heller, G. T. et al. Small-molecule sequestration of amyloid-β as a drug discovery strategy for Alzheimer’s
disease. _Sci. Adv._ 6, eabb5924 (2020). Article ADS CAS PubMed PubMed Central Google Scholar * Iconaru, L. I. et al. Small molecule sequestration of the intrinsically disordered
protein, p27Kip1, within soluble oligomers. _J. Mol. Biol._ 433, 167120 (2021). Article CAS PubMed PubMed Central Google Scholar * Sallembien, Q., Bouteiller, L., Crassous, J. &
Raynal, M. Possible chemical and physical scenarios towards biological homochirality. _Chem. Soc. Rev._ 51, 351–368 (2022). Article Google Scholar * James, E. J. & Russell, M. J.
Predicting the conformations of peptides and proteins in early evolution. _Biol. Direct_ 3, 3 (2008). Article Google Scholar * Milner-White, E. J. & Russell, M. J. Functional
capabilities of the earliest peptides and the emergence of life. _Genes_ 2, 671–688 (2011). Article CAS PubMed PubMed Central Google Scholar * Staby, L. et al. Flanking disorder of the
folded αα-hub domain from radical induced cell death1 affects transcription factor binding by ensemble redistribution. _J. Mol. Biol._ 433, 167320 (2021). Article CAS PubMed Google
Scholar * Kuipers, B. J. H. & Gruppen, H. Prediction of molar extinction coefficients of proteins and peptides using UV absorption of the constituent amino acids at 214 nm to enable
quantitative reverse phase high-performance liquid chromatography-mass spectrometry analysis. _J. Agric. Food Chem._ 55, 5445–5451 (2007). Article CAS PubMed Google Scholar * Newcombe,
E. A. et al. Insight into calcium-binding motifs of intrinsically disordered proteins. _Biomolecules_ 11, 1173 (2021). Article CAS PubMed PubMed Central Google Scholar * Meng, E. C. et
al. UCSF ChimeraX: tools for structure building and analysis. _Protein Sci._ 32, e4792 (2023). Article CAS PubMed PubMed Central Google Scholar * Schenstrøm, S. M. et al. Expanded
interactome of the intrinsically disordered protein Dss1. _Cell Rep._ 25, 862–870 (2018). Article PubMed PubMed Central Google Scholar * Fersht, A. _Structure and Mechanism in Protein
Science: A Guide to Enzyme Catalysis and Protein Folding_, 3rd edn (W. H. Freeman, 1998). * Vallurupalli, P., Bouvignies, G. & Kay, L. E. Studying ‘invisible’ excited protein states in
slow exchange with a major state conformation. _J. Am. Chem. Soc._ 134, 8148–8161 (2012). Article CAS PubMed Google Scholar * Long, D., Sekhar, A. & Kay, L. E. Triple resonance-based
13Cα and 13Cβ CEST experiments for studies of ms timescale dynamics in proteins. _J. Biomol. NMR_ 60, 203–208 (2014). Article CAS PubMed Google Scholar * Vallurupalli, P. & Kay, L.
E. Probing slow chemical exchange at carbonyl sites in proteins by chemical exchange saturation transfer NMR spectroscopy. _Angew. Chem. Int. Ed. Engl._ 52, 4156–4159 (2013). Article CAS
PubMed Google Scholar * Theisen, F. F. et al. Molecular switching in transcription through splicing and proline-isomerization regulates stress responses in plants. _Nat. Commun._ 15, 592
(2024). Article ADS CAS PubMed PubMed Central Google Scholar * Delaglio, F. et al. NMRPipe: a multidimensional spectral processing system based on UNIX pipes. _J. Biomol. NMR_ 6,
277–293 (1995). Article CAS PubMed Google Scholar * Bouvignies, G. NMR chemical exchange analysis tool. _Github_ https://www.github.com/gbouvignies/ChemEx (2022). * Nielsen, J. T. &
Mulder, F. A. A. POTENCI: prediction of temperature, neighbor and pH-corrected chemical shifts for intrinsically disordered proteins. _J. Biomol. NMR_ 70, 141–165 (2018). Article CAS
PubMed Google Scholar * Palmer, A. G., Kroenke, C. D. & Loria, J. P. Nuclear magnetic resonance methods for quantifying microsecond-to-millisecond motions in biological macromolecules.
_Methods Enzymol._ 339, 204–238 (2001). Article CAS PubMed Google Scholar * Müller, B. K., Zaychikov, E., Bräuchle, C. & Lamb, D. C. Pulsed interleaved excitation. _Biophys. J._ 89,
3508–3522 (2005). Article PubMed PubMed Central Google Scholar * Holehouse, A. S., Das, R. K., Ahad, J. N., Richardson, M. O. G. & Pappu, R. V. CIDER: resources to analyze
sequence–ensemble relationships of intrinsically disordered proteins. _Biophys. J._ 112, 16–21 (2017). Article ADS CAS PubMed PubMed Central Google Scholar Download references
ACKNOWLEDGEMENTS The authors thank K. Strømgaard for valuable discussions on d-peptide synthesis; C. B. Parsbæk for initial discussions on the MCL1–PUMA complex; A. Prestel for expert NMR
assistance; S. S. Sjørup and C. O’Shea for technical support and protein purification; A. S. Hebbelstrup, C. B. Parsbæk and K. Teilum for the MCL1 construct; J. D. Calvete for graphical
support; A. Chowdhury for comments on the manuscript and D. Nettels for providing data analysis tools. This work was supported by the Novo Nordisk Foundation challenge grant REPIN,
rethinking protein interactions (NNF18OC0033926 to K.S., B.S. and B.B.K.), by the Danish Research Councils (9040-00164B to B.B.K.), and by the Swiss National Science Foundation
(310030_197776 to B.S.). Further support was given by the European Union’s Horizon 2020 research and innovation programme under the Marie Sklodowska-Curie grant agreement 101023654 (awarded
to E.A.N.). NMR spectra were recorded at cOpenNMR, an infrastructure facility funded by the Novo Nordisk Foundation (NNF18OC0032996). AUTHOR INFORMATION Author notes * These authors
contributed equally: Estella A. Newcombe, Amanda D. Due AUTHORS AND AFFILIATIONS * REPIN, Department of Biology, University of Copenhagen, Copenhagen N, Denmark Estella A. Newcombe, Amanda
D. Due, Steffie Elkjær, Frederik Friis Theisen, Catarina B. Fernandes, Lasse Staby, Elise Delaforge, Inna Brakti, Katrine Bugge, Karen Skriver, Johan G. Olsen & Birthe B. Kragelund *
Structural Biology and NMR Laboratory, Department of Biology, University of Copenhagen, Copenhagen N, Denmark Estella A. Newcombe, Amanda D. Due, Frederik Friis Theisen, Catarina B.
Fernandes, Lasse Staby, Elise Delaforge, Inna Brakti, Katrine Bugge, Johan G. Olsen & Birthe B. Kragelund * Linderstrøm Lang Centre for Protein Science, Department of Biology, University
of Copenhagen, Copenhagen N, Denmark Estella A. Newcombe, Amanda D. Due, Steffie Elkjær, Frederik Friis Theisen, Catarina B. Fernandes, Lasse Staby, Elise Delaforge, Inna Brakti, Katrine
Bugge, Karen Skriver, Johan G. Olsen & Birthe B. Kragelund * Department of Biochemistry and Department of Physics, University of Zurich, Zurich, Switzerland Andrea Sottini & Benjamin
Schuler * Department of Drug Design and Pharmacology, Center for Biopharmaceuticals, University of Copenhagen, Copenhagen, Denmark Christian R. O. Bartling Authors * Estella A. Newcombe
View author publications You can also search for this author inPubMed Google Scholar * Amanda D. Due View author publications You can also search for this author inPubMed Google Scholar *
Andrea Sottini View author publications You can also search for this author inPubMed Google Scholar * Steffie Elkjær View author publications You can also search for this author inPubMed
Google Scholar * Frederik Friis Theisen View author publications You can also search for this author inPubMed Google Scholar * Catarina B. Fernandes View author publications You can also
search for this author inPubMed Google Scholar * Lasse Staby View author publications You can also search for this author inPubMed Google Scholar * Elise Delaforge View author publications
You can also search for this author inPubMed Google Scholar * Christian R. O. Bartling View author publications You can also search for this author inPubMed Google Scholar * Inna Brakti View
author publications You can also search for this author inPubMed Google Scholar * Katrine Bugge View author publications You can also search for this author inPubMed Google Scholar *
Benjamin Schuler View author publications You can also search for this author inPubMed Google Scholar * Karen Skriver View author publications You can also search for this author inPubMed
Google Scholar * Johan G. Olsen View author publications You can also search for this author inPubMed Google Scholar * Birthe B. Kragelund View author publications You can also search for
this author inPubMed Google Scholar CONTRIBUTIONS This study was conceptualized by J.G.O., E.A.N., A.D.D., L.S., K.B., K.S. and B.B.K. J.G.O., L.S., K.B. and C.R.O.B. designed the
d-peptides. E.A.N. carried out experiments on ProTα and MCL1 presented in this manuscript, with initial experiments on ProTα conducted by C.B.F. and K.B. smFRET was performed by A.S. in
collaboration with B.S. A.D.D. carried out the experiments with RST presented in the manuscript, except for the ZZ-exchange and _R_2 measurements on ANAC013, which were done by S.E., and the
ionic strength dependence of _K_d values, which was done by A.D.D. and F.F.T. F.F.T. extracted the correlation in Fig. 4g. Initial experiments were conducted by E.D., I.B. and L.S. E.A.N.,
A.D.D., K.S., J.G.O. and B.B.K. wrote the manuscript with contributions from all authors. All authors have read and agreed to the submitted and published version of the manuscript.
CORRESPONDING AUTHORS Correspondence to Johan G. Olsen or Birthe B. Kragelund. ETHICS DECLARATIONS COMPETING INTERESTS The authors declare no competing interests. PEER REVIEW PEER REVIEW
INFORMATION _Nature_ thanks the anonymous reviewer(s) for their contribution to the peer review of this work. Peer review reports are available. ADDITIONAL INFORMATION PUBLISHER’S NOTE
Springer Nature remains neutral with regard to jurisdictional claims in published maps and institutional affiliations. EXTENDED DATA FIGURES AND TABLES EXTENDED DATA FIG. 1 13C-HSQC NMR
SPECTRA SHOWING CΑ AND CΒ CHEMICAL SHIFTS OF L- AND D-PEPTIDES. A L-H1155-175 and D-H1155-175; B L-ANAC046 and D-ANAC046; C L-DREB2A and D-DREB2A; D L-ANAC013 and D-ANAC013; E L-PUMA and
D-PUMA. All L-peptides displayed in grey and D-peptides in orange. For A and E, a line at 35 ppm in the 13C-dimension originates from the presence of Tris in the buffer. EXTENDED DATA FIG. 2
ALPHAFOLD3 MODELS OF ANAC046 AND ANAC013 PEPTIDES IN COMPLEX WITH RST. Peptide models agreeing with experimental data colored according to the pLDDT of ANAC046 (A) and ANAC013 (B). RST is
shown in grey in a representative conformation to ease the comparison of the peptide models. The color scheme is shown at the top and matches the scale used by Alphafold3. PyMol version
2.6.0a0 was used to visualise the structures. EXTENDED DATA FIG. 3 COMPARISON OF NMR PEAK INTENSITIES FROM BINDING L- AND D-ENANTIOMERS TO RST. Intensity ratios reported for the interactions
of RST with D- (orange) and L-version (grey) of ANAC046319-338 (top), DREB2A255-272 (middle), and ANAC013254-274 (bottom). The saturation was in all cases 99% or above. EXTENDED DATA FIG. 4
NMR LINESHAPE ANALYSIS OF TITRATION OF RST WITH RST-INTERACTING PEPTIDES USING TITAN31. A L-ANAC046; B D-ANAC046; C L-DREB2A; D D-DREB2A; E L-ANAC013; F D-ANAC013. A concentration range of
0, 20, 40, 60, 80, 100, and 200 µM peptide (final concentration in sample) was titrated into 15N-RST with a concentration of 100 µM. EXTENDED DATA FIG. 5 FREE ENERGY DIAGRAMS OF
TRANSCRIPTION FACTOR-PEPTIDE INTERACTIONS WITH RST. Differences in binding free energies, ΔΔ_G_ from ITC and differences in activation free energies between D- and L-peptides,
ΔΔ_G_unbound-ǂ,D-L, from NMR lineshape analysis (Extended Data Fig. 4, Extended Data Table 3). (orange: D; gray: L). EXTENDED DATA FIG. 6 CΑ-CEST PROFILES OF 13C,15N-LABELED L-ANAC046319-338
PEPTIDE WITH 5% RST. A concentration of 1 mM13C,15N-L-ANAC046319-338 with 50 µM RST was used in the CEST experiment to ensure 5% saturation based on the Kd from ITC. The used pulse
sequences modulate HSQCs as a function of i−1 carbon saturation. Hence the HSQC peak of residue e.g. S321 is modulated as a function of K320 carbon saturation. The profiles shown correspond
to the Cα of the residue given at each plot. The pulse sequence used cannot probe the Cα of G325 in the peptide. The dots show the experimental data while the line shows the fit. The
vertical grey dotted, and solid lines correspond to the chemical shift given from the fit of the peptide’s unbound and bound states, respectively. Residuals are shown above each plot. The
additional smaller dips in the CEST profile of D328 could not be recaptured in the 15N-CEST or 13C’-CEST profiles, suggesting they originate form noise. EXTENDED DATA FIG. 7 ZZ-EXCHANGE NMR
SPECTROSCOPY OF L-ANAC013 IN COMPLEX WITH RCD1-RST AT 25 °C. The ZZ-exchange spectrum of L-ANAC013 (100 µM L-ANAC013 + 50 µM RST, grey) is overlayed with L-ANAC013 in its free (650 µM
L-ANAC013, yellow) and bound form (650 µM L-ANAC013 + 800 µM RST, orange). The dashed lines connect the peaks from the free state to those of the bound state via ZZ-exchange cross-peaks.
Example highlighted for Glu262. SUPPLEMENTARY INFORMATION REPORTING SUMMARY PEER REVIEW FILE SOURCE DATA SOURCE DATA FIG. 2 SOURCE DATA FIG. 3 SOURCE DATA FIG. 4 RIGHTS AND PERMISSIONS OPEN
ACCESS This article is licensed under a Creative Commons Attribution-NonCommercial-NoDerivatives 4.0 International License, which permits any non-commercial use, sharing, distribution and
reproduction in any medium or format, as long as you give appropriate credit to the original author(s) and the source, provide a link to the Creative Commons licence, and indicate if you
modified the licensed material. You do not have permission under this licence to share adapted material derived from this article or parts of it. The images or other third party material in
this article are included in the article’s Creative Commons licence, unless indicated otherwise in a credit line to the material. If material is not included in the article’s Creative
Commons licence and your intended use is not permitted by statutory regulation or exceeds the permitted use, you will need to obtain permission directly from the copyright holder. To view a
copy of this licence, visit http://creativecommons.org/licenses/by-nc-nd/4.0/. Reprints and permissions ABOUT THIS ARTICLE CITE THIS ARTICLE Newcombe, E.A., Due, A.D., Sottini, A. _et al._
Stereochemistry in the disorder–order continuum of protein interactions. _Nature_ 636, 762–768 (2024). https://doi.org/10.1038/s41586-024-08271-6 Download citation * Received: 25 January
2024 * Accepted: 22 October 2024 * Published: 27 November 2024 * Issue Date: 19 December 2024 * DOI: https://doi.org/10.1038/s41586-024-08271-6 SHARE THIS ARTICLE Anyone you share the
following link with will be able to read this content: Get shareable link Sorry, a shareable link is not currently available for this article. Copy to clipboard Provided by the Springer
Nature SharedIt content-sharing initiative