- Select a language for the TTS:
- UK English Female
- UK English Male
- US English Female
- US English Male
- Australian Female
- Australian Male
- Language selected: (auto detect) - EN
Play all audios:
ABSTRACT The bone marrow microenvironment is a critical regulator of haematopoietic stem cell self-renewal and fate1. Although it is appreciated that ageing, chronic inflammation and other
insults compromise bone marrow function and thereby negatively affect haematopoiesis2, it is not known whether different bone compartments exhibit distinct microenvironmental properties and
functional resilience. Here we use imaging, pharmacological approaches and mouse genetics to uncover specialized properties of bone marrow in adult and ageing skull. Specifically, we show
that the skull bone marrow undergoes lifelong expansion involving vascular growth, which results in an increasing contribution to total haematopoietic output. Furthermore, skull is largely
protected against major hallmarks of ageing, including upregulation of pro-inflammatory cytokines, adipogenesis and loss of vascular integrity. Conspicuous rapid and dynamic changes to the
skull vasculature and bone marrow are induced by physiological alterations, namely pregnancy, but also pathological challenges, such as stroke and experimental chronic myeloid leukaemia.
These responses are highly distinct from femur, the most extensively studied bone marrow compartment. We propose that skull harbours a protected and dynamically expanding bone marrow
microenvironment, which is relevant for experimental studies and, potentially, for clinical treatments in humans. SIMILAR CONTENT BEING VIEWED BY OTHERS RESILIENT ANATOMY AND LOCAL
PLASTICITY OF NAIVE AND STRESS HAEMATOPOIESIS Article Open access 20 March 2024 SKULL BONE MARROW CHANNELS AS IMMUNE GATEWAYS TO THE CENTRAL NERVOUS SYSTEM Article 23 November 2023 SKULL
BONE MARROW AND SKULL MENINGES CHANNELS: REDEFINING THE LANDSCAPE OF CENTRAL NERVOUS SYSTEM IMMUNE SURVEILLANCE Article Open access 29 January 2025 MAIN Niche microenvironments composed of
multiple cell types and molecular signals regulate the self-renewal and the ultimate fate of haematopoietic stem cells (HSCs) in bone marrow1,3 (BM). The skull, a flat bone encasing the
brain, develops via intramembranous ossification and fundamentally differs in both composition and remodelling from long bones, which undergo endochondral ossification during development and
sustain load-bearing mechanical stress4,5,6. The thin and flat mouse calvarium, the main component of the skull roof, has been successfully used as a platform for the imaging of HSC
dynamics7,8. Potential functional differences between BM compartments, such as those in long and flat bone, however, remain little understood. It has been shown that HSCs are homogenously
distributed throughout calvarium and long bone (namely diaphysis and epiphysis) under homeostatic conditions, whereas chimerism in mice transplanted with congenic haematopoietic stem and
progenitor cells (HSPCs) is initially higher in calvarium and epiphysis relative to diaphysis9. The discovery of designated channels between the calvarial BM and the dura mater of the
meninges indicates that skull BM acts as a haematopoietic reservoir for meningeal and central nervous system immunity10,11. Ageing causes an overall decline in haematopoietic function, with
compromised lymphopoiesis and a bias toward dysfunctional myelopoiesis2,12. Again, it remains unknown whether all BM compartments are equally affected by ageing processes and therefore
collectively contribute to haematopoietic decline. Here we show that calvarial BM is fundamentally different to the BM in long bone. Calvarial BM continuously expands during adulthood, is
resistant to most major hallmarks of BM niche ageing, and gradually increases its systemic haematopoietic contribution throughout adult life and ageing. Our work also establishes that BM
compartments exhibit unexpected functional differences, with implications for a range of physiological conditions such as pregnancy and ageing, as well as pharmacological treatments and
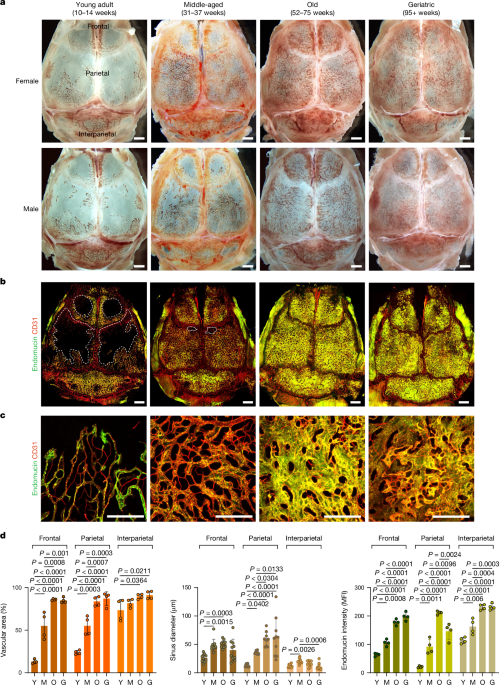
disease settings. SKULL BM EXPANDS DURING ADULT LIFE To characterize changes in calvarial BM throughout adult life, we collected skulls from young adult (10–14 weeks; hereafter referred to
as ‘young’), middle-aged (31–37 weeks), old (52–75 weeks) and geriatric (95+ weeks) mice. Initial stereoscopic observation showed that blood-filled structures, representing blood vessels and
surrounding BM, occupy only limited areas of the frontal and parietal bone in young adults, whereas interparietal bone is mostly filled by blood cells (Fig. 1a). Although angiogenic growth
of blood vessels is normally confined to development, regeneration or certain pathological conditions13,14, substantial expansion of the vasculature can be seen in calvaria from middle-aged
mice (Fig. 1a–d). Further increases in vascular area and vessel diameter can be observed in old and geriatric skulls (Fig. 1a–d). Flow cytometric analyses show that the expansion of
calvarial vasculature is accompanied by a profound increase in total haematopoietic cells, HSCs, HSPCs, committed haematopoietic progenitors and stromal cells (Supplementary Data 1; gating
strategies shown in Supplementary Data 2). Skull cross-sections from young and geriatric mice show that the enlargement of calvarial BM occurs more rapidly in female mice than in males (Fig.
1a and Extended Data Fig. 1a,b). Expansion of calvarial BM results in an increase in total skull thickness (of approximately 70% between young and geriatric mice of both sexes) without
decreasing the thickness of the cortical bone tables (Extended Data Fig. 1a,b). Immunofluorescence analysis of skull sections shows a profound increase in V-type proton ATPase-positive
activated osteoclasts lining the surface of the inner and outer cortical bone tables in skulls from old relative to young mice (Extended Data Fig. 1c,d), indicating that bone resorption by
osteoclasts contributes to BM expansion. To address whether skull BM expansion also occurs in ageing humans, we analysed computed tomography (CT) head scan images obtained from 36 human
patients evaluated for small cerebral aneurysms. This revealed significantly increased area enclosed by the inner and outer cortical bone tables in older (61–69 years of age) compared with
younger (21–40 years of age) individuals (Extended Data Fig. 2a–c). A larger difference was seen in female skulls (83.2% increase versus 24.6% in males), showing that this sexual dichotomy
occurs in both mice and humans. These results demonstrate a substantial expansion of the BM volume in both mouse and human skull during adulthood and ageing. VESSEL GROWTH DURING SKULL BM
EXPANSION Previous studies have shown that arterial and sinusoidal endothelial cells are important components of the HSC microenvironment15,16. To gain more insight into the organization of
the calvarial vasculature, we first utilized an in vivo immunofluorescence staining method with CD31 antibody in _Flk1_-GFP knock-in mice17 (_Flk1_ is also known as _Kdr_). This approach
revealed profound differences in vascular architecture in young adult frontal, parietal and interparietal skull bones (Extended Data Fig. 3a,c). Specifically, larger FLK1+CD31+ sinusoidal
vessels with distal sprouts dominate in frontal bone, thinner FLK1+CD31+ sinusoidal vessel loops connect to FLK1low/−CD31+ arterioles in parietal bone, and interparietal bone is completely
filled by a dense network of sinusoidal vessels and arterioles (Extended Data Fig. 3a,c). Vascular leakage assays with Evans Blue corroborated local differences in vascular properties in
different skull parts and revealed significantly higher leakage in frontal bone compared with the other two skull bones (Extended Data Fig. 3b,d). To gain more insight into the organization
of the calvarial vasculature and the changes during adulthood and ageing, we performed in vivo labelling with fluorescent CD31 and endomucin antibodies. In young adult mice, only
interparietal bone was largely filled by a dense vascular network, whereas substantial and sustained vascular expansion was observed in frontal and parietal bones of middle-aged and old mice
(Fig. 1b–d). Vascular area increased by 6.4- and 3.6-fold in frontal and parietal bones, respectively, between young and geriatric mice. Endomucin, which decorates calvarial sinusoidal
vessels but not arteries and smaller arterioles, has been implicated in bone maintenance and HSC function18,19. Vascular endomucin expression significantly increased until the geriatric
stages (3.1-fold increase in frontal bone and 7.0-fold increase in parietal bone). We next focused on parietal bone, which showed the largest BM expansion and a transition from thin looping
sinusoidal vessels in young adult mice to a dense network at later stages (Fig. 1b,c). Sinus diameter increased 4.8-fold and dorsal–ventral vertical extension of the vascular network can be
observed at the old stage (Fig. 1c,d and Extended Data Fig. 3e). Immunofluorescence staining of caveolin-119,20 showed a 2.0-fold increase of interconnecting arterioles during ageing
(Extended Data Fig. 3f,g). In vivo immunofluorescence staining of haematopoietic cells using fluorescent CD45 antibody and flow cytometric analyses show that vascular growth is associated
with a substantial increase in haematopoietic cells (13.1-fold increase between young and geriatric mice) within the expanding BM (Extended Data Fig. 4a,b and Supplementary Data 1). CD45+
cells were predominantly associated with large-calibre sinusoidal vessels, which were highly abundant in old and geriatric skull (Extended Data Fig. 4a). The link between vessel calibre and
BM was further confirmed by a genetic approach; labelling of haematopoietic cells in the _Vav-cre;Rosa26-mTmG_ background21,22 shows that haematopoietic cells expressing GFP surround
large-calibre sinusoidal vessels (Extended Data Fig. 4c). Similarly, CD3e+ T lymphocytes, B220+ B lymphocytes and CD11b+ cells (including monocytes/macrophages, granulocytes and natural
killer cells) are associated with large-calibre sinusoids in skull BM (Extended Data Fig. 4d). With the exception of interparietal bone, BM-associated sinusoidal vessels with strong
endomucin immunostaining are comparably sparse in young adult mice and increase substantially throughout adult life and ageing (Fig. 1b–d). Interparietal bone, which is largely filled by
vessels and BM at the young adult stage, shows minimal age-related changes in vascular area (24.3% increase between young and geriatric samples) and sinus diameter (9.3% decrease between
young and geriatric samples) but a significant increase in endomucin expression (2.0-fold increase between young and geriatric samples) (Fig. 1b,d). By contrast, vascular density in the
metaphyseal region of the femoral BM decreased by 45.2% between the middle-aged and old stages, but rebounded at geriatric stages with the emergence of very thin vessels displaying high
endomucin expression (Extended Data Fig. 5a,b), which have been recently characterized as dysfunctional sinusoidal vessels23. Electron micrographs of the luminal surface of endothelial cells
in young and old skull BM show comparable patterns of endothelial fenestrations, which are a hallmark of vessels in primary lymphoid organs including BM. By contrast, endothelial cells in
old femur BM show a highly irregular pattern of fenestrae and the emergence of larger pores in the endothelial surface (Extended Data Fig. 5c). In contrast to the increasing vasculature of
skull marrow, vessel density in the dura mater, which is adjacent to the skull and connected directly to the skull BM via specialized channels10, decreases significantly during ageing
(Extended Data Fig. 5d,e). Collectively, these results show continuous expansion of the BM and vasculature in the adult and ageing calvarium but not in the adjacent dura mater. Moreover,
ageing femoral BM displays features of compromised vascular integrity, which are not seen in ageing skull BM. SKULL BM RESPONSES IN PATHOPHYSIOLOGY High demand for certain blood cells leads
to strongly increased haematopoiesis in a range of physiological but also pathological conditions1,24. Pregnancy, for example, induces extramedullary haematopoiesis and the rapid expansion
of maternal blood volume and red blood cells25,26. Skull BM and associated vasculature increased substantially during pregnancy, namely 1.8-fold at 17 days postcoitum (dpc) and 2.3-fold at 2
days postpartum (dpp), which involves substantial vessel enlargement in frontal and parietal bone together with a strong increase in total haematopoietic cells, HSCs and HSPCs, committed
haematopoietic progenitors and stromal cells (Fig. 2a,b and Supplementary Data 1). As reported previously27, CD31hiendomucinhi type H vessels in femur increased strongly at late-stage
pregnancy and decreased postpartum, but overall vascular density in the metaphyseal region showed more limited changes (26.2% increase at 17 dpc and 8.5% decrease at 2 dpp) relative to skull
(Extended Data Fig. 6a,b). Although the total number of haematopoietic cells in femur was not significantly changed by pregnancy, flow cytometry showed increases in HSCs, HSPCs, certain
committed haematopoietic progenitors and stromal cells (Supplementary Data 1), consistent with enhanced blood cell production. Ischaemic stroke in a transient mid-cerebral artery occlusion
model (tMCAO) was shown to activate BM haematopoietic stem cells28. Consistent with this finding, tMCAO induced a striking expansion of skull BM and associated vasculature (2.1-fold
increase), filling a substantial portion of parietal bone within 7 days (Fig. 2c,d). These changes are accompanied by strong increases in calvarial total haematopoietic cells, HSCs, HSPCs,
committed haematopoietic progenitors and stromal cells (Supplementary Data 1). By contrast, vascular density in femoral BM decreased by 26.0% and haematopoietic cells and subpopulations were
either unchanged or reduced in the stroke condition (Extended Data Fig. 6c,d and Supplementary Data 1). Haematological malignancies are known to lead to BM alterations, which, in turn,
facilitate disease progression29. A chronic myeloid leukaemia (CML) model showed a modest but significant expansion of the skull BM and associated blood vessels (39.1% increase), which
involved an increase in haematopoietic and stromal cells (Fig. 2e,f and Supplementary Data 1). By contrast, substantial loss of vascularity (50.4% decrease), severe vascular rarefaction and
limited changes in total haematopoietic cell number were observed in CML femoral BM (Extended Data Fig. 6e,f and Supplementary Data 1). Biologically active fragments of parathyroid hormone
(PTH) are used to treat osteoporosis30, and also lead to HSPC expansion31. We found that 4 weeks of daily PTH treatment resulted in substantial skull BM expansion (4.6-fold increase),
increased large-calibre vessels and expansion of vessel-associated BM area (Fig. 2g,h). Flow cytometry confirmed the increase in total haematopoietic cell number, HSCs, HSPCs and certain
committed progenitors, as well as in endothelial and stromal cells (Supplementary Data 1). By contrast, only very limited changes were observed in femoral BM immunostaining and flow
cytometry (Extended Data Fig. 6g,h and Supplementary Data 1). These results demonstrate an unexpected dynamic plasticity of skull BM in a range of pathophysiological contexts and uncover
differences between calvarial and femoral BM. SKULL HSPCS DRIVE BM GROWTH DURING AGEING HSPCs residing in BM change drastically during ageing, both in quantity and differentiation
potential32. To address whether such cells might promote skull BM expansion, we isolated lineage-negative (Lin−) cells from young or old skull and femur and transplanted them into lethally
irradiated young recipients (Fig. 3a). In vivo immunofluorescence staining showed substantial expansion (2.2-fold) of skull BM vessels in recipient mice that received cells from old donor
skull BM compared with those that received cells from young donors (Fig. 3b,c). Transplantation of old donor femur BM also resulted in the expansion of skull BM vessels in recipient mice but
to a lesser degree than old donor skull BM. Notably, vascular density in femur was not significantly different between recipients of transplants from young and old donors (Extended Data
Fig. 7a,b), further suggesting divergent responsiveness of different BM compartments. Flow cytometric analyses of HSPCs showed that both long-term HSCs (LT-HSCs) and Lin−Sca1+KIT+ (LSK)
HSPCs increase in number in the ageing skull BM (Fig. 3d,e), similar to reports for ageing long bone33,34. To further test whether HSPCs contribute to BM expansion and vascular growth in
skull, we treated mice with prostaglandin E235,36 (PGE2) or AMD3100 (ref. 37) to modulate HSPC number. PGE2 treatment increased the number of HSPCs in the skull BM by 92.3% (Extended Data
Fig. 7c,d), resulting in significant expansion of calvarial vasculature and vessel-associated BM relative to control mice (Fig. 3f,g and Supplementary Data 1). AMD3100 treatment mobilized
HSPCs into the peripheral blood by 11.2-fold (Extended Data Fig. 7e,f) and induced a 60.0% reduction of skull BM and vasculature relative to control mice (Fig. 3h,i). Although both PGE2 and
AMD3100 treatments led to changes in vascular density in femoral BM, these alterations were confined to existing marrow without changing the BM area (Extended Data Fig. 7g–j). These results
indicate that treatments acting on HSPCs can dynamically modulate the skull BM and its vasculature. VEGFA DRIVES SKULL BM AND VESSEL GROWTH VEGFA is a master regulator of vascular
growth38,39, and enzyme-linked immunosorbent assays (ELISAs) showed that levels of the growth factor were significantly increased in the skull BM in response to pregnancy, stroke and PTH
treatment, whereas no changes could be detected in the femoral BM under the same conditions (Extended Data Fig. 8a). VEGFA was significantly reduced in the femoral BM of mice with CML but
was increased in the skulls of the same mice (Extended Data Fig. 8a). Previous studies showed that HSPCs isolated from long bone express high levels of _Vegfa_ transcripts compared with
other BM cell types40. We performed quantitative PCR with reverse transcription (RT–qPCR) analyses of various haematopoietic and stromal cell populations after fluorescence-activated cell
sorting (FACS) from enzymatically digested BM. Lin−Sca1+KIT+ HSPCs from skull indeed showed higher _Vegfa_ expression compared with Lin−Sca1−KIT+ cells (4.72-fold), Lin−Sca1−KIT− stromal
cells (5.97-fold) or Lin+ mature haematopoietic cells (5.92-fold) in young mice (Fig. 4a). HSPCs isolated from aged skull show higher _Vegfa_ expression compared with Lin−Sca1−KIT+ cells
(8.39-fold), Lin−Sca1−KIT− stromal cells (10.59-fold) and Lin+ mature haematopoietic cells (9.86-fold) (Fig. 4a). By contrast, HSPCs isolated from aged femur show significantly lower _Vegfa_
expression (5.5-fold) compared with the same population from young mice (Extended Data Fig. 9a). These results are mirrored by the expression of transcripts encoding VEGFA120 and VEGFA164
isoforms, which are highest in HSPCs from old skull, but also substantially higher in HSPCs from young mice compared with other cell populations (Extended Data Fig. 9b). At the protein
level, ELISA of whole-BM lysates shows that VEGFA levels are initially highest in young femur, probably reflecting expression by non-haematopoietic sources such as chondrocytes, and decrease
by 40.2% during ageing (Fig. 4b). By contrast, the amount of VEGFA in calvarial BM increases 2.2-fold from young to geriatric stages (Fig. 4b). Immunofluorescence of skull sections confirms
high expression of VEGFA by resident KIT+ HSPCs (Fig. 4c). As hypoxia is a critical regulator of VEGFA expression in angiogenesis41,42, we administered Hypoxyprobe (pimonidazole
hydrochloride) to analyse age-related changes in the oxygenation of skull and femur (Extended Data Fig. 9c,d). The Hypoxyprobe signal was significantly higher in skull BM relative to femoral
BM at old (3.3-fold) and geriatric stages (4.8-fold) (Fig. 4d,e and Extended Data Fig. 9c,d), consistent with the observed increase of VEGFA in ageing skull. Next, we manipulated
VEGFA-dependent VEGFR2 signalling in vivo to directly address the role of this pathway in the expansion of skull vasculature and BM. For gain-of-function experiments, a cDNA encoding a
bone-homing version of VEGFA (Methods) was cloned into the vector pLIVE, which enables constitutive protein expression in liver after hydrodynamic tail vein injection43. _Vegfa_
overexpression induced a 2.5-fold increase of skull BM, including HSCs and other haematopoietic and stromal cells, and associated vasculature (Fig. 4f,g and Supplementary Data 1).
Conversely, inhibition of VEGFR2 signalling with the blocking antibody DC101 inhibited BM expansion and vascular growth during ageing, as shown by immunostaining and flow cytometry (Fig.
4h,i and Supplementary Data 1). By contrast, although we observed vascular density changes within the confines of the femoral BM, these alterations did not involve any substantial volumetric
changes of the BM as in the skull (Extended Data Fig. 9e–j). These results demonstrate that VEGFA–VEGFR2 signalling regulates skull BM expansion during ageing and that the increase of HSPCs
in ageing skull is likely to be a relevant source of VEGFA. RESILIENCE OF AGEING SKULL BM The ageing BM microenvironment disrupts normal self-renewal and other essential functions of
HSCs44. To assess whether hallmarks of ageing affect calvarial and femoral BM equally, we characterized adipogenesis and inflammation in both compartments in young and geriatric mice.
Adipocytes have previously been reported to accumulate in the ageing BM and negatively regulate HSC function45. Whole-mount or cross-sectional staining of skull or femur, respectively, with
BODIPY shows minimal changes in the number of lipid-filled mature adipocytes in the skull, whereas a substantial 5.9-fold increase in adipocytes can be observed in the metaphyseal region of
the ageing femoral BM (Fig. 5a,b). Next, we used a bead-based multiplex array to quantify 12 pro-inflammatory cytokines in lysates from skull and femoral BM isolated from young and old mice.
Of note, only IFNγ was significantly upregulated in old skull, whereas 7 out of 12 cytokines, including TNF and IL-6, showed increased expression in old femur relative to young femur (Fig.
5c). It should also be noted that the expression of most pro-inflammatory cytokines in old femur was substantially higher than in skull, further supporting the notion that detrimental
processes associated with ageing are more prominent in femur. Ageing HSCs exhibit a myeloid bias at the expense of lymphopoiesis46. To assess whether such myeloid bias occurs and determine
which stages of the myeloid differentiation cascade are affected in the ageing skull, we analysed myeloid-committed progenitors and mature myeloid cells in the geriatric skull or femoral BM
using flow cytometry. We detected significant proportional increases of Lin−Sca1−KIT+ multipotent, common myeloid and granulocyte-monocyte progenitors, but not megakaryocyte-erythroid
progenitors, in the femur compared with the skull (Fig. 5d). Furthermore, RT–qPCR analyses of the key myeloid determination factors _Cebpa_ and _Spi1_ (which encodes the transcription factor
PU.1) show substantial upregulation in the geriatric femur BM versus skull BM (Fig. 5e). Finally, to compare the myeloid output from skull versus hindlimb BM into peripheral blood, we
selectively shielded these areas during lethal irradiation of young and old mice (Fig. 5f). Whereas there was no difference in myelopoiesis between head or leg shielding in young mice,
peripheral blood output from hindlimbs of old mice showed a strong myeloid bias compared with skull (Fig. 5f,g). Together, these results show that calvarial BM is remarkably resilient
against key features of ageing and thereby maintains a healthy microenvironment for haematopoiesis even in old mice. OLD SKULL PRESERVES FUNCTIONAL BM NICHES It has been established that
skull BM contains functional HSCs that can fully reconstitute the entire haematopoietic system in a transplantation setting9 and is the source of meningeal immune cells11,47. The effect of
ageing on haematopoietic output by different BM compartments, however, remains unknown. Following lethal irradiation in a non-transplantation setting, all mice with whole-body exposure died
within 12 days of BM failure (Fig. 5h). However, all young adult mice that were protected by shielding of the head or hindlimbs survived past 16 weeks without transplantation of exogenous
BM, demonstrating that both bone compartments contain sufficient HSCs for survival (Fig. 5h). Secondary haematopoietic reconstitution following an additional round of lethal irradiation with
head or hindlimb shielding also demonstrated the long-term reconstitution potential of HSCs derived from both BM compartments (Extended Data Fig. 10a,b). Whereas shielding of the head of
old mice was also fully compatible with long-term survival after irradiation, the same was not the case for hindlimb shielding, and none of the mice in this group survived beyond 200 days
(Fig. 5h). The calvarial vasculature is also highly resilient against irradiation-induced changes. Consistent with our previous findings40, vascular density (10.2-fold) and diameter
(3.3-fold) were substantially increased in femoral BM at 7 days after irradiation. By contrast, vessels in skull showed minimal changes both with and without BM transplantation (Extended
Data Fig. 10c–e). To explore the potential mechanisms that contribute to BM heterogeneity in ageing skull and femur, we performed single-cell RNA sequencing (scRNA-seq) of KIT+ HSPCs, and
stromal and endothelial cells isolated from either BM compartment in young or geriatric mice (Extended Data Fig. 11a–d). We found significantly higher expression of factors associated with
stress and inflammation such as _Jund_, _Fosb_ and _Dusp1_, as well as myeloid differentiation factors such as _Ngp_, _Ltf_ and _S100a8_, in geriatric femur HSCs compared with skull HSCs
(Extended Data Fig. 12a–f). These differentially expressed genes correlate strongly with gene expression changes reported for IL-1β-treated HSCs or the _Tet2-_knockout model of clonal
haematopoiesis23,48. To further determine whether the observed differences in BM function between ageing skull and femur are owing to HSC- or HSPC-intrinsic or extrinsic, microenvironmental
factors, we performed colony-forming unit (CFU) assays of HSPCs isolated from skull or femur of young or geriatric mice (Extended Data Fig. 13a,b). Although HSPCs derived from both geriatric
skull and femur initially showed higher colony-forming potential than their younger counterparts in primary CFU plating, there were no significant differences in secondary plating or in
HSPC self-renewal or myeloid differentiation potential in both rounds of plating, indicating a role for niche-derived factors. scRNA-seq analysis of endothelial cells from geriatric BM
revealed differences in the expression of inflammatory and myeloid differentiation factors such as _Hotairm1_, _Lgals3_, _Il6_ and _S100a6_, which were significantly upregulated in geriatric
femur compared with skull (Extended Data Fig. 14a–g). Conversely, endothelial cells from skull exhibited higher expression of HSC maintenance factors such as _Ptn_, _Gpr182_ and _Spp1_
(Extended Data Fig. 14h). Finally, to assess the haematopoietic function of skull BM in a physiological context devoid of irradiation injury, we expressed the green-to-red photoconvertible
fluorescent protein, Kikume green–red49 (KikGR) in haematopoietic cells under control of _Vav_-_cre_21 (Fig. 5i). Following in vivo photoconversion of haematopoietic cells in calvarial BM,
flow cytometric analysis of peripheral blood revealed a marked age-dependent increase in systemic haematopoietic contribution from photoconverted skull BM (Fig. 5j). These results show that
systemic haematopoietic output from skull increases relative to other BM compartments during ageing. In summary, our findings reveal an unexpected level of heterogeneity between two major BM
compartments that are well-established model systems in experimental studies. In contrast to nearly all other organ systems and long bone, which become fully vascularized during embryonic
and postnatal development50, blood vessel growth in skull persists throughout adult life. Lifelong angiogenesis in skull involves the continued formation of large-calibre sinusoidal vessels,
which are strongly associated with a range of haematopoietic cell populations and thus represent a central landmark in the skull BM environment. Vascular growth and BM expansion in skull
rely on VEGFA and its receptor VEGFR2, which are key regulators of developmental and regenerative angiogenesis in many organs39,51,52. Consistent with previous studies40, skull BM-resident
HSPCs express more VEGFA than Lin+ differentiated haematopoietic cells, but other relevant sources of VEGFA might exist, as has been shown for chondrocytes and osteoprogenitors in long
bone53. Our experiments also establish that circulation-derived VEGFA can promote calvarial vessel growth and BM expansion, which is consistent with the finding that systemic VEGF can
increase lifespan and delay ageing processes in mice54. Conversely, HSPC behaviour is controlled by the BM endothelium and associated reticular cells, which provide critical niche signals,
such as stem cell factor55 (also known as SCF or KIT ligand) or CXCL1256 (also known as SDF-1). Several studies have shown that haematopoietic cell production is enhanced in response to
various physiological and pathological stimuli, such as pregnancy and ischaemic stroke57. Our present findings indicate that these conditions lead to the expansion of calvarial BM but induce
only limited alterations in load-bearing long bone, where BM growth may not be compatible with mechanical loading and structural integrity. Furthermore, our results establish that calvarial
BM is more resistant to ageing-related degenerative processes, namely adipogenesis, the upregulation of inflammatory cytokines and compromised vascular integrity. This might, in part,
reflect that calvarial BM is biologically ‘younger’ owing to its formation during adult life. Alternatively, unknown cellular or molecular features might differentially influence
haematopoiesis in different BM compartments. Consistent with the latter, recent work has shown that skull BM has a distinct molecular profile in health and neurological disorders58. Notably,
our findings also suggest that BM expansion occurs in human skull, which is consistent with previous observations59,60. Thus, our findings regarding the plasticity and resilience of the BM
in skull may have wider relevance for ageing and disease processes in humans as well as pharmacological treatments that target angiogenic signalling pathways. METHODS ANIMAL MODELS C57BL/6J
mice were used for all experiments involving wild-type mice and pharmacological treatments. Mice at the age of 10–14 weeks, 31–37 weeks, 52–75 weeks and >95 weeks were chosen for young
adult, middle-aged, old and geriatric groups, respectively. Both female and male mice of all age groups were used for initial BM expansion analyses, while only female mice were used for
remaining experiments. _Flk1-_GFP reporter mice17 were used for initial blood vessel characterization. For genetic labelling of haematopoietic cells, _Vav1-cre_ mice21 were interbred with
_ROSA26-mTmG_ reporter mice22 to generate _Vav-mTmG_ mice. For photoconversion of haematopoietic cells, _Vav1-cre_ mice were interbred with _ROSA26_-CAG-_loxP_-stop-_loxP_-KikGR knock-in
mice49 to generate _Vav-KikGR_ mice. For pregnancy experiments, 10-week-old C57BL/6J female mice were paired with 10- to 12-week-old C57BL/6J male mice and the onset of pregnancy was
determined by the presence of a vaginal plug in the morning. Ten-week-old mice received daily intraperitoneal injections of PTH (1–34) (Bachem, 0.1 mg kg−1 for 28 days), PGE2 (Cayman
Chemical, 2 mg kg−1 for 7 days), AMD3100 (Abcam, 5 mg kg−1 for 14 days) before they were euthanized. For DC101 treatment, 10-week-old mice received intraperitoneal injections of DC101
(BioXCell, 40 mg kg−1) every 2 days for 12 weeks. Mice were kept in individually ventilated cages, with constant access to food and water under a 12 h light and 12 h dark cycle regime. Air
flow, temperature (21–22 °C) and humidity (55–60%) were controlled by an air management system. Mice were checked daily and maintained in specific pathogen-free conditions. Sufficient
nesting material and environmental enrichment was provided. All animal experiments were performed according to the institutional guidelines and laws, approved by local animal ethical
committee and were conducted at the Max Planck Institute for Molecular Biomedicine (84-02.04.2016.A160, 81-02.04.2018.A171, 81-02.04.2020.A212, 81-02.04.2020.A416 and 81-02.04.2022.A198),
Universitätsmedizin Berlin (G0220/17), Georg-Speyer-Haus (F123/2017) and the University Medical Center Mainz Institute of Transfusion Medicine (G23-1-067 A1TE) under the indicated
permissions granted by the Landesamt für Natur, Umwelt und Verbraucherschutz (LANUV) of North Rhine-Westphalia, the State Office for Health and Social Affairs Berlin, Regierungspräsidium
Darmstadt and the Landesuntersuchungsamt Rheinland-Pfalz, Germany. HUMAN SUBJECTS, CT ACQUISITION AND DATA ANALYSIS The study was approved by the local ethics committee and the institutional
review board (IRB) of Asan Medical Center, and the requirement for informed consent was waived due to the retrospective nature of the study (IRB number: 2023-0658). The study population
consisted of 36 patients, divided into 4 groups according to age (between 20 and 40 years, over 60 years) and sex (male, female), with 9 individuals in each group. Patients who underwent CT
for evaluation of small cerebral aneurysm from April to May 2023 were eligible. Participants were excluded if they had a previous history of surgery or radiation therapy to the head and
neck, vascular or bone-related medical implants, or a suspicious disease other than small cerebral aneurysm. All human patients underwent CT examinations on the same 128-channel
multidetector CT system (Somatom Definition Edge; Siemens). Imaging variables were as follows: 100 kV; 100 effective mAs; axial scan mode; section thickness, 0.5 mm; display FOV, 20.5 cm;
pitch, 1; gantry rotation time, 0.5 s; pixel matrix, 512 × 512. Images were obtained from the vertex to first cervical spine, without an intravenous injection of contrast media. The CT data
were digitally transferred to a personal computer and processed with ImageJ software (http://rsb.info.nih.gov/ij/). A representative image was selected on a coronal CT image perpendicular to
the outermost convex area on an axial CT image. After whole-bone segmentation of the parietal bone, cortical bone and BM were defined by attenuation densities on CT scan: cortical bone as
over 850 Hounsfield units and BM as less than 850 Hounsfield units and their areas were calculated. SAMPLE PROCESSING AND IMMUNOSTAINING Mice were euthanized by transcardial perfusion of PBS
and 4% paraformaldehyde (PFA), skulls and femur were collected and fixed immediately in ice-cold 4% PFA for 6–8 h under gentle agitation. Bones were decalcified in 0.5 M EDTA for 3 days
(for skulls) or 7 days (for femurs) at 4 °C under gentle shaking agitation, washed 5 times in PBS in 5 min intervals, followed by overnight incubation in cryoprotectant solution (20%
sucrose, 2% polyvinylpyrrolidone) and embedding in bone embedding medium (8% gelatin, 20% sucrose, 2% polyvinylpyrrolidone). Samples were stored overnight at −80 °C. 80-μm-thick cryosections
were prepared for immunofluorescence staining. Bone sections were washed in PBS and permeabilized with 0.3% Triton X-100 in PBS for 10 min at room temperature. Samples were incubated in
blocking solution (5% heat-inactivated donkey serum in 0.3% Triton X-100) for 1 h at room temperature. Primary antibodies (rat monoclonal anti-endomucin (V.7C7) (Santa Cruz, sc-65495, 1:200
dilution), rabbit monoclonal anti-vATPaseB1/B2 (Abcam, 200839, 1:200 dilution), goat polyclonal anti-osteopontin (R&D Systems, AF808, 1:200 dilution), goat polyclonal anti-CD31 (R&D,
AF3628, 1:200 dilution), rabbit polyclonal anti-caveolin-1 (Cell Signaling, 3238, 1:100), goat polyclonal anti-VEGF164 (R&D Systems, AF-493-NA, 1:200 dilution), and rat monoclonal
APC-conjugated anti-CD117 (KIT) (BD Biosciences, 553356, 1:100 dilution) were diluted in PBS with 5% donkey serum and incubated overnight at 4 °C. Next, slides were washed 3–5 times in PBS
in 5 min intervals. Species-specific Alexa Fluor-conjugated secondary antibodies Alexa Fluor 488 (Thermo Fisher Scientific, A21208), Alexa Fluor 594 (Thermo Fisher Scientific, A21209), Alexa
Fluor 647 (Thermo Fisher Scientific, A31573 or A21447) diluted 1:500 in PBS with 5% donkey serum were added and incubated overnight at 4 °C. Slides were washed 3–5 times in PBS in 5 min
intervals. Nuclei were counterstained with DAPI (Sigma-Aldrich, D9542, 1:1,000 dilution). Coverslips were mounted with FluoroMount-G (Southern Biotech, 0100-01). IN VIVO IMMUNOSTAINING AND
EVANS BLUE LEAKAGE ASSAY Rat monoclonal anti-CD31 (BD Biosciences, 553708) was conjugated to Alexa Fluor 647 using the Alexa Fluor 647 Antibody Labeling Kit (Thermo Fisher Scientific,
A20186) according to the manufacturer’s instructions. For blood vessel immunostaining, the conjugated anti-CD31 antibody and rat monoclonal PE-conjugated anti-endomucin (V.7C7) (Santa Cruz,
65495 PE) were diluted 1:10 in 200 μl PBS and injected intravenously into the tail vein. For haematopoietic cell immunostaining, rat monoclonal FITC-conjugated anti-CD45 (eBioscience,
11-0451-82), hamster monoclonal FITC-conjugated anti-CD3e (eBioscience, 16-0031-82), rat monoclonal PE-conjugated anti-CD45R/B220 (BD Biosciences, 553090), rat monoclonal FITC-conjugated
anti-CD11b (BD Biosciences, 553310) were diluted 1:10 in PBS and injected intravenously into the tail vein. Mice were euthanized 1 h after injection with transcardial perfusion with PBS and
4% PFA and bones were collected and fixed immediately in ice-cold 4% PFA for 6–8 h under gentle agitation. The dura mater was carefully removed from the skull with forceps. Bones were
decalcified in 0.5 M EDTA for 1 day (for skulls) or 7 days (for femurs) at 4 °C under gentle shaking agitation, and washed 5 times in PBS in 5 min intervals. Skulls were counterstained with
DAPI (1:500 dilution) for 1 h and trimmed down to the calvarium before mounting with iSpacers (Sunjin Lab, IS011) in PBS. Femurs were cryosectioned, counterstained and mounted as described
above. For the Evans Blue leakage assay, mice were anaesthetized immediately prior to tail vein injection of 200 μl Evans Blue solution (Sigma-Aldrich, E2129, 1% v/w). Mice were euthanized
via transcardial perfusion 5 min after injection as described above. In order to distinguish vascular leakage in the dura mater from the calvarial BM, dura mater tissues were separated from
the calvarial bone before overnight decalcification. Immunostained samples were imaged with a Zeiss LSM980 (Carl Zeiss). Images were analysed, quantified and processed using ZEN Black (Carl
Zeiss, v2.3), ImageJ (NIH, v2.0.0) and IMARIS (Bitplane, v10.0.1). Tilescan overview images of skull BM were superimposed on top of a black background, filling empty corners without image
data. Vessel diameter was measured by selecting the _z_-plane image with the widest vessel diameter from the _z_-stack of the individual vessel. SCANNING ELECTRON MICROSCOPY Skull and femur
from 12-week-old and 73-week-old mice were isolated and submerged in 4% PFA, 0.5% glutaraldehyde, 2 mM MgCl2, 2 mM CaCl2 in 0.1 M cacodylate buffer, pH 7.4, under agitation for 2 h at room
temperature. Samples were fixed further overnight in 2% glutaraldehyde, 2 mM MgCl2, 2 mM CaCl2 in 0.1 M cacodylate buffer, pH 7.4 at 4 °C. Bones were then decalcified over 12 days, changing
solution every other day in 5% EDTA in 0.1 M cacodylate buffer, pH 7.4 under rotation at 4 °C. Subsequently, 150 μm sections were generated with a vibratome (VT 1200, Leica). Sections were
post-fixed in 1% OsmO4, containing 2.5% PFA–glutaraldehyde mixture buffered with 0.1 M phosphate (pH 7.2) for 5 h and then were placed in graded ethanol for critical-point drying using E3000
(Polaron) critical-point dryer. Critical-point-dried bones were placed on a piece of carbon tape and sputter coated with gold in a SC502 Sputter Coater (Polaron). Specimens were imaged on a
Quanta 250 Field Emission Scanning Electron microscope (FEI Quanta 250 FEG, FEI, Hillsboro, OR) installed at the Korea Research Institute of Bioscience and Biotechnology. DURA MATER
WHOLE-MOUNT IMMUNOSTAINING Mice were euthanized by transcardial perfusion of PBS and 4% PFA, skulls were collected and fixed immediately in ice-cold 4% PFA for 6–8 h under gentle agitation.
Skulls were decalcified in 0.5 M EDTA for 24 h at 4 °C under gentle shaking agitation, washed 5 times in PBS in 5 min intervals, trimmed down to the calvarium, and incubated in blocking
solution (5% heat-inactivated donkey serum in 0.3% Triton X-100) for 1 h at room temperature. Goat polyclonal anti-CD31 (R&D, AF3628, 1:100 dilution) was diluted in PBS with 5% donkey
serum and incubated overnight at 4 °C with gentle agitation. Samples were washed 3–5 times in PBS in 10 min intervals. Alexa Fluor 647 (Thermo Fisher Scientific, A21447) diluted 1:500 in PBS
with 5% donkey serum was added and incubated overnight at 4 °C with gentle agitation. Samples were washed 3–5 times in PBS in 10 min intervals and mounted with iSpacers (Sunjin Lab, IS011)
in PBS. TMCAO Sixteen-week-old female C57BL6/J mice were used throughout the experiments. Mice were anaesthetized by intraperitoneal injection of a mixture of 10 mg kg−1 xylazine (cp-pharma)
and 90 mg kg−1 ketamine hydrochloride (cp-pharma). Throughout the whole procedure and during recovery, body temperature was maintained at 37 °C via a heating pad. After ligation of the left
proximal common carotid artery and external carotid artery, a 7.0-nylon monofilament (Doccol) with a 0.23-mm coated tip was introduced into the distal internal carotid artery via an
incision in the ligated common carotid artery. The monofilament was advanced distal to the carotid bifurcation to occlude the middle cerebral artery. Arter topical application of the local
anaesthetic lidocaine hydrochloride (Xylocain Spray 2%, Aspen) the neck wound was closed temporarily for a 45 min ischaemic period. At reperfusion, the monofilament was withdrawn from the
carotid artery and the wound was stitched with 4-0 non-resorbable sutures (Ethibond Excel, Ethicon) and the single s.c. injection of Penicillin G 20 000 U (Benzylpenicillin-Natrium,
InfectoPharm) was given. The mouse was returned to its cage to recover under observation. CHRONIC MYELOID LEUKAEMIA Six-week-old female C57BL/6 mice were purchased from Charles River
Laboratories and were used as donors and recipients in all transplants. The transplantation experiments were performed as previously described61. In brief, to induce CML-like
myeloproliferative neoplasia, donor BM cells from donor mice pre-treated with 5-fluorouracil (200 mg kg−1 intravenously; 4 days prior to collection) were pre-stimulated overnight in medium
containing SCF (50 ng ml−1), IL-6 (10 ng ml−1) and IL-3 (6 ng ml−1) and transduced on two consecutive days with murine stem cell virus (MSCV)-IRES-GFP-BCR-ABL1 to induce CML or MSCV-IRES-GFP
control virus. Subsequently, transduced cells were intravenously transplanted (2.5 × 10⁵ cells per mouse) into sublethally irradiated (900 cGy) recipient mice. Mice were euthanized 14 days
after transplantation. LINEAGE DEPLETION AND TRANSPLANTATION In order to transplant lineage-negative BM cells, young (10- to 14-week-old) or old (52- to 75-week-old) donor mice were
euthanized and skulls were collected. The calvarium was first chopped with scissors in FACS buffer (PBS with 2% fetal calf serum), then crushed with a mortar and pestle. Cell suspension was
filtered through a 40-μm mesh filter (Falcon, 352340), resuspended in RBC lysing buffer (Sigma-Aldrich, R7757) for red blood cell lysis and washed with FACS buffer. Cells were resuspended in
FACS buffer and incubated with a biotinylated anti-haematopoietic lineage antibody cocktail (Miltenyi-Biotec, 130-092-613, 1:10 dilution), followed by washing with FACS buffer and
incubation with R-PE-conjugated streptavidin secondary antibody (Invitrogen, S866, 1:50 dilution). DAPI (1:1,000 dilution) was added to resuspended cells to distinguish live and dead cells
and were FACS-sorted for live lineage-negative cells on a FACSAria Fusion (BD Biosciences). Sorted cells were intravenously transplanted (5×10⁵ cells/mouse) into lethally irradiated (12 Gy,
Best Theratronics, Gammacell 40 Exactor) recipient mice (12-week-old). Mice were euthanized 14 days after transplantation. FACS ANALYSIS OF BM AND PERIPHERAL BLOOD Mice from each age group
were euthanized and skull and femur were collected. Skulls were chopped with scissors in FACS buffer before crushed with mortar and pestle; femurs were crushed without chopping. BM stromal
samples were dissociated with Collagenase I (Gibco, 17100-017, 2 mg ml−1) and Collagenase IV (Gibco, 17104-019, 2 mg ml−1) in PBS for 20 min at 37 °C with intermittent shaking. Cell
suspensions were strained through a 40-μm mesh filter, resuspended in RBC lysing buffer (when applicable) and washed with FACS buffer. Cells were resuspended and incubated with the following
primary antibodies in FACS buffer: biotinylated rat monoclonal anti-haematopoietic lineage antibody cocktail (Miltenyi-Biotec, 130-092-613, 1:50 dilution), APC-conjugated rat monoclonal
anti-CD117 (BD Biosciences, 553356, 1:100 dilution), FITC-conjugated rat monoclonal anti-CD117 (Biolegend, 105806, 1:100 dilution), FITC-conjugated rat monoclonal anti-Ly6A/E (Sca1)
(eBioscience, 11-5981-85, 1:100 dilution), PerCP-Cy5.5-conjugated rat monoclonal anti-Ly-6A/E (Invitrogen, 45-5981, 1:100), APC-Cy7-conjugated hamster monoclonal anti-CD48 (BD Biosciences,
561242, 1:100 dilution), PE-conjugated rat monoclonal anti-CD150 (SLAM) (Biolegend, 115904, 1:100 dilution), Alexa Fluor 647-conjugated rat monoclonal anti-CD150 (Biolegend, 115918, 1:100
dilution), PE-Cy7-conjugated rat monoclonal anti-CD45 (eBioscience, 25-0451-82, 1:100 dilution), BV421-conjugated rat monoclonal anti-TER-119 (Biolegend, 116234, 1:100 dilution),
FITC-conjugated rat monoclonal anti-CD71 (Biolegend, 113806, 1:100 dilution), Alexa Fluor 647-conjugated rat monoclonal anti-CD31 (BD Biosciences, 553708, conjugation described above, 1:200
dilution), PE-conjugated rat monoclonal anti-endomucin (Santa Cruz, 65495 PE, 1:100 dilution), PE-Cy7-conjugated rat monoclonal anti-CD16/32 (eBioscience, 25-0161, 1:100 dilution), eFluor
450-conjugated rat monoclonal anti-CD34 (eBioscience, 48-0341, 1:100 dilution), PE-conjugated rat monoclonal anti-CD127 (eBioscience, 12-1271, 1:100 dilution), BV711-conjugated rat
monoclonal anti-CD41 (BD Biosciences, 740712, 1:100 dilution), PE-conjugated rat monoclonal anti-CD105 (eBioscience, 12-1051-82, 1:100 dilution), APC-conjugated hamster monoclonal anti-CD3e
(eBioscience, 17-0031, 1:100 dilution), PE-conjugated rat monoclonal anti-CD45R/B220 (BD Biosciences, 553090, 1:100 dilution), FITC-conjugated rat monoclonal anti-CD11b (BD Biosciences,
553310, 1:100 dilution). Cells were washed, resuspended in FACS buffer with Alexa Fluor 405-conjugated (Invitrogen, S32351, 1:100 dilution) or APC-Cy7-conjugated (BD Biosciences, 554063,
1:100 dilution) streptavidin secondary antibody, washed again before analysis with a FACSymphony A5 Cell Analyzer (BD Biosciences). Peripheral blood was collected from the submandibular vein
with lancets (Medipoint) into EDTA-coated tubes. Blood was resuspended in RBC lysing buffer and washed with FACS buffer. Cells were resuspended and incubated with the following primary
antibodies in FACS buffer: biotinylated rat monoclonal anti-haematopoietic lineage antibody cocktail (Miltenyi-Biotgec, 130-092-613, 1:50 dilution), APC-conjugated rat monoclonal anti-CD117
(BD Biosciences, 553356, 1:100 dilution), FITC-conjugated rat monoclonal anti-Ly6A/E (Sca1) (eBioscience, 11-5981-85, 1:100 dilution), Pacific Blue-conjugated mouse monoclonal anti-CD45.2
(Biolegend, 109820, 1:100 dilution), APC-conjugated hamster monoclonal anti-CD3e (eBioscience, 17-0031, 1:100 dilution), PE-conjugated rat monoclonal anti-CD45R/B220 (BD Biosciences, 553090,
1:100 dilution), FITC-conjugated rat monoclonal anti-CD11b (BD Biosciences, 553310, 1:100 dilution). Cells were washed and resuspended in FACS buffer before analysis with a FACSymphony A5
Cell Analyzer (BD Biosciences). RNA EXTRACTION AND QUANTITATIVE PCR FACS-sorted cells from 10-week-old mouse skulls were lysed and RNA was extracted using a Monarch Total RNA Miniprep Kit
(New England BioLabs, T2010S). Extracted RNA concentration was measured with a NanoDrop 8000 Spectrophotometer (Thermo Fisher Scientific) and cDNA was generated with a LuncaScript RT
SuperMix Kit (New England BioLabs, E3010L). Quantitative PCR with reverse transcription was performed with a BioRad CFX96 real-time PCR system using FAM-conjugated Taqman probes for _Vegfa_
(Mm00437306_m1) or using PowerUp SYBR Green Master Mix (Applied Biosystems, A25742) with primers designed using Pimer-BLAST or adopted from previously published studies: _Vegfa__120_
(5′-AACGATGAAGCCCTGGAGTG-3′; 5′-TGAGAGGTCTGGTTCCCGA-3′); _Vegfa__164_ (5′-AACGATGAAGCCCTGGAGTG; 5′-GACAAACAAATGCTTTCTCCG-3′); _Vegfa__188_ (5′-AACGATGAAGCCCTGGAGTG-3′;
5′-AACAAGGCTCACAGTGAACG-3′). Gene expression levels were normalized to the endogenous VIC-conjugated _Gapdh_ probe (44326317E) as control. ELISA Mice from each age group were euthanized,
bones were collected. Skulls were chopped before being crushed with a mortar and pestle in ice-cold RIPA lysis buffer; femurs were crushed without chopping. Supernatants of centrifuged
lysates were further concentrated using an Ultra-0.5 Centrifugal Filter Unit with a 3 kDa cutoff (Millipore, UFC500396), resulting concentrations were measured using a Pierce BCA Protein
Assay Kit (Thermo Fisher Scientific, 23225), and the concentrations of VEGFA in tissue extracts were measured using a Mouse VEGFA Quantikine ELISA Kit (R&D Systems, MMV00-1). HYPOXIA
ANALYSIS Hypoxic cells were detected with the hypoxia probe pimonidazole (Pimo, Hypoxyprobe) according to the manufacturer’s instructions. Mice were intraperitoneally injected with 60 mg
kg−1 1 h before analysis. VEGFA PLASMID CONSTRUCTION AND OVEREXPRESSION To generate the pLIVE-VEGFA165-HA-MP-Asp8x bone-homing protein containing VEGF165 fused to a HA tag, metalloprotease
and 8x Asp peptide sequences, a cDNA fragment encoding amino acids 1–191 of human _VEGFA_ was amplified via PCR using the following oligonucleotide primers: VEGFA-AscI-Fwd:
5′-ATGAACTTTCTGCTGTCT-3′ and VEGFA-XhoI-Rev: 5′-CCGCCTCGGCTTGTCACATCTGCA-3′ and annealed with the NEBuilder Assembly Cloning Kit. Ten-week-old mice were used for hydrodynamic tail vein
injection. Mice were injected with 0.5 μg g−1 (plasmid/body weight) pLIVE-Vegfa plasmid suspended in TransIT-EE hydrodynamic delivery solution (Mirus, MIR5340). The appropriate amount of
plasmid was suspended in an injection volume of 10% of the body weight and injected into each individual mouse via the tail vein in 5–7 s as previously reported62. ADIPOCYTE ANALYSIS To
stain for neutral lipids, the entire calvarium or femur cryosections were incubated in BODIPY 493/503 (Invitrogen, D3922; 1:1,000 dilution) for 1 h at room temperature with gentle agitation
(only calvarium). Samples were washed with PBS 3–5 times at 5 min intervals before mounting. ANALYSIS OF INFLAMMATORY CYTOKINES Mice from each age group were euthanized and bones were
collected. Skulls were chopped before being crushed with a mortar and pestle in ice-cold RIPA lysis buffer; femurs were crushed without chopping. Supernatants of centrifuged lysates were
further concentrated using an Ultra-0.5 Centrifugal Filter Unit with a 3 kDa cutoff (Millipore, UFC500396), resulting concentrations were measured using a Pierce BCA Protein Assay Kit
(Thermo Fisher Scientific, 23225), and concentrations of inflammatory cyotokines were measured with LEGENDplex Mouse Inflammation Panel (13-plex) with V-bottom plates (Biolegend, 740446).
Analysis on a FACSymphony (BD Biosciences) and quantification were performed according to the manufacturer’s protocol. Data analysis was performed using software provided by Biolegend.
Manual gating was used to define beads A and B, and automatic gating strategy was used to gate individual cytokines in the APC–PE plot. IRRADIATION WITH PARTIAL SHIELDING Mice were
anaesthetized with ketamine (100 mg kg−1) and xylazine (10 mg kg−1) prior to irradiation. For partial shielding, the entire head or both legs of a mouse were inserted into the opening of the
cylindrical 1-inch-thick lead shield (JRT Associates, PTI-50-P) and exposed to lethal irradiation (12 Gy). The mouse was returned to its cage to recover under observation. SAMPLE
PREPARATION FOR SCRNA-SEQ Mice from each age group were euthanized and skull and femur were collected. Skulls were chopped with scissors in FACS buffer before crushed with mortar and pestle;
femurs were crushed without chopping. BM stromal samples were dissociated with Collagenase I (Gibco, 17100-017, 2 mg ml−1) and Collagenase IV (Gibco, 17104-019, 2 mg ml−1) in PBS for 20 min
at 37 °C with intermittent shaking. Cell suspensions were strained through a 40-μm mesh filter and washed with FACS buffer. Cells were resuspended and incubated with biotinylated rat
monoclonal anti-haematopoietic lineage antibody cocktail (Miltenyi-Biotec, 130-092-613, 1:50 dilution). Cells were washed, resuspended in FACS buffer with mouse monoclonal anti-Biotin
MicroBeads (Miltenyi-Biotec, 130-105-637, 1:50 dilution) and incubated before being loaded into a magnetic-associated cell sorting (MACS) column (Miltenyi-Biotec, 130-042-201) for lineage
depletion. Lin− cells were further incubated with rat monoclonal anti-CD45 MicroBeads (Miltenyi-Biotec, 130-052-301, 1:50 dilution), rat monoclonal anti-CD117 MicroBeads (Miltenyi-Biotec,
130-091-224, 1:50 dilution), biotinylated rat monoclonal anti-CD71 (Biolegend, 113803, 1:100). Cells were washed, resuspended in FACS buffer with mouse monoclonal anti-Biotin MicroBeads
(Miltenyi-Biotec, 130-105-637, 1:50 dilution) and incubated before being loaded into a magnetic-associated cell sorting (MACS) column (Miltenyi-Biotec, 130-042-201) for further
haematopoietic depletion. Single-cell suspensions were processed with BD Rhapsody and scRNA-seq libraries were evaluated and quantified by Agilent Bioanalyzer using High Sensitivity DNA Kit
(Agilent Technologies, 5067-4626) and Qubit (Thermo Fisher Scientific, Q32851). Individual libraries were diluted to 4 nM and pooled for sequencing. Pooled libraries were sequenced by using
High Output Kit (Illumina, TG-160-2002) with a NextSeq500 sequencer (Illumina). SCRNA-SEQ Preprocessing: STAR version 2.7.10a (PMID: 23104886) was used to generate a reference genome index
for GRCm39, with Gencode annotations vM29, subset to lncRNA and protein-coding genes. FASTQ reads were mapped against the reference genome index using STAR with the settings “--soloType
CB_UMI_Complex --soloCellFilter None --outSAMtype BAM SortedByCoordinate --soloFeatures GeneFull_Ex50pAS --soloCBmatchWLtype 1MM --soloUMIlen 8 --soloCBwhitelist BD_CLS1.txt BD_CLS2.txt
BD_CLS3.txt --runRNGseed 1 --soloMultiMappers EM --readFilesCommand zcat --outSAMattributes NH HI AS nM NM MD jM jI MC ch CB UB GX GN sS CR CY UR UY”. Libraries using standard BD Rhapsody
beads were mapped using the adapter parameters “--soloAdapterSequence NNNNNNNNNACTGGCCTGCGANNNNNNNNNGGTAGCGGTGACA --soloCBposition 2_0_2_8 2_21_2_29 3_1_3_9 --soloUMIposition 3_10_3_17”,
libraries with BD Rhapsody enhanced beads with --soloAdapterSequence NNNNNNNNNGTGANNNNNNNNNGACA --soloCBposition 2_0_2_8 2_13_2_21 3_1_3_9 --soloUMIposition 3_10_3_17. Raw counts were
imported as AnnData63 objects. We removed low complexity barcodes with the knee plot method, and further filtered out cells with a mitochondrial mRNA content, as well as unusually high total
and gene counts using manually determined cutoffs for each sample. Doublets were scored with scrublet64. Finally, each sample’s gene expression matrix was normalized using scran65 (1.22.1)
with Leiden clustering66 input at resolution 0.5. G2M and S phase scores were assigned to each cell using gene lists from ref. 67 and the scanpy68 (1.9.6) sc.tl.score_genes_cell_cycle
function. Embedding, clustering and annotation: different combinations of samples and cell populations (all, ECs, HSCs), were used as input for 2D embedding and clustering: the corresponding
expression matrix was subset to the 2,000 most highly variable genes (sc.pp.highly_variable_genes, flavour “seurat”). The top 50 principal components were calculated, and batch-corrected
using Harmony69 (0.0.9). The principal components served as basis for _k_-nearest neighbour calculation (sc.pp.neighbors, n_neighbors=30), which were used as input for UMAP70 layout
(sc.tl.umap, min_dist=0.3). Cell populations were clustered using scanpy.tl.leiden, and a suitable resolution was chosen for a first-pass annotation. Here, contaminating cell populations,
including multiplet clusters, were removed, and clustering was repeated. Cluster marker genes were calculated using a pseudobulk approach, comparing aggregate counts with 2 pseudoreplicates
for each cluster to all remaining cells (pyDeSEQ2 0.4.8). Finally, expression of select marker genes was plotted using Matplotlib71 (3.8.4) imshow, and clusters were annotated accordingly.
Differential expression analysis: Differentially expressed genes were calculated using a pseudobulk approach, comparing aggregate counts with two pseudoreplicates for each condition
(pyDeSEQ2 0.4.8). SKULL BM PHOTOCONVERSION _Vav1-KikGR_ mice were anaesthetized with ketamine (100 mg kg−1) and xylazine (10 mg kg−1). A skin flap was generated to expose the calvarium, as
previously described72. Each exposed area of the calvarium was then exposed to UV light from a Zeiss Axio Imager (Zeiss Microscopy) for 60 s, confirmed for photoconversion from green to red
fluorescence, before exposing another area. The skin flap was sutured back together and peripheral blood was analysed by flow cytometry, as described above, to check for the presence of
photoconverted cells, which were non-existent in the peripheral blood immediately after photoconversion. One week after photoconversion, peripheral blood was drawn, stained for Alexa
Fluor-conjugated rat monoclonal anti-CD45, and was analysed by flow cytometry for CD45+ photoconverted haematopoietic cells derived from the skull BM. STATISTICAL ANALYSIS No statistical
methods were used to predetermine sample size. The experiments were randomized and investigators were blinded to allocation during experiments and outcome analyses. All values are presented
as mean ± s.d. Statistical significance was determined by the two-tailed unpaired Student’s _t_-test between two groups or the Tukey multiple comparison test (one-way ANOVA) for
multiple-group comparison. Statistical analyses were performed using GraphPad Prism 9.0 (GraphPad Software). Statistical significance was set at _P_ < 0.05. REPORTING SUMMARY Further
information on research design is available in the Nature Portfolio Reporting Summary linked to this article. DATA AVAILABILITY The scRNA-seq data generated in this study have been deposited
in the Gene Expression Omnibus under accession number GSE275179. The mouse reference genome GRCm39 with GENCODE M26 annotation (https://www.gencodegenes.org/mouse/release_M26.html) was used
for mapping the reads in this study. All individual mouse lines used in this study are commercially available at The Jackson Laboratory. Plasmid constructs are available, upon request,
through the corresponding author. Source data are provided with this paper. CHANGE HISTORY * _ 27 NOVEMBER 2024 In the Methods, two instances of “cGy” have been updated to instead read as
“Gy”. _ REFERENCES * Hoggatt, J., Kfoury, Y. & Scadden, D. T. Hematopoietic stem cell niche in health and disease. _Annu. Rev. Pathol._ 11, 555–581 (2016). CAS PubMed Google Scholar *
Verovskaya, E. V., Dellorusso, P. V. & Passegue, E. Losing sense of self and surroundings: hematopoietic stem cell aging and leukemic transformation. _Trends Mol. Med._ 25, 494–515
(2019). PubMed PubMed Central Google Scholar * Comazzetto, S., Shen, B. & Morrison, S. J. Niches that regulate stem cells and hematopoiesis in adult bone marrow. _Dev. Cell_ 56,
1848–1860 (2021). CAS PubMed PubMed Central Google Scholar * van den Bos, T., Speijer, D., Bank, R. A., Bromme, D. & Everts, V. Differences in matrix composition between calvaria and
long bone in mice suggest differences in biomechanical properties and resorption: Special emphasis on collagen. _Bone_ 43, 459–468 (2008). PubMed Google Scholar * Sivaraj, K. K. &
Adams, R. H. Blood vessel formation and function in bone. _Development_ 143, 2706–2715 (2016). CAS PubMed Google Scholar * Mills, W. A., Coburn, M. A. & Eyo, U. B. The emergence of
the calvarial hematopoietic niche in health and disease. _Immunol. Rev._ 311, 26–38 (2022). CAS PubMed PubMed Central Google Scholar * Lo Celso, C. et al. Live-animal tracking of
individual haematopoietic stem/progenitor cells in their niche. _Nature_ 457, 92–96 (2009). ADS CAS PubMed Google Scholar * Christodoulou, C. et al. Live-animal imaging of native
haematopoietic stem and progenitor cells. _Nature_ 578, 278–283 (2020). ADS CAS PubMed PubMed Central Google Scholar * Lassailly, F., Foster, K., Lopez-Onieva, L., Currie, E. &
Bonnet, D. Multimodal imaging reveals structural and functional heterogeneity in different bone marrow compartments: functional implications on hematopoietic stem cells. _Blood_ 122,
1730–1740 (2013). CAS PubMed Google Scholar * Herisson, F. et al. Direct vascular channels connect skull bone marrow and the brain surface enabling myeloid cell migration. _Nat.
Neurosci._ 21, 1209–1217 (2018). CAS PubMed PubMed Central Google Scholar * Cugurra, A. et al. Skull and vertebral bone marrow are myeloid cell reservoirs for the meninges and CNS
parenchyma. _Science_ 373, eabf7844 (2021). CAS PubMed PubMed Central Google Scholar * Nakamura-Ishizu, A., Ito, K. & Suda, T. Hematopoietic stem cell metabolism during development
and aging. _Dev. Cell_ 54, 239–255 (2020). CAS PubMed PubMed Central Google Scholar * Potente, M., Gerhardt, H. & Carmeliet, P. Basic and therapeutic aspects of angiogenesis. _Cell_
146, 873–887 (2011). CAS PubMed Google Scholar * Chung, A. S. & Ferrara, N. Developmental and pathological angiogenesis. _Annu. Rev. Cell Dev. Biol._ 27, 563–584 (2011). CAS PubMed
Google Scholar * Ramasamy, S. K. et al. Regulation of hematopoiesis and osteogenesis by blood vessel–derived signals. _Annu. Rev. Cell Dev. Biol._ 32, 649–675 (2016). CAS PubMed Google
Scholar * Ramalingam, P., Butler, J. M. & Poulos, M. G. Vascular regulation of hematopoietic stem cell homeostasis, regeneration, and aging. _Current Stem Cell Rep._ 7, 194–203 (2021).
Google Scholar * Xu, Y. et al. Neuropilin-2 mediates VEGF-C–induced lymphatic sprouting together with VEGFR3. _J. Cell Biol._ 188, 115–130 (2010). CAS PubMed PubMed Central Google
Scholar * Kusumbe, A. P. et al. Age-dependent modulation of vascular niches for haematopoietic stem cells. _Nature_ 532, 380–384 (2016). ADS CAS PubMed PubMed Central Google Scholar *
Langen, U. H. et al. Cell–matrix signals specify bone endothelial cells during developmental osteogenesis. _Nat. Cell Biol._ 19, 189–201 (2017). CAS PubMed PubMed Central Google Scholar
* Yu, J. Direct evidence for the role of caveolin-1 and caveolae in mechanotransduction and remodeling of blood vessels. _J. Clin. Invest._ 116, 1284–1291 (2006). CAS PubMed PubMed Central
Google Scholar * de Boer, J. et al. Transgenic mice with hematopoietic and lymphoid specific expression of Cre. _Eur. J. Immunol._ 33, 314–325 (2003). PubMed Google Scholar * Muzumdar,
M. D., Tasic, B., Miyamichi, K., Li, L. & Luo, L. A global double-fluorescent Cre reporter mouse. _Genesis_ 45, 593–605 (2007). CAS PubMed Google Scholar * Mitchell, C. A. et al.
Stromal niche inflammation mediated by IL-1 signalling is a targetable driver of haematopoietic ageing. _Nat. Cell Biol._ 25, 30–41 (2023). CAS PubMed PubMed Central Google Scholar *
Olson, O. C., Kang, Y. A. & Passegue, E. Normal hematopoiesis is a balancing act of self-renewal and regeneration. _Cold Spring Harb. Perspect. Med._ 10, a035519 (2020). CAS PubMed
PubMed Central Google Scholar * Nakada, D. et al. Oestrogen increases haematopoietic stem-cell self-renewal in females and during pregnancy. _Nature_ 505, 555–558 (2014). ADS CAS PubMed
PubMed Central Google Scholar * Oguro, H. et al. 27-Hydroxycholesterol induces hematopoietic stem cell mobilization and extramedullary hematopoiesis during pregnancy. _J. Clin. Invest._
127, 3392–3401 (2017). PubMed PubMed Central Google Scholar * Rodrigues, J. et al. Estrogen enforces the integrity of blood vessels in the bone during pregnancy and menopause. _Nat.
Cardiovasc. Res._ 1, 918–932 (2022). PubMed PubMed Central Google Scholar * Courties, G. et al. Ischemic stroke activates hematopoietic bone marrow stem cells. _Circ. Res._ 116, 407–417
(2015). CAS PubMed Google Scholar * Mendez-Ferrer, S. et al. Bone marrow niches in haematological malignancies. _Nat. Rev. Cancer_ 20, 285–298 (2020). CAS PubMed PubMed Central Google
Scholar * Reid, I. R. & Billington, E. O. Drug therapy for osteoporosis in older adults. _Lancet_ 399, 1080–1092 (2022). CAS PubMed Google Scholar * Calvi, L. M. et al. Osteoblastic
cells regulate the haematopoietic stem cell niche. _Nature_ 425, 841–846 (2003). ADS CAS PubMed Google Scholar * Akunuru, S. & Geiger, H. Aging, clonality, and rejuvenation of
hematopoietic stem cells. _Trends Mol. Med._ 22, 701–712 (2016). CAS PubMed PubMed Central Google Scholar * Morrison, S. J., Wandycz, A. M., Akashi, K., Globerson, A. & Weissman, I.
L. The aging of hematopoietic stem cells. _Nat. Med._ 2, 1011–1016 (1996). CAS PubMed Google Scholar * Colom Diaz, P. A., Mistry, J. J. & Trowbridge, J. J. Hematopoietic stem cell
aging and leukemia transformation. _Blood_ 142, 533–542 (2023). CAS PubMed PubMed Central Google Scholar * North, T. E. et al. Prostaglandin E2 regulates vertebrate haematopoietic stem
cell homeostasis. _Nature_ 447, 1007–1011 (2007). ADS CAS PubMed PubMed Central Google Scholar * Porter, R. L. et al. Prostaglandin E2 increases hematopoietic stem cell survival and
accelerates hematopoietic recovery after radiation injury. _Stem Cells_ 31, 372–383 (2013). CAS PubMed Google Scholar * Hoggatt, J. et al. Rapid mobilization reveals a highly engraftable
hematopoietic stem cell. _Cell_ 172, 191–204.e110 (2018). CAS PubMed Google Scholar * Simons, M., Gordon, E. & Claesson-Welsh, L. Mechanisms and regulation of endothelial VEGF
receptor signalling. _Nat. Rev. Mol. Cell Biol._ 17, 611–625 (2016). CAS PubMed Google Scholar * Apte, R. S., Chen, D. S. & Ferrara, N. VEGF in signaling and disease: beyond discovery
and development. _Cell_ 176, 1248–1264 (2019). CAS PubMed PubMed Central Google Scholar * Chen, Q. et al. Apelin+ endothelial niche cells control hematopoiesis and mediate vascular
regeneration after myeloablative injury. _Cell Stem Cell_ 25, 768–783.e766 (2019). CAS PubMed PubMed Central Google Scholar * Schipani, E., Wu, C., Rankin, E. B. & Giaccia, A. J.
Regulation of bone marrow angiogenesis by osteoblasts during bone development and homeostasis. _Front. Endocrinol._ 4, 85 (2013). Google Scholar * Wong, B. W., Marsch, E., Treps, L., Baes,
M. & Carmeliet, P. Endothelial cell metabolism in health and disease: impact of hypoxia. _EMBO J._ 36, 2187–2203 (2017). CAS PubMed PubMed Central Google Scholar * Suda, T. &
Liu, D. Hydrodynamic gene delivery: its principles and applications. _Mol. Ther._ 15, 2063–2069 (2007). CAS PubMed Google Scholar * Ho, Y.-H. & Méndez-Ferrer, S. Microenvironmental
contributions to hematopoietic stem cell aging. _Haematologica_ 105, 38–46 (2020). CAS PubMed PubMed Central Google Scholar * Ambrosi, T. H. et al. Adipocyte accumulation in the bone
marrow during obesity and aging impairs stem cell-based hematopoietic and bone regeneration. _Cell Stem Cell_ 20, 771–784.e776 (2017). CAS PubMed PubMed Central Google Scholar * Ho, Y.
H. et al. Remodeling of bone marrow hematopoietic stem cell niches promotes myeloid cell expansion during premature or physiological aging. _Cell Stem Cell_ 25, 407–418.e406 (2019). CAS
PubMed PubMed Central Google Scholar * Brioschi, S. et al. Heterogeneity of meningeal B cells reveals a lymphopoietic niche at the CNS borders. _Science_ 373, eabf9277 (2021). CAS PubMed
PubMed Central Google Scholar * McClatchy, J. et al. Clonal hematopoiesis related TET2 loss-of-function impedes IL1β-mediated epigenetic reprogramming in hematopoietic stem and
progenitor cells. _Nat. Commun._ 14, 8102 (2023). ADS CAS PubMed PubMed Central Google Scholar * Tomura, M. et al. Tracking and quantification of dendritic cell migration and antigen
trafficking between the skin and lymph nodes. _Sci. Rep._ 4, 6030 (2014). CAS PubMed PubMed Central Google Scholar * Maes, C. Role and regulation of vascularization processes in
endochondral bones. _Calcif. Tissue Int._ 92, 307–323 (2013). CAS PubMed Google Scholar * Carmeliet, P. & Jain, R. K. Molecular mechanisms and clinical applications of angiogenesis.
_Nature_ 473, 298–307 (2011). ADS CAS PubMed PubMed Central Google Scholar * Hooper, A. T. et al. Engraftment and reconstitution of hematopoiesis is dependent on VEGFR2-mediated
regeneration of sinusoidal endothelial cells. _Cell Stem Cell_ 4, 263–274 (2009). CAS PubMed PubMed Central Google Scholar * Hu, K. & Olsen, B. R. Osteoblast-derived VEGF regulates
osteoblast differentiation and bone formation during bone repair. _J. Clin. Invest._ 126, 509–526 (2016). PubMed PubMed Central Google Scholar * Grunewald, M. et al. Counteracting
age-related VEGF signaling insufficiency promotes healthy aging and extends life span. _Science_ 373, eabc8479 (2021). CAS PubMed Google Scholar * Ding, L., Saunders, T. L., Enikolopov,
G. & Morrison, S. J. Endothelial and perivascular cells maintain haematopoietic stem cells. _Nature_ 481, 457–462 (2012). ADS CAS PubMed PubMed Central Google Scholar * Greenbaum,
A. et al. CXCL12 in early mesenchymal progenitors is required for haematopoietic stem-cell maintenance. _Nature_ 495, 227–230 (2013). ADS CAS PubMed PubMed Central Google Scholar *
Heidt, T. et al. Chronic variable stress activates hematopoietic stem cells. _Nat. Med._ 20, 754–758 (2014). CAS PubMed PubMed Central Google Scholar * Kolabas, Z. I. et al. Distinct
molecular profiles of skull bone marrow in health and neurological disorders. _Cell_ 186, 3706–3725.e3729 (2023). CAS PubMed PubMed Central Google Scholar * Sabanciogullari, V. et al.
Diploe thickness and cranial dimensions in males and females in mid-Anatolian population: an MRI study. _Forensic Sci. Int._ 219, 289.e281–287 (2012). Google Scholar * Lillie, E. M., Urban,
J. E., Lynch, S. K., Weaver, A. A. & Stitzel, J. D. Evaluation of skull cortical thickness changes with age and sex from computed tomography scans. _J. Bone Miner. Res._ 31, 299–307
(2016). PubMed Google Scholar * Krause, D. S. et al. Differential regulation of myeloid leukemias by the bone marrow microenvironment. _Nat. Med._ 19, 1513–1517 (2013). CAS PubMed PubMed
Central Google Scholar * Liu, F., Song, Y. & Liu, D. Hydrodynamics-based transfection in animals by systemic administration of plasmid DNA. _Gene Ther._ 6, 1258–1266 (1999). CAS
PubMed Google Scholar * Virshup, I., Rybakov, S., Theis, F. J., Angerer, P. & Wolf, F. A. anndata: annotated data. Preprint at _bioRxiv_ https://doi.org/10.1101/2021.12.16.473007v1
(2021). * Wolock, S. L., Lopez, R. & Klein, A. M. Scrublet: computational identification of cell doublets in single-cell transcriptomic data. _Cell Syst._ 8, 281–291.e9 (2019). CAS
PubMed PubMed Central Google Scholar * Lun, A. T. L., Bach, K. & Marioni, J. C. Pooling across cells to normalize single-cell RNA sequencing data with many zero counts. _Genome Biol._
17, 75 (2016). PubMed Google Scholar * Traag, V. A., Waltman, L. & van Eck, N. J. From Louvain to Leiden: guaranteeing well-connected communities. _Sci. Rep._ 9, 5233 (2019). ADS CAS
PubMed PubMed Central Google Scholar * Tirosh, I. et al. Dissecting the multicellular ecosystem of metastatic melanoma by single-cell RNA-seq. _Science_ 352, 189–196 (2016). ADS CAS
PubMed PubMed Central Google Scholar * Wolf, F. A., Angerer, P. & Theis, F. J. SCANPY: large-scale single-cell gene expression data analysis. _Genome Biol._ 19, 15 (2018). PubMed
PubMed Central Google Scholar * Korsunsky, I. et al. Fast, sensitive and accurate integration of single-cell data with Harmony. _Nat. Methods_ 16, 1289–1296 (2019). CAS PubMed PubMed
Central Google Scholar * McInnes, L., Healy, J. & Melville, J. UMAP: uniform manifold approximation and projection for dimension reduction. Preprint at
https://doi.org/10.48550/arXiv.1802.03426 (2018). * Hunter, J. D. Matplotlib: a 2D graphics environment. _Comput. Sci. Eng._ 9, 90–95 (2007). Google Scholar * Koh, B. I. et al. VEGFR2
signaling drives meningeal vascular regeneration upon head injury. _Nat. Commun._ 11, 3866 (2020). ADS PubMed PubMed Central Google Scholar Download references ACKNOWLEDGEMENTS The
authors thank M. Stehling (MPI Münster), J. Kirsch (FCCF, DRFZ) and C. Conche (HI-TRON Mainz, DKFZ) for FACS technical assistance; F. Berkenfeld for supporting animal colony maintenance; and
K. Müller for sequencing technical assistance. V.M. is a part of the Cells in Motion-International Max Planck Research School (CiM-IMPRS) and University of Münster, Germany. R.H.A. is
supported by the Max Planck Society, the European Research Council (AdG 101139772, PROTECT), the DFG (CRC 1366, project no. 394046768), and the Leducq Foundation. FUNDING Open access funding
provided by Max Planck Society. AUTHOR INFORMATION AUTHORS AND AFFILIATIONS * Department of Tissue Morphogenesis, Max Planck Institute for Molecular Biomedicine, Münster, Germany Bong Ihn
Koh, Vishal Mohanakrishnan, Hongryeol Park, Susanne Adams, M. Gabriele Bixel & Ralf H. Adams * Sequencing Core Facility, Max Planck Institute for Molecular Biomedicine, Münster, Germany
Hyun-Woo Jeong * Bioinformatics Service Unit, Max Planck Institute for Molecular Biomedicine, Münster, Germany Kai Kruse * Department of Radiology and Research Institute of Radiology, Asan
Medical Center, University of Ulsan College of Medicine, Seoul, Republic of Korea Young Jun Choi * Department of Neurosurgery, Charité-Universitätsmedizin Berlin, corporate member of Freie
Universität Berlin and Humboldt-Universität zu Berlin, Berlin, Germany Melina Nieminen-Kelhä & Peter Vajkoczy * Institute of Transfusion Medicine, Transfusion Center, University Medicine
Mainz, Mainz, Germany Rahul Kumar & Daniela S. Krause * Georg-Speyer-Haus Institute for Tumor Biology and Experimental Medicine and Goethe University Frankfurt, Frankfurt, Germany
Raquel S. Pereira * Center for Vascular Research, Institute for Basic Science, Daejeon, Republic of Korea Hyuek Jong Lee Authors * Bong Ihn Koh View author publications You can also search
for this author inPubMed Google Scholar * Vishal Mohanakrishnan View author publications You can also search for this author inPubMed Google Scholar * Hyun-Woo Jeong View author publications
You can also search for this author inPubMed Google Scholar * Hongryeol Park View author publications You can also search for this author inPubMed Google Scholar * Kai Kruse View author
publications You can also search for this author inPubMed Google Scholar * Young Jun Choi View author publications You can also search for this author inPubMed Google Scholar * Melina
Nieminen-Kelhä View author publications You can also search for this author inPubMed Google Scholar * Rahul Kumar View author publications You can also search for this author inPubMed Google
Scholar * Raquel S. Pereira View author publications You can also search for this author inPubMed Google Scholar * Susanne Adams View author publications You can also search for this author
inPubMed Google Scholar * Hyuek Jong Lee View author publications You can also search for this author inPubMed Google Scholar * M. Gabriele Bixel View author publications You can also
search for this author inPubMed Google Scholar * Peter Vajkoczy View author publications You can also search for this author inPubMed Google Scholar * Daniela S. Krause View author
publications You can also search for this author inPubMed Google Scholar * Ralf H. Adams View author publications You can also search for this author inPubMed Google Scholar CONTRIBUTIONS
B.I.K. and R.H.A. designed the study and interpreted results. B.I.K. designed, conducted and analysed the majority of the experiments, including all pharmacological treatments, skull sample
processing, immunostainings, transplantations, FACS sorting and analyses, RNA and protein analyses, and photoconversion surgeries. V.M. processed femur samples and provided technical
assistance. H.-W.J. and H.P. provided technical assistance. K.K. performed scRNA-seq analyses. Y.J.C. conducted and analysed human head CT scans. M.N.-K. and P.V. designed and performed
transient middle cerebral artery occlusion surgeries. R.K., R.S.P. and D.S.K. generated the CML mouse model and contributed to project design. S.A. generated pLIVE plasmids. H.J.L. conducted
scanning electron microscopy sample processing and imaging. M.G.B. contributed to project design and data interpretation. R.H.A. supervised the project. CORRESPONDING AUTHORS Correspondence
to Bong Ihn Koh or Ralf H. Adams. ETHICS DECLARATIONS COMPETING INTERESTS The authors declare no competing interests. PEER REVIEW PEER REVIEW INFORMATION _Nature_ thanks the anonymous
reviewer(s) for their contribution to the peer review of this work. Peer review reports are available. ADDITIONAL INFORMATION PUBLISHER’S NOTE Springer Nature remains neutral with regard to
jurisdictional claims in published maps and institutional affiliations. EXTENDED DATA FIGURES AND TABLES EXTENDED DATA FIG. 1 AGE-DEPENDENT EXPANSION OF BM IN SKULL. A, B. DAPI staining and
quantification of mouse skull coronal cryosections showing expansion of BM cellular content during adulthood and aging (n = 4 mice/group from three independent experiments). Blue arrowheads
indicate location of magnified inset. C, D. IF staining and quantification of skull coronal cryosections showing increased vATPase+ activated osteoclasts attached to Osteopontin+ bone
surfaces in old versus young specimen (n = 4 mice/group from two independent experiments). Scale bars, 1 mm. Vertical bars indicate mean ± SD. _P_ values were calculated using Tukey multiple
comparison test (one-way ANOVA) and two-tailed unpaired Student’s _t_-test. Source Data EXTENDED DATA FIG. 2 AGE-RELATED EXPANSION OF DIPLOIC SPACE IN HUMAN SKULL. A. Method for
quantification of whole bone, cortex and bone marrow areas in human patient CT scans. B, C. Representative coronal CT images (B) and quantification (C) of young (21–40 years old) and old
(61–69 years old) female and male human skulls showing enlargement of diploic space with aging (n = 9 patients/group). Scale bars, 2 cm. Vertical bars indicate mean ± SD. _P_ values were
calculated using two-tailed unpaired Student’s _t_-test. Source Data EXTENDED DATA FIG. 3 REGIONAL DIFFERENCES AND EXPANSION OF SKULL BM. A, C. In vivo IF staining (A) and quantification of
BM vessels (C) in _Flk1-GFP_ reporter mice showing distinct blood vessel architecture in frontal (F), parietal (P) and interparietal (i-P) skull. Arrowheads indicate Flk1low/− CD31+
arterioles. n = 6 mice/group for vascular area, n = 20 randomly selected vessels from all samples/group for vessel diameter from two independent experiments. Boxed areas in overview image
(left) indicate location of magnified images. Scale bar, 1 mm. B, D. Imaging (B) and quantification (D) of Evans Blue vascular leakage in different skull bone parts (n = 4 mice/group from
three independent experiments). Boxed areas in overview image (left) indicate location of magnified images. Scale bar, 1 mm. E. IF staining of skull BM blood vessels showing increase in
vascular network complexity with aging. Dotted lines demarcate dorsal and ventral skull boundaries. Representative images from four independent experiments. Scale bars, 100 μm. F, G. IF
staining and quantification of caveolin-1-positive (Cav1+) blood vessels showing an increase with aging (n = 8 mice/group from two independent experiments). Dotted lines demarcate dorsal and
ventral boundaries of the skull. Scale bars, 100 μm. Vertical bars indicate mean ± SD. _P_ values were calculated using Tukey multiple comparison test (one-way ANOVA) and two-tailed
unpaired Student’s _t_-test. Source Data EXTENDED DATA FIG. 4 ASSOCIATION OF VESSELS AND HEMATOPOIETIC CELLS IN SKULL BM. A, B. In vivo IF staining (A) and quantification (B) of CD45+
hematopoietic cells in skull BM during aging (n = 4 mice/group from three independent experiments). Green arrowheads indicate dense clusters of CD45+ cells. Scale bars, 500 μm. C. Genetic
labeling of hematopoietic cells in _Vav-Cre Rosa26-mTmG_ mice (Vav-mTmG) shows association (arrowheads) of GFP-expressing cells with large CD31+ vessels. Representative images from three
independent experiments. Scale bars, 150 μm. D. Confocal images showing association of CD3ɛ+ T lymphocytes (green), B220+ B lymphocytes (red) and CD11b+ cells (green) with large-caliber
CD31+ BM vessel in aged skull. Representative images from three independent experiments. Vertical bars indicate mean ± SD. _P_ values were calculated using Tukey multiple comparison test
(one-way ANOVA). Scale bars, 500 μm. Source Data EXTENDED DATA FIG. 5 AGE-RELATED CHANGES IN THE BM VASCULATURE. A, B. In vivo IF staining (A) and quantification (B) of femoral BM vessels
showing vascular deterioration during aging by comparing young (Y), middle-aged (M), old (O), and geriatric (G) specimen (n = 5 mice/group for vascular density and Endomucin intensity, n =
10 randomly selected vessels from all samples/group from three independent experiments). Scale bars, 500 μm. C. Electron micrographs showing the surface of BM endothelial cells in young vs.
old skull or femur, as indicated. Note regular pattern of fenestrations (black arrowheads) in young and old skull but disorganized pattern with larger gaps (yellow arrowheads) in old femur.
Representative images from three independent experiments. Scale bars, 1 μm. D, E. IF staining (D) and quantification (E) of dural blood vessels revealing substantial decrease in vascular
density with aging. n = 3 (young), n = 6 (old) mice/group from three independent experiments. Scale bars, 250 μm. Vertical bars indicate mean ± SD. _P_ values were calculated using Tukey
multiple comparison test (one-way ANOVA) and two-tailed unpaired Student’s _t_-test. Source Data EXTENDED DATA FIG. 6 PATHOPHYSIOLOGICAL CHANGES IN THE FEMORAL BM VASCULATURE. A, B. In vivo
IF staining (A) and quantification (B) of femoral BM blood vessels in pregnant (17 dpc) and post-partum (2 dpp) female mice. n = 3 mice/group from three independent experiments. C, D. In
vivo IF staining (C) and quantification (D) of femoral BM blood vessels in mice 7 days after transient mid-cerebral artery occlusion (tMCAO). n = 6 (sham), n = 8 (tMCAO) from three
independent experiments. E, F. In vivo IF staining (E) and quantification (F) of femoral BM blood vessels in mice with chronic myeloid leukemia. n = 4 mice/group from three independent
experiments. G, H. In vivo IF staining (G) and quantification (H) of femoral BM blood vessels in mice with 28-day sustained parathyroid hormone (PTH) treatment. n = 4 mice/group from three
independent experiments. Scale bars, 1 mm. Vertical bars indicate mean ± SD. _P_ values were calculated using Tukey multiple comparison test (one-way ANOVA) and two-tailed unpaired Student’s
_t_-test. Source Data EXTENDED DATA FIG. 7 EFFECT OF TREATMENTS AFFECTING HSPCS. A, B. In vivo IF staining (A) and quantification (B) of femoral BM blood vessels in recipient mice receiving
hematopoietic lineage-negative cells isolated from young or old donors (young skull (YS), old skull (OS), young femur (YF), old femur (OF)). n = 4 mice/group from three independent
experiments. Scale bars, 1 mm. C, D. Diagram showing experimental scheme for PGE2 treatment for HSPC expansion (C) and quantification (D) of HSPCs in skull BM and spleen weight with PGE2
treatment (n = 3 mice/group from three independent experiments). E, F. Diagram showing experimental scheme for AMD3100 treatment for HSPC mobilization (E) and quantification (F) of HSPCs in
peripheral blood and spleen weight with AMD3100 treatment (n = 5 mice/group from three independent experiments). G-J. In vivo IF staining (G, I) and quantification (H, J) of femoral BM blood
vessels in mice treated with PGE2 (G, H) or AMD3100 (I, J) for HSPC expansion or mobilization, respectively. n = 6 (PGE2 Control), n = 5 (PGE2), n = 4 (all other groups) mice/group from
three independent experiments. Scale bars, 1 mm. Vertical bars indicate mean ± SD. _P_ values were calculated using two-tailed unpaired Student’s _t_-test. Source Data EXTENDED DATA FIG. 8
VEGF-A RESPONSE TO PATHOPHYSIOLOGICAL CONDITIONS. A. VEGF-A protein concentrations in total BM lysates from skull or femur isolated from mice in various pathophysiological conditions,
including pregnancy, stroke, chronic myeloid leukemia and sustained PTH treatment. n = 4 (Pregnancy, Stroke and PTH) and n = 5 (CML) mice/group from two independent experiments. Vertical
bars indicate mean ± SD. _P_ values were calculated using two-tailed unpaired Student’s _t_-test. Source Data EXTENDED DATA FIG. 9 VEGF EXPRESSION AND HYPOXIA IN BM COMPARTMENTS. A. qRT-PCR
analyses of _Vegfa_ mRNA in FACS-sorted LSK (LIN- Sca1+ cKit+), cKit+ (LIN- Sca1- cKit+), Lin neg (LIN- Sca1- cKit-) and Lin pos (LIN+) populations isolated from femur BM of young or old
mice (n = 5 mice pooled/sample from three independent experiments). B. qRT-PCR analyses of _Vegfa_ mRNA isoforms in populations shown in (A) isolated from skull or femur BM of young or old
mice (n = 5 mice pooled/sample from three independent experiments). C, D. IF staining (C) and quantification (D) of IV-injected Hypoxyprobe in young, old and geriatric skull and femoral BM,
as indicated. Note increase of Hypoxyprobe signal in skull but not in femur (arrowheads, n = 5 mice/group from two independent experiments). Scale bars, 1 mm. Vertical bars indicate mean ±
SD. **_P_ < 0.01, ***_P_ < 0.001 versus Young LSK (a) or Young (d), #_P_ < 0.05 versus Old by Tukey multiple comparison test (one-way ANOVA). E, H. Diagram showing experimental
scheme for _Vegfa_ overexpression or anti-VEGFR2 blocking antibody DC101 treatment. F-J. In vivo IF staining (F, I) and quantification (G, J) of femoral BM blood vessels in mice after
hydrodynamic injection of bone-homing _Vegfa_ construct (n = 4 mice/group from three independent experiments) (F, G) or treatment with anti-VEGFR2 blocking antibody (DC101) for 12 weeks (n =
5 mice/group from two independent experiments) (I, J). Scale bars, 1 mm. Vertical bars indicate mean ± SD. _P_ values were calculated using two-tailed unpaired Student’s _t_-test. Source
Data EXTENDED DATA FIG. 10 LONG-TERM RECONSTITUTION POTENTIAL OF SKULL HSCS. A. Diagram showing experimental scheme for serial hematopoietic reconstitution following serial partial
irradiation with shielding. B. Monthly FACS analysis of T, B, and myeloid cells in peripheral blood isolated from animals with head versus leg shielding during primary and secondary
hematopoietic reconstitution (n = 5 (Head shield), n = 4 (Leg shield) mice/group from two independent experiments). Vertical bars indicate mean ± SD. C-E. Fluorescence imaging (C) and
quantification (D, E) of skull or femoral BM blood vessels in Cdh5-mTnG (mTomato, red) reporter mice at 7 days after lethal irradiation with (+) or without (-) bone marrow transplantation
(BMT), as indicated. Note minimal vascular alterations in the skull BM compared to substantial vascular changes in femoral BM (n = 6 mice/group for vascular area/density, n = 10 randomly
selected vessels from all samples/group for vessel diameter from three independent experiments). Vertical bars indicate mean ± SD. _P_ values were calculated using Tukey multiple comparison
test (one-way ANOVA). Source Data EXTENDED DATA FIG. 11 SINGLE-CELL RNA-SEQUENCING ANALYSIS OF HSPCS AND STROMAL CELLS IN SKULL AND FEMUR BONE MARROW DURING AGING. A. UMAP plot showing
color-coded merged cell clusters of FACS-sorted cKit+ HSPCs and hematopoietic lineage-depleted bone marrow cells. Hematopoietic stem cell (HSC), multi-potent progenitor (MPP), myeloid
progenitor (MyPro), lymphoid progenitor (LyPro), megakaryocyte-erythrocyte progenitor (MEP), pre-B-cell (Pre-B), sinusoidal endothelial cell (sEC), arterial endothelial cell (aEC), bone
marrow mesenchymal stromal cell (bmMSC), metaphyseal mesenchymal stromal cell (mpMSC), smooth muscle cell (SMC), osteoblast (Ob). B. Heat map showing top cell marker genes of each cell
population shown in (A). C. Group-selected color-coded cell clusters from young or old, skull or femur as indicated. D. Frequency plots of color-coded HSPCs (top) and endothelial cells
(bottom) from young skull (YS), old skull (OS), young femur (YF), old femur (OF). EXTENDED DATA FIG. 12 SINGLE-CELL RNA-SEQUENCING ANALYSIS OF HSCS IN SKULL AND FEMUR BONE MARROW DURING
AGING. A. UMAP plot showing color-coded merged cell clusters of HSCs identified in Extended Data Fig. 11. B. Heat map showing top cell marker genes of each cell population shown in (A). C.
Frequency plots of color-coded HSCs from young skull (YS), old skull (OS), young femur (YF), old femur (OF). D. Differentially expressed genes (DEG) analysis comparing HSCs from geriatric
skull versus femur. E. DEG analysis comparing each HSC subcluster from geriatric skull versus femur. F. Violin plots showing the expression of selected genes with log normalized values for
inflammatory and myeloid determination factors in each HSC subcluster identified in (A). Skull HSC1 (n = 6216 cells), HSC2 (n = 3713 cells), HSC3 (n = 768 cells) and Femur HSC1 (n = 6726
cells), HSC2 (n = 3006 cells), HSC3 (n = 719 cells) isolated from n = 5 mice from two independent experiments. The box of each boxplot starts in the first quartile and ends in the third,
with the line inside representing the median. Blue dots, _p_-adjusted value < 0.01 and Log2 fold change <0.5; orange dots, _p_-adjusted value < 0.01 and Log2 fold change > 0.5 by
two-tailed unpaired Student’s _t_-test. EXTENDED DATA FIG. 13 HSPCS ARE DEPENDENT ON MICROENVIRONMENT DURING AGING. A, B. Brightfield image (A) and quantification (B) of primary and
secondary colony forming unit (CFU) assays of 500 FACS-sorted LSK cells isolated from young or geriatric skull or femur bone marrow (n = 4 mice/group from two independent experiments). Scale
bar, 5 mm. Vertical bars indicate mean ± SD. _P_ values were calculated using Tukey multiple comparison test (one-way ANOVA). Source Data EXTENDED DATA FIG. 14 SINGLE-CELL RNA-SEQUENCING
ANALYSIS OF ECS IN SKULL AND FEMUR BONE MARROW DURING AGING. A. UMAP plot showing color-coded merged cell clusters of ECs identified in Extended Data Fig. 11. B. Heat map showing top cell
marker genes of each cell population shown in (A). C. Frequency plots of color-coded ECs from young skull (YS), old skull (OS), young femur (YF), old femur (OF). D, E. Violin plots showing
the expression of selected genes with log normalized values for vascular signaling factors in ECs (D) and each EC subcluster (E) from geriatric skull versus femur. Skull ECs (n = 2414
cells), Arterial (n = 1070 cells), Sinusoidal 1 (n = 329 cells), Sinusoidal 2 (n = 833 cells), Venous (n = 182 cells) and Femur ECs (n = 594 cells), Arterial (n = 430 cells), Sinusoidal 1 (n
= 19 cells), Sinusoidal 2 (n = 58 cells), Venous (n = 87 cells) isolated from n = 5 mice from two independent experiments. The box of each boxplot starts in the first quartile and ends in
the third, with the line inside representing the median. F. Differentially expressed genes (DEG) analysis comparing ECs from geriatric skull versus femur. G, H. Heat map showing the
expression of selected genes with log normalized values for inflammatory factors (G) and HSC-regulating factors (H) identified in (F). Blue dots, _p_-adjusted value < 0.01 and Log2 fold
change <0.5; orange dots, _p_-adjusted value < 0.01 and Log2 fold change > 0.5 by two-tailed unpaired Student’s _t_-test. SUPPLEMENTARY INFORMATION REPORTING SUMMARY SUPPLEMENTARY
DATA 1 Flow cytometric analyses of skull or femur BM in ageing, pregnancy, stroke, CML, PTH treatment, young versus old transplantation, PGE2 treatment, AMD3100 treatment, pLIVE-Vegfa
overexpression and DC101 treatment. SUPPLEMENTARY DATA 2 Gating strategies for all FACS isolation and flow cytometric analyses performed in the study. PEER REVIEW FILE SOURCE DATA SOURCE
DATA FIGS. 1–5 AND SOURCE DATA EXTENDED DATA FIGS. 1–10 AND 13. RIGHTS AND PERMISSIONS OPEN ACCESS This article is licensed under a Creative Commons Attribution 4.0 International License,
which permits use, sharing, adaptation, distribution and reproduction in any medium or format, as long as you give appropriate credit to the original author(s) and the source, provide a link
to the Creative Commons licence, and indicate if changes were made. The images or other third party material in this article are included in the article’s Creative Commons licence, unless
indicated otherwise in a credit line to the material. If material is not included in the article’s Creative Commons licence and your intended use is not permitted by statutory regulation or
exceeds the permitted use, you will need to obtain permission directly from the copyright holder. To view a copy of this licence, visit http://creativecommons.org/licenses/by/4.0/. Reprints
and permissions ABOUT THIS ARTICLE CITE THIS ARTICLE Koh, B.I., Mohanakrishnan, V., Jeong, HW. _et al._ Adult skull bone marrow is an expanding and resilient haematopoietic reservoir.
_Nature_ 636, 172–181 (2024). https://doi.org/10.1038/s41586-024-08163-9 Download citation * Received: 10 October 2023 * Accepted: 07 October 2024 * Published: 13 November 2024 * Issue Date:
05 December 2024 * DOI: https://doi.org/10.1038/s41586-024-08163-9 SHARE THIS ARTICLE Anyone you share the following link with will be able to read this content: Get shareable link Sorry, a
shareable link is not currently available for this article. Copy to clipboard Provided by the Springer Nature SharedIt content-sharing initiative