- Select a language for the TTS:
- UK English Female
- UK English Male
- US English Female
- US English Male
- Australian Female
- Australian Male
- Language selected: (auto detect) - EN
Play all audios:
ABSTRACT Crystallographic phase engineering plays an important part in the precise control of the physical and electronic properties of materials. In two-dimensional transition metal
dichalcogenides (2D TMDs), phase engineering using chemical lithiation with the organometallization agent _n_-butyllithium (_n_-BuLi), to convert the semiconducting 2H (trigonal) to the
metallic 1T (octahedral) phase, has been widely explored for applications in areas such as transistors, catalysis and batteries1,2,3,4,5,6,7,8,9,10,11,12,13,14,15. Although this chemical
phase engineering can be performed at ambient temperatures and pressures, the underlying mechanisms are poorly understood, and the use of _n_-BuLi raises notable safety concerns. Here we
optically visualize the archetypical phase transition from the 2H to the 1T phase in mono- and bilayer 2D TMDs and discover that this reaction can be accelerated by up to six orders of
magnitude using low-power illumination at 455 nm. We identify that the above-gap illumination improves the rate-limiting charge-transfer kinetics through a photoredox process. We use this
method to achieve rapid and high-quality phase engineering of TMDs and demonstrate that this methodology can be harnessed to inscribe arbitrary phase patterns with diffraction-limited edge
resolution into few-layer TMDs. Finally, we replace pyrophoric _n_-BuLi with safer polycyclic aromatic organolithiation agents and show that their performance exceeds that of _n_-BuLi as a
phase transition agent. Our work opens opportunities for exploring the in situ characterization of electrochemical processes and paves the way for sustainably scaling up materials and
devices by photoredox phase engineering. SIMILAR CONTENT BEING VIEWED BY OTHERS TOWARDS THE SCALABLE SYNTHESIS OF TWO-DIMENSIONAL HETEROSTRUCTURES AND SUPERLATTICES BEYOND EXFOLIATION AND
RESTACKING Article 03 September 2024 ROBUST GROWTH OF TWO-DIMENSIONAL METAL DICHALCOGENIDES AND THEIR ALLOYS BY ACTIVE CHALCOGEN MONOMER SUPPLY Article Open access 23 February 2022 MOLECULAR
PRECURSORS FOR THE ELECTRODEPOSITION OF 2D-LAYERED METAL CHALCOGENIDES Article 08 January 2025 MAIN Transition metal dichalcogenides (TMDs) exhibit a wide range of electronic properties
based on their crystallographic structure1,2. Of particular interest is the phase transition from the trigonal 2H to the octahedral 1T (including 1T and distorted 1T) phase, which changes
the electronic behaviour from a semiconducting to a quasi-metallic1,2,3 state. This phase transition has been exploited to enhance field effect transistor device performances by lowering the
contact resistance3,4,5, to increase the hydrogen evolution reactivity6,7,8,9 and to unlock a wide range of chemical exfoliations and functionalization down to single-layer TMDs10,11,12,13.
More recently, it has also been used to advance flexible rectifying antennas14 and lithium–sulfur battery technology15. Chemical lithiation using the organolithiation agent _n_-butyllithium
(_n_-BuLi), which was first proposed in 1975 (ref. 16), remains the most popular route to achieve the 2H to 1T/1T′ phase transition. Here, the semiconducting 2H-TMD is immersed in _n_-BuLi,
which yields the 1T/1T′ phase after several days. Mechanistically, _n_-BuLi first donates an electron to the 2H-TMD, which enables Li-ion intercalation into the van der Waals (vdW) gap to
complete the 2H to 1T/1T′ phase transition1,16. This charge-transfer-limited reaction mechanism is further supported by electrochemical and electron microscopy studies, which suggest a
sequential process of lithium adsorption through initial charge transfer, followed by the phase transition and irreversible phase conversion at lower potentials17,18,19,20,21,22,23,24,25.
However, we still lack a fundamental real-time nanoscale picture of the 2H to 1T/1T′ phase transition. This hampers the use of phase engineering of TMDs in crucial aspects: (1) the current
reaction kinetics are extremely slow, requiring, for example, tens of hours for complete conversion of 2H-MoS2 to the 1T/1T′ phase; and (2) the use of pyrophoric _n_-BuLi poses a substantial
safety risk for any scale-up of these materials. Here, using in situ optical reflectance interferometric contrast microscopy (RICM), we uncover mechanistic details of the 2H to 1T/1T′ phase
transition with diffraction-limited resolution (about 200 nm). We discover a photoredox-activated reaction pathway that overcomes the otherwise slow charge-transfer-limited reaction
occurring under ‘dark’ conditions, allowing us to markedly speed up the phase transition and demonstrate a new photoredox phase patterning methodology. Finally, with the obtained insights,
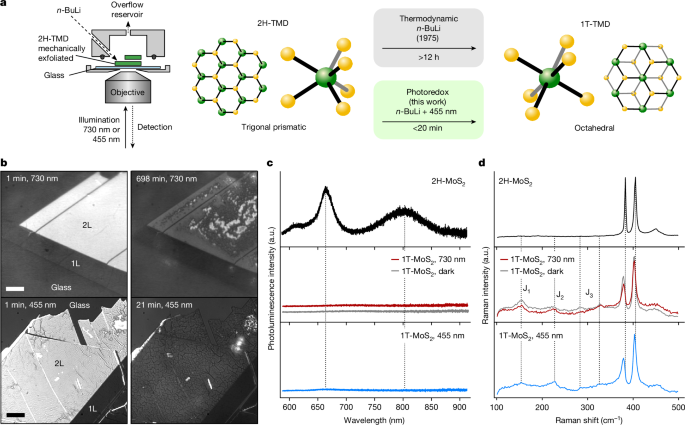
we can eliminate the use of pyrophoric _n_-BuLi in favour of non-pyrophoric polycyclic aromatic hydrocarbon lithiation systems. Figure 1a shows the experimental setup (left) used to monitor
in situ the chemically induced phase transition from the semiconducting 2H to the quasi-metallic 1T(1T/1T′) phase (right). Mechanically exfoliated 2H-TMD flakes were placed in an air-tight,
optically accessible cell that could be filled with _n_-BuLi using a syringe pump. The reaction was spatio-temporally resolved with an RICM using LED illumination at 730 nm and 455 nm.
Typical RICM images for mono- and bilayer MoS2 before and after the phase transition under both illumination conditions are shown in Fig. 1b. We note that the higher diffraction-limited
resolution at 455 nm shows a more detailed morphology compared with that at 730 nm (for more information, see Supplementary Information section 1). Independent of the illumination, at the
start of the reaction the bilayer (2L) appeared brightly reflective, whereas the monolayer (1L) was substantially darker with intensity values similar to that of the glass substrate. The
brightness reduces during the reaction and the images after 698 min under 730 nm illumination show a drastic reduction in the intensity, leaving behind a smooth surface at the edges of the
flake and a more rugged central region characterized by irregular brighter and darker spots. We propose that the darkening is associated with the 2H to 1T phase transition. Flake darkening
was also observed under 455 nm, but it took only 21 min, corresponding to a 33-fold acceleration of the reaction speed under 455 nm illumination. We confirmed that the darkened 2L regions
correspond to the 1T-MoS2 phase by steady-state photoluminescence, Raman and reflectance microscopy measurements. Before chemical lithiation, bilayer 2H-MoS2 exhibited photoluminescence at
around 660 nm (direct bandgap) and around 800 nm (indirect bandgap) alongside pronounced Raman peaks at approximately 385 cm−1 and 407 cm−1 (E2g and A1g modes, respectively; Fig. 1c,d, black
line). After the 2L fully darkened, we observed a loss of all photoluminescence emission, as well as red shifts of the E2g Raman peaks and the emergence of J-peaks in both illumination
conditions, indicating successful 1T formation (Fig. 1c,d; 730 nm (red) and 455 nm (blue))26. We verified that the same photoluminescence and Raman signatures are observed when exposing
2H-MoS2 to _n_-BuLi for 48 h under dark conditions (Fig. 1c,d, dark grey) and that the monolayer region is also successfully converted to 1T (refs. 1,26,27) (for more details, see
Supplementary Information sections 2 and 3). Moreover, reflectance measurements show the loss of the A- and B-exciton absorption peak in line with the formation of a 1T phase28,29 (for more
sample characterization details, see Supplementary Information section 4). These results confirm that the darkening of the flake observed in RICM corresponds to the phase transition from
2H-MoS2 to its 1T phase and can be sensitively and optically monitored in situ. Furthermore, using below-bandgap illumination at 730 nm enables us to capture the phase transition in MoS2 as
it would occur under nominally dark conditions (Extended Data Fig. 1). By contrast, the above-bandgap excitation at 455 nm coincides with the C-exciton absorption band of 2H-MoS2, suggesting
a photo-activated mechanism that markedly accelerates the phase transition30. We study the mechanistic origin of the phase transition under 730 nm illumination by analysing the RICM images
as a function of time after _n_-BuLi addition (Fig. 2a). After 74 min, the 2L edges become visibly darker, and by 147 min, a progression of a phase front at the 2L/1L terrace can be seen. A
similar phase front progression at the 2L/glass edge was reached after 220 min. Once the 1T phase nucleated, the 1T/2H phase boundary moved into the flake with a constant velocity of 0.1 nm
s–1, remaining sharp throughout. Interestingly, after 366 min, brighter and darker regions formed whenever two-phase boundaries of different orientations converged. We attribute these
regions to microscopic wrinkles arising from a lattice mismatch20,31. Similar phase frustration effects were previously observed for phase transitions occurring in lithium cobalt oxide32.
After the wrinkles formed for the first time, the surface morphology of the 1T phase was no longer smooth but instead stayed rugged with brighter and darker features emerging throughout the
remaining phase transition (698 min, see also Supplementary Video 1; for more details, see Supplementary Information section 1). To quantify the reaction dynamics at 730 nm, we performed a
histogram analysis of the 1 L and 2 L regions. As shown in Fig. 2b (left), the 1L exhibited a single-peaked distribution in the histogram map. This feature quickly reduced in intensity to
0.9 over 50 min with no changes to its width, indicating a homogeneous surface change during the initial reaction with _n_-BuLi. As the 1L cannot intercalate Li ions, this initial decay
suggests a facile electron donation to the surface. We note that the intensity at the glass/_n_-BuLi interface changes up to 15% over 12 h in this experiment, which accounts for the
long-term increase in reflection intensity (Supplementary Information section 1). Similarly, at the beginning of the reaction, the 2L (Fig. 2b, right) exhibited a single-peaked feature in
the histogram map that rapidly decayed to a value of 0.9 over 50 min—the same timescale observed for the 1L. To confirm that this reduction corresponds to a surface change of the 2L, we
carried out the photoluminescence measurements that showed that the vdW interaction between each layer is weakened within around 50 min (for more details, see Supplementary Information
section 7). As the width of the initial feature does not change during this time, we attribute this process to a homogeneous surface electron donation, as observed for the 1L. After 50 min,
the histogram peak at 0.9 reduces in occurrences and is converted into a lower intensity feature at an intensity of 0.7, which becomes prominent after about 300 min. This feature signifies
the transition of the 2H phase (bright) to the 1T phase (dark) at the edges of the 2L (compare with Fig. 2a). After around 400 min, a second peak emerges at a lower intensity (approximately
0.6), accompanied by a broadening of both lower intensity features, coinciding with the formation of a wrinkled 1T region at the centre of the 2L. To further illustrate the intrinsic
variability of the phase transition as observed at 730 nm, Fig. 2c shows the intensity profile over time at the 2L/1L terrace and 2L/glass edge (2LTerrace and 2LEdge, respectively). The
2LTerrace completed the phase transition in just 140 min, whereas the equidistant 2LEdge required 340 min. This discrepancy probably originates from different activation barriers along these
two interfaces, highlighting how our approach can be used to map out intercalation energy barriers in these materials measurements (for more details, see Supplementary Information section
6). Taken together, the first step of the phase transition in MoS2 is rapid surface electron donation from _n_-BuLi to the whole flake. In 1L-MoS2, this is sufficient to form the 1T phase.
In 2L-MoS2, Li-ion intercalation causes the 1T phase to form at the edges of the flake with a sharp phase boundary that moves with a constant velocity into the centre of the flake,
suggesting a charge-transfer limited reaction mechanism. Finally, once the two-phase boundaries of different orientations converge, a wrinkled 1T phase is formed. We repeated the same
analysis for the 455 nm illumination. As shown in Fig. 2d, after 5 min, we already observed the 2L edges darkening and forming a sharp phase boundary between the bright 2H and dark 1T
phases. After 13 min, however, this phase boundary was more diffuse and the centre of the flake appears noticeably darker. After 17 min, no clear phase boundaries could be identified, and
the flake appeared to darken homogeneously with no signs of wrinkle formation (Supplementary Video 2). Analysis of the histogram maps in Fig. 2e (left) for the 1L showed an identical, albeit
accelerated surface reaction compared with the 730 nm illumination. Again, we observed an initial homogeneous darkening of the whole 1L to an intensity of 0.9 in just 5 min, followed by no
further changes. The 2L (Fig. 2e, right) mimicked this intensity reduction in the first 5 min after the addition of _n_-BuLi, confirming that the 455 nm illumination accelerates the surface
electron donation step of the reaction. After about 5 min, the initial distribution reduces in occurrences and shifts in intensity to form a new distribution at 0.4 within 10 min, in a
markedly different behaviour than what we observed at 730 nm. Mechanistically, these observations suggest a photoredox-activated mechanism. Initially, photo-excitation into the C-exciton of
MoS2 at 455 nm must lower the activation barrier for electron donation, to explain the accelerated surface darkening33. We propose that C-exciton excitation causes efficient surface-hole
generation, thereby remarkably increasing the electron transfer rate (as seen by the change time of the initial darkening around 100 min at 730 nm compared with about 5 min at 455 nm) in
line with previous transient absorption reports34. The associated opening of the vdW gap then enables rapid Li-ion intercalation from the edges of the flake. Owing to the continued
photo-induced hole formation, this process is no longer strictly charge-transfer limited, causing the phase boundary to broaden and to accelerate the overall reaction speed. To further
support this mechanistic picture, we carried out power-dependent measurements on 2L-MoS2, varying the illumination fluence at 455 nm between 20 mW cm−2, 110 mW cm−2 and 510 mW cm−2. Figure
2f shows the intensity curves for regions located 1 µm away from the 2L/glass edge. We find that the photoredox-activated phase transition depends on power. Lower fluences (20 mW cm−2; Fig.
2f, light blue) approach the shape of the intensity curves observed under 730 nm illumination (Supplementary Video 3), indicative of a charge-transfer-limited reaction composed of an initial
surface change followed by a period of constant intensity before the phase boundary traverses over the region. By contrast, higher fluences (510 mW cm−2; Fig. 2f, purple), lack clear
features of a phase boundary and simply reduce in intensity to a constant value in as little as 8 min (about 90-fold acceleration), demonstrating that the process is deviating from a strict
charge-transfer-limited reaction profile. A particularly promising application of the discovered photoredox-driven reaction pathway lies in the possibility of inscribing arbitrary phase
patterns with diffraction-limited edge resolution into few-layer TMDs. Figure 3a shows the experimental setup used to create a well-defined T-shaped pattern of the 1T phase into 1L and 2L
2H-MoS2. Using 455 nm illumination at a power density of 510 mW cm−2, we were able to inscribe the desired phase pattern into 1L-MoS2 in 30 s and into 2 L MoS2 in 13 min (Fig. 3a, top right)
and achieved a channel width of 3.3 µm with a deconvolved 1T/2H edge sharpness of _σ_ = 161 nm (Fig. 3a, bottom right). Photoluminescence and Raman imaging confirmed the successful phase
transition (Extended Data Fig. 2 and Supplementary Fig. 9). It is worth noting that these power densities are about six orders of magnitude lower than conventional laser-writing approaches
(for more details, see Supplementary Information section 8). To demonstrate the electronic quality of the photoredox-patterned phase, we used our approach to inscribe a 1T/2H/1T phase
junction into 1L 2H-MoS2. Using a power density of 1 W cm−2 enabled us to manufacture this junction in 10 s, without affecting the material. We then deposited gold electrodes onto the 1T
phase area to fabricate a simple phase-engineered photodetector. As shown in Fig. 3b, the phase-engineered device exhibited enhanced photocurrent density to devices made with 2H-MoS2,
showing responsivity of 85 A W−1 compared with 10 A W−1 (ref. 35) (for more details, see Supplementary Information section 9). Using Fowler–Nordheim analysis, we verified that this enhanced
photoresponsivity arises by switching from a Schottky contact behaviour to an ohmic-like contact behaviour (Fig. 3b, bottom), which enhances the transport properties3,36 (Supplementary
Information section 10). Furthermore, it demonstrates that the diffraction-limited edge resolution does not notably impede electron mobility at the phase edges35. Next, we explored this
photoredox reaction across different TMDs, such as WS2, MoSe2 and WSe2. Here we will focus on the comparison of MoS2 and WS2, but a full discussion of all samples is provided in
Supplementary Information sections 2, 12–14. Figure 4a compares the spatio-temporal changes of MoS2 (top, blue) and WS2 (bottom, orange) in the low-power regime on the addition of _n_-BuLi
at 455 nm illumination. As described previously, the 2L-MoS2 shows surface darkening together with phase boundary propagation, whereas the 1L-MoS2 reduces only in intensity. Conversely, the
1L and 2L WS2 proceed by a homogeneous surface darkening mechanism with no visible phase boundaries at any stage during the reaction (Supplementary Video 4). To further analyse this
difference, Fig. 4b shows the intensity curves for comparable 1L and 2L regions of the respective TMD. Although the 1L- and 2L-MoS2 exhibit a simultaneous, rapid surface darkening followed
by a decrease in intensity in 2L-MoS2 because of the phase boundary motion, this behaviour is absent in WS2. The 1L-WS2 shows a rapid intensity decay within about 100 min, which is not
matched by any dynamic feature observed in the 2L-WS2. Instead, the 2L-WS2 decays initially to an intermediate intensity not observed in the 1L-WS2 and then continues to decay slowly over
the next 300 min. These results highlight that WS2, in contrast to MoS2, proceeds exclusively by a surface-driven reaction mechanism that seems different between 1L- and 2L-WS2. We carried
our Raman and photoluminescence measurements before and after the reaction of WS2 with _n_-BuLi (Supplementary Information sections 11 and 12). 2H-WS2 showed the expected photoluminescence
and Raman peaks. However, after exposure to 455 nm light in the presence of _n_-BuLi, the Raman spectrum indicated a 2H phase with a high signal-to-noise ratio, and no photoluminescence
could be observed. On the basis of these results, we conclude that the chemical lithiation of WS2 under 455 nm photo-excitation does not produce the desired 1T phase, but instead leads to
phase conversion to tungsten and lithium sulfides37. We further attempted to resolve the phase transition in WS2 under below-band-gap illumination at 730 nm; however, over the time frame of
48 h, no changes to the flakes could be observed, suggesting less favourable energetics for the chemical lithiation by _n_-BuLi, as compared with MoS2. To rationalize these findings, we
fabricated electrochemical devices based on (multilayer) 2H phase TMD powders and measured the galvanostatic discharge–charge response of MoS2 and WS2 as shown in Fig. 4c (for more details,
see Supplementary Information section 13). MoS2 (blue) exhibited two plateaus during the galvanostatic discharge process at 1.1 V, corresponding to the reversible phase transition from 2H to
1T, and another at 0.57 V, assigned to conversion by irreversible decomposition17,18. As the redox potential of _n_-BuLi is 1 V (refs. 1,38), the charge-transfer-limited phase transition in
MoS2 proceeds by a small driving force of about 0.1 V. The slow reaction speed is, therefore, because of a reasonably large activation energy for electron donation. Illumination with 455 nm
light increases the (surface) hole concentration and thereby reduces the activation barrier for electron donation, resulting in an accelerated reaction rate. Importantly, photo-excitation
of MoS2 does not provide enough driving force to activate the conversion reaction at 0.57 V. This picture changes for WS2, for which the phase transition and conversion potential are close
together and located between 0.75 V and 0.8 V (Fig. 4c, orange). Chemical lithiation is, therefore, thermodynamically unfavourable, resulting in an extremely slow reaction with low yield
after more than a week of _n_-BuLi soaking at room temperature (for more details, see Supplementary Information section 11). As for MoS2, illumination at 455 nm reduces the activation
barrier for electron transfer. However, owing to the close proximity of the phase transition and conversion, continuous photo-excitation cannot selectively stop at the 1T phase for WS2.
Instead, the conversion reaction is also photo-activated and occurs shortly after the 1T phase has formed. Examination of the MoSe2 and WSe2 corroborates this picture, in which MoSe2 could
be successfully transitioned to the 1T phase, and WSe2 showed conversion behaviour (Supplementary Information sections 12–14). Taken together, we propose the energy level scheme presented in
Fig. 4d to explain our findings. For MoX2 (X = S, Se), the thermodynamic landscape puts the reversible lithiated 1T phase into a local minimum with respect to its 2H phase and decomposition
products39,40,41,42 (for more details on reversibility, see Supplementary Information section 15). Although the activation barrier for the 2H–1 T phase transition is large, photo-excitation
at 455 nm effectively reduces this barrier, leading to fast electron donation and Li-ion intercalation. In WX2, the initial electron donation reaction is thermodynamically unfavourable and
can be initiated only under 455 nm illumination. However, as the energy difference between 1T and decomposition products is very small, continuous illumination pushes the system too far,
preventing controlled 1T formation, and ultimately resulting in conversion. Finally, we sought to improve the sustainability of TMD phase engineering by removing the toxic and pyrophoric
_n_-BuLi from the reaction. By considering the requirements of the reaction on the electrochemical potential, the chemical redox potential and illumination conditions, we developed several
safe organo-lithiation agents based on polycyclic aromatic hydrocarbons (PAHs) and lithium metal in tetrahydrofuran solvent. These chemicals furnish a solution of pi-radical anions
counterbalanced by Li cations with sufficient driving force for electron donation to TMDs, offering a route towards replacing _n_-BuLi. Figure 5a presents the Raman spectra of (multilayer)
MoS2 treated with different PAH-Li agents. Anthracene-Li (AnLi, green, 0.91–1.03 V) and pyrene-Li (purple, 0.73–0.93 V), fall into the acceptable redox potential range between 0.57 V and 1.1
V and, therefore, successfully convert 2H-MoS2 to its 1T phase, as evidenced by their close spectral match to _n_-BuLi (blue). By contrast, perylene-Li (grey, 1.19–1.35 V) did not react
with the 2H phase because of insufficient redox potential, whereas naphthalene-Li (orange, 0.26–0.46 V) resulted in undesirable decomposition because of a high driving force43. To explore
the effect of changing the redox reagent on the photoredox-driven phase transition dynamics, we investigated exfoliated, thick MoS2 flakes on glass and added AnLi. Figure 5b shows an ex situ
optical image of a thick flake under ‘dark’ conditions after 10 min of reaction time, showing a partial phase transformation. Noticeably, the extracted phase front speed of about 6 nm s−1
with AnLi in a thick flake was remarkedly faster than with _n_-BuLi in a bilayer (0.08 nm s−1), showcasing the effect of the higher driving force provided by AnLi. On above-gap illumination
(Fig. 5c; 10 s illumination at 130 mW cm−2), the reaction is yet again substantially accelerated with an estimated phase front speed of up to 5 μm s−1, about six orders of magnitude faster
than under dark conditions for a bilayer. Taken together, our results show that even thick TMD flakes can be readily transformed by combining the effect of redox potential matching with
above-gap illumination. Moreover, the AnLi system also worked for MoSe2 and WS2 by accelerating the lithiation reaction (Supplementary Information sections 16 and 17). In summary, our study
provides mechanistic insights into the 2H to 1T phase transition in few-layer TMDs by real-time visualization of the chemical lithiation reaction. We develop a photo-activated reaction
pathway that accelerates the phase transition reaction, allowing for rapid phase-pattering of MoS2. Finally, we use these insights to replace pyrophoric _n_-BuLi from the reaction with safe
organolithiation agents (PAH-Li). These reagents make the process safer and greener and also reduce reaction times by six orders of magnitude compared with conventional _n_-BuLi treatment.
METHODS MATERIALS MoS2, MoSe2, WS2 and WSe2 (HQ graphene) were exfoliated on a microscopic cover glass substrate (thickness = 170 ± 5 μm) by mechanical exfoliation using a
polydimethylsiloxane (PDMS) tape. CELL DESIGN AND CHEMICAL LITHIATION PROCESS The air-tight cell for this study was designed in two parts: as a chemical reservoir and a base plate with an
optical window. The reservoir had a volume of about 2 ml, which was enough to monitor slow reaction dynamics for a few days avoiding any issues from evaporation. The two ports of the
reservoir part were assembled with tubes, which were connected to syringes. The first syringe was prepared by filling approximately 3 ml of _n_-BuLi (1.6 M in hexanes, Sigma-Aldrich), and
the second empty syringe was prepared as a container for exhaust air (nitrogen) when injecting the chemical inside the cell. The glass substrate with TMD flake, two parts of the cell with
two syringes and an O-ring (diameter 1.8 mm, EL-CELL) were assembled inside the nitrogen glovebox. The cell was placed on a custom-built RICM. After locating the desired flake, we injected
_n_-BuLi for around 1 min, resulting in partial filling of syringe 2. The top side of the exfoliated flake is in contact with _n_-BuLi. The bottom side contacts the glass substrate through
which the flake is observed during the RICM measurements. The _n_-BuLi level in both syringes was carefully monitored to ensure the flake remained fully immersed during the experiment. We
note that it has been reported that both distorted 1T′ phase and 1T phase coexist2,25,28,29,42,44. However, the two phases are indistinguishable at the optical resolution, and we will denote
the 1T′/1T phase as 1T throughout this study. Lithiation of 2H-TMDs forms 1T-Li_x_TMDs, which are stable in air2,25. To remove the excess butyllithium and other organic by-products44, we
first washed the sample using an excess amount of _n_-hexane. The washing step was done inside the cell by injecting the _n_-hexane using a syringe to avoid air exposure and minimize the
chance of possible oxidation of surfaces. After steady-state optical characterization (photoluminescence and Raman), we rinsed the sample again using an excess amount of distilled water
(DI), acetone and isopropyl alcohol (IPA) to remove all lithium (1T-TMDs). STEADY-STATE OPTICAL CHARACTERIZATION The microscope steady-state photoluminescence and Raman measurements were
carried out under ambient conditions using a Renishaw inVia Raman microscope using the excitation laser sources of 532 nm. Before all measurements, the spectrometer was calibrated using a
silicon reference sample for correcting the instrument responses. The laser was set to a power of 0.05% (<0.5 µW) focused on the designated point of the flake using a 100× long working
distance objective (numerical aperture = 0.85), and the emission was collected in streamline mode and dispersed by 1,800 l mm−1 grating. Reflection microscopy was performed with a
custom-built microscope. A variable wavelength excitation was provided by a pulsed super-continuum white light source (Fianium Whitelaser) coupled to a monochromator (Bentham TMC 300). The
sample was imaged, at each wavelength, in reflection geometry onto an EMCCD camera (Photometrics QuantEM 512SC) with a 60× oil immersion objective (UPLFLN60XOI, Olympus). The microscopic
photoluminescence image was taken on the same setup, using 532 nm excitation and imaging onto the EMCCD camera with a 660-nm bandpass filter (Thorlabs). IN SITU RICM MEASUREMENT METHODS RICM
measurements were carried out using a custom-built microscope setup reported in detail previously32,44. Furthermore, the microscope was equipped with a 455-nm LED (M455L4, Thorlabs) coupled
into a single-mode fibre. The output of the fibre was collimated with a condenser lens and imaged into the back focal plane of the objective (UPLXAPO100XO, Olympus) to achieve wide-field
illumination. The 730 nm illumination was carried out by inserting a 730-nm bandpass filter (FB730-10, Thorlabs) into the illumination path of a SOLIS-740C (Thorlabs). The magnification of
the microscope was 167× and confirmed with a resolution target. A 2 × 2 software-based pixel binning, leading to a pixel pitch of approximately 70 nm per pixel, and, depending on the
experiment, 10–30 frame binning was applied to improve the image quality. The effective acquisition frame rates varied between 0.05 Hz (730 nm illumination) and 3 Hz (455 nm illumination,
510 mW cm−2) ensuring sufficient time resolution to monitor the phase transformation dynamics. Throughout the experiment, the sample was kept in focus using a hardware-based autofocus
routine32. No images were recorded during the injection of _n_-BuLi because of the large pressure fluctuations and associated focus changes of the sample. For the patterning experiments
(Fig. 3a), a shadow mask was placed into the illumination path of the microscope such that it was imaged onto the sample. The flake was carefully positioned with respect to the mask in the
absence of _n_-BuLi. Subsequently, the illumination was turned off and _n_-BuLi was injected as before. After 1 min, the syringe pump was turned off and the 455 nm illumination was switched
on to initiate the photo-driven phase transition. The light source was turned off once the intensity of the flake was reduced to the 1T phase value, and the sample was washed immediately
afterwards. ANALYSIS Recorded image stacks were corrected for sample drift as previously described32. No other post-processing was applied. For the histogram analysis presented in Fig. 2,
the image stack was masked to include only 1L or 2L regions. The first image in each stack served as a reference frame to compute an average intensity value for each masked region. For each
image in the stack, each pixel value in the masked image was subsequently divided by this reference intensity value to generate an intensity distribution centred at 1 (the mean intensity of
the first image is computed and used to normalize all subsequent intensity histograms). For each image in the stack, a histogram with 120 equally spaced bins ranging from intensity values of
0.1–1.2 was then computed, yielding the histogram plots shown in Fig. 2. Generally, no normalization for the illumination intensity was required because of the high stability of the LED
light sources (<5% power drop over 5 days continuous illumination). The intensity histogram is in the first instance a convolution of the actual intensity value and the noise
characteristics of the camera. We verified shot-noise limited performance and can conclude that the noise broadening is well below 1%, causing no notable broadening of the normalized
histograms. During long-term experiments (>1 h), necessary to capture the phase transition dynamics under 730 nm illumination, we observed noticeable changes to the intensity at the
glass/_n_-BuLi interface of up to 15% over 12 h. These changes match the observed long-term increase observed in Fig. 2b,c and must therefore be correlated. Given that our light sources are
stable, the origin of this behaviour must be related to either a change in the refractive index of the _n_-BuLi solution or an increased out-of-focus scattering mechanism. Apart from this
slow intensity increase, the long-term imaging at 730 nm shows several landing events of several cluster-like particles. These particles are probably formed in solution reactions involving
the highly reactive _n_-BuLi. We, therefore, believe that the long-term increase in reflection intensity is most likely associated with out-of-focus scattering, which our wide-field
microscope will be sensitive to. ELECTROCHEMICAL MEASUREMENT The electrochemical performance of bulk transition metal dichalcogenides as working electrodes was conducted in a coin 2032-type
cell. The working electrodes were fabricated by casting a slurry of 80% active material, 10 wt% conducting agents (super-P) and 10 wt% binder (polyvinylidene fluoride) in
_N_-methyl-2-pyrrolidinone on copper foil. The coated electrodes were then dried at 50 °C in a vacuum overnight. The test cells were assembled in an argon-filled glove box (<0.5 ppm of
oxygen and water) with lithium chips cut to a round shape (diameter 16 mm) as a counter electrode, a porous polypropylene separator (Celgard 2400) and 1 M LiPF6 in ethylene carbonate/diethyl
carbonate (v/v) by adding 5 wt% fluoroethylene carbonate as the electrolyte. The mass loading of the active material was approximately 1–1.5 mg cm−2. After ageing at room temperature for 20
h, the cells were ready for detailed electrochemical tests. Galvanostatic charge–discharge tests were performed on a LAND Battery Tester at the current density rate of 0.05 C according to
the theoretical capacity of each active material within the voltage range of 0.01–2.8 V. Cyclic voltammetry at a rate of 0.1 mV s−1 was conducted on the potentiostat instrument of Biologic
in the potential range of 0.01–2.80 V versus Li+/Li. PHOTODETECTOR FABRICATION AND MEASUREMENT The photodetector was fabricated by metal deposition using a shadow mask. A gold pad (50 nm)
was deposited selectively on the 1T/1T′ region using electron-beam evaporation (PVD 200 Pro, Kurt J. Lesker). Photodetector measurement was conducted by illuminating a monochrome laser
(MCLS1, Thorlabs) through a customized lens (Mitutoyo) and recording the photocurrent using a semiconductor analyser (Keithley 4200). DATA AVAILABILITY The data underlying all figures in the
main text are publicly available from the University of Cambridge repository (https://doi.org/10.17863/CAM.110010). CODE AVAILABILITY All codes used in this work are available from the
corresponding authors upon reasonable request. REFERENCES * Voiry, D., Mohite, A. & Chhowalla, M. Phase engineering of transition metal dichalcogenides. _Chem. Soc. Rev._ 44, 2702–2712
(2015). Article CAS PubMed Google Scholar * Yin, X. et al. Recent developments in 2D transition metal dichalcogenides: phase transition and applications of the (quasi-)metallic phases.
_Chem. Soc. Rev._ 50, 10087–10115 (2021). Article CAS PubMed Google Scholar * Kappera, R. et al. Phase-engineered low-resistance contacts for ultrathin MoS2 transistors. _Nat. Mater._
13, 1128–1134 (2014). Article ADS CAS PubMed Google Scholar * Yang, Y. et al. Performance improvement in p-Type WS2 field-effect transistors with 1T phase contacts. _Nanotechnology_ 32,
34 (2021). Article Google Scholar * Gupta, U. et al. Characterization of few-layer 1T-MoSe2 and its superior performance in the visible-light induced hydrogen evolution reaction. _APL
Mater._ 2, 092802 (2014). Article ADS Google Scholar * Voiry, D. et al. Conducting MoS2 nanosheets as catalysts for hydrogen evolution reaction. _Nano Lett._ 13, 6222–6227 (2013). Article
ADS CAS PubMed Google Scholar * Voiry, D. et al. The role of electronic coupling between substrate and 2D MoS2 nanosheets in electrocatalytic production of hydrogen. _Nat. Mater._ 15,
1003–1009 (2016). Article ADS CAS PubMed Google Scholar * Han, A. et al. One-step synthesis of single-site vanadium substitution in 1T-WS2 monolayers for enhanced hydrogen evolution
catalysis. _Nat. Commun._ 12, 709 (2021). Article ADS CAS PubMed PubMed Central Google Scholar * Voiry, D. et al. Enhanced catalytic activity in strained chemically exfoliated WS2
nanosheets for hydrogen evolution. _Nat. Mater._ 12, 850–855 (2013). Article ADS CAS PubMed Google Scholar * Fan, X. et al. Fast and efficient preparation of exfoliated 2H MoS2
nanosheets by sonication-assisted lithium intercalation and infrared laser-induced 1T to 2H phase reversion. _Nano Lett._ 15, 5956–5960 (2015). Article ADS CAS PubMed Google Scholar *
Eda, G. et al. Photoluminescence from chemically exfoliated MoS2. _Nano Lett._ 11, 5111–5116 (2011). Article ADS CAS PubMed Google Scholar * Joensen, P., Frindt, R. F. & Morrison,
S. R. Single-layer MoS2. _Mat. Res. Bull._ 21, 457–461 (1986). Article CAS Google Scholar * Voiry, D. et al. Covalent functionalization of monolayered transition metal dichalcogenides by
phase engineering. _Nat. Chem._ 7, 45–49 (2015). Article CAS PubMed Google Scholar * Zhang, X. et al. Two-dimensional MoS2-enabled flexible rectenna for Wi-Fi-band wireless energy
harvesting. _Nature_ 566, 368–372 (2019). Article ADS PubMed Google Scholar * Li, Z. et al. Lithiated metallic molybdenum disulfide nanosheets for high-performance lithium–sulfur
batteries. _Nat. Energy_ 8, 84–93 (2023). Article ADS CAS Google Scholar * Dines, M. B. Lithium intercalation via n-butyllithium of the layered transition metal dichalcogenides. _Mat.
Res. Bull._ 10, 287–291 (1975). Article CAS Google Scholar * Wan, J. et al. In situ investigations of Li-MoS2 with planar batteries. _Adv. Energy Mater._ 5, 1401742 (2015). Article
Google Scholar * Stephenson, T., Li, Z., Olsen, B. & Mitlin, D. Lithium ion battery applications of molybdenum disulfide (MoS2) nanocomposites. _Energy Environ. Sci._ 7, 209–231 (2014).
Article CAS Google Scholar * Wang, H. et al. Electrochemical tuning of vertically aligned MoS2 nanofilms and its application in improving hydrogen evolution reaction. _Proc. Natl Acad.
Sci. USA_ 110, 19701–19706 (2013). Article ADS CAS PubMed PubMed Central Google Scholar * Lin, Y. C., Dumcenco, D. O., Huang, Y. S. & Suenaga, K. Atomic mechanism of the
semiconducting-to-metallic phase transition in single-layered MoS2. _Nat. Nanotechnol._ 9, 391–396 (2014). Article ADS CAS PubMed Google Scholar * Ghosh, C. et al. Phase evolution and
structural modulation during in situ lithiation of MoS2, WS2 and graphite in TEM. _Sci. Rep._ 11, 9014 (2021). Article ADS CAS PubMed PubMed Central Google Scholar * Wang, L., Xu, Z.,
Wang, W. & Bai, X. Atomic mechanism of dynamic electrochemical lithiation processes of MoS2 nanosheets. _J. Am. Chem. Soc._ 136, 6693–6697 (2014). Article CAS PubMed Google Scholar *
Tai, K. L. et al. Observing phase transformation in CVD-grown MoS2 _via_ atomic resolution TEM. _Chem. Commun._ 54, 9941–9944 (2018). Article CAS Google Scholar * Azhagurajan, M.,
Kajita, T., Itoh, T., Kim, Y.-G. & Itaya, K. In situ visualization of lithium ion intercalation into MoS2 single crystals using differential optical microscopy with atomic layer
resolution. _J. Am. Chem. Soc._ 138, 3355–3361 (2016). Article CAS PubMed Google Scholar * Duerloo, K.-A. N., Li, Y. & Reed, E. J. Structural phase transitions in two-dimensional Mo-
and W-dichalcogenide monolayers. _Nat. Commun._ 5, 4214 (2014). Article ADS CAS PubMed Google Scholar * Calandra, M. Chemically exfoliated single-layer MoS2: stability, lattice
dynamics, and catalytic adsorption from first principles. _Phys. Rev. B_ 88, 245428 (2013). Article ADS Google Scholar * Mak, K. F., Lee, C., Hone, J., Shan, J. & Heinz, T. F.
Atomically thin MoS2: a new direct-gap semiconductor. _Phys. Rev. Lett._ 105, 136805 (2010). Article ADS PubMed Google Scholar * Xiong, F. et al. Li Intercalation in MoS2: in situ
observation of its dynamics and tuning optical and electrical properties. _Nano Lett._ 15, 6777–6784 (2015). Article ADS CAS PubMed Google Scholar * Guo, Y. et al. Probing the dynamics
of the metallic-to-semiconducting structural phase transformation in MoS2 crystals. _Nano Lett._ 15, 5081–5088 (2015). Article ADS CAS PubMed Google Scholar * Castellanos-Gomez, A.,
Quereda, J., van der Meulen, H. P., Agraït, N. & Rubio-Bollinger, G. Spatially resolved optical absorption spectroscopy of single- and few-layer MoS2 by hyperspectral imaging.
_Nanotechnology_ 27, 115705 (2016). Article ADS PubMed Google Scholar * Eda, G. et al. Coherent atomic and electronic heterostructures of single-layer MoS2. _ACS Nano_ 6, 7311–7317
(2012). Article CAS PubMed Google Scholar * Merryweather, A. J., Schnedermann, C., Jacquet, Q., Grey, C. P. & Rao, A. Operando optical tracking of single-particle ion dynamics in
batteries. _Nature_ 594, 522–528 (2021). Article ADS CAS PubMed Google Scholar * Wang, L. et al. Slow cooling and efficient extraction of C-exciton hot carriers in MoS2 monolayer. _Nat.
Commun._ 8, 13906 (2017). Article ADS CAS PubMed PubMed Central Google Scholar * Li, Y. et al. Slow cooling of high-energy C excitons is limited by intervalley-transfer in monolayer
MoS2. _Laser Photon. Rev._ 13, 1–7 (2019). Article Google Scholar * Taffelli, A., Dirè, S., Quaranta, A. & Pancheri, L. MoS2 based photodetectors: a review. _Sensors_ 21, 2758 (2021).
Article ADS CAS PubMed PubMed Central Google Scholar * Kappera, R. et al. Metallic 1T phase source/drain electrodes for field effect transistors from chemical vapor deposited MoS2.
_APL Mater._ 2, 092516 (2014). Article ADS Google Scholar * Xu, Y., Kang, J., Hersam, M. C., Wu, J. & Dravid, V. P. Lithium electrochemistry of WS2 nanoflakes studied by in-situ TEM.
_Microsc. Microanal._ 24, 1860–1861 (2018). Article ADS Google Scholar * Golden, J. H., DiSalvo, F. J. & Fréchet, J. M. J. Room-Temperature Synthesis of (LiMo3Se3)n and the
Determination of the Relative Reduction Potential of tert-Butyllithium. _Chem. Mater._ 6, 844–849 (1994). Article CAS Google Scholar * Shu, H. et al. The capacity fading mechanism and
improvement of cycling stability in MoS2-based anode materials for lithium-ion batteries. _Nanoscale_ 8, 2918–2926 (2016). Article ADS CAS PubMed Google Scholar * Pandey, M., Bothra, P.
& Pati, S. K. Phase transition of MoS2 bilayer structures. _J. Phys. Chem. C_ 120, 3776–3780 (2016). Article CAS Google Scholar * Yazdani, S. et al. Heterointerface effects on
lithium-induced phase transitions in intercalated MoS2. _ACS Appl. Mater. Interfaces_ 13, 10603–10611 (2021). Article CAS PubMed Google Scholar * Xia, J. et al. Phase evolution of
lithium intercalation dynamics in 2H-MoS2. _Nanoscale_ 9, 7533–7540 (2017). Article CAS PubMed Google Scholar * Zhu, X. et al. Exfoliation of MoS2 nanosheets enabled by a
redox-potential-matched chemical lithiation reaction. _Nano Lett._ 22, 2956–2963 (2022). Article ADS CAS PubMed Google Scholar * Merryweather, A. J. et al. Operando monitoring of
single-particle kinetic state-of-charge heterogeneities and cracking in high-rate Li-ion anodes. _Nat. Mater._ 21, 1306–1313 (2022). Article ADS CAS PubMed Google Scholar Download
references ACKNOWLEDGEMENTS We thank P. Knight and the members of the workshop at the Department of Material Science and Metallurgy at the University of Cambridge for their technical support
for experimental design and cell fabrication. This project received funding from the European Research Council under the Horizon 2020 research and innovation programme of the European Union
(grant agreement no. 758826 (SOLARX) to A.R.). This work was supported by the Engineering and Physical Sciences Research Council (grant EP/W017091/1). E.S. received funding from the UKRI
postdoctoral individual fellowship (grant reference no. EP/Y026659/1). A.R., C.S. and J.L. acknowledge support from the Faraday Institution Degradation Project. J.-I.L., Y.W. and M.C.
acknowledge support from the Faraday Institution LiSTAR programme and characterization project (EP/S003053/1, FIRG014 and FIRG012), the NEXGENNA programme (FIRG018), the Royal Society
Wolfson Merit Award (WRM\FT\180009), and the European Research Council (ERC) Advanced Grant under the Horizon 2020 research and innovation programme of the European Union (grant agreement
no. GA 101019828-2D-LOTTO). This work was funded by the UKRI. For open access, the author has applied a Creative Commons Attribution (CC BY) licence to any Author Accepted Manuscript version
arising. AUTHOR INFORMATION AUTHORS AND AFFILIATIONS * Cavendish Laboratory, University of Cambridge, Cambridge, UK Juhwan Lim, Nicolas Gauriot, Ebin Sebastian, Christoph Schnedermann &
Akshay Rao * Department of Materials Science and Metallurgy, University of Cambridge, Cambridge, UK Juhwan Lim, Jung-In Lee, Ye Wang & Manish Chhowalla Authors * Juhwan Lim View author
publications You can also search for this author inPubMed Google Scholar * Jung-In Lee View author publications You can also search for this author inPubMed Google Scholar * Ye Wang View
author publications You can also search for this author inPubMed Google Scholar * Nicolas Gauriot View author publications You can also search for this author inPubMed Google Scholar * Ebin
Sebastian View author publications You can also search for this author inPubMed Google Scholar * Manish Chhowalla View author publications You can also search for this author inPubMed Google
Scholar * Christoph Schnedermann View author publications You can also search for this author inPubMed Google Scholar * Akshay Rao View author publications You can also search for this
author inPubMed Google Scholar CONTRIBUTIONS A.R. conceived the project. C.S. and J.L. developed the project, designed and built the experiments and performed the RICM measurements,
including the above-gap photoredox phase engineering. C.S. analysed the RICM data. J.L. and N.G. performed the steady-state optical characterization and photodetector fabrication. Y.W. and
J.L. conducted the photodetector measurements. Y.W. performed the Fowler–Nordheim analysis. J.-I.L. performed the electrochemical measurement and analysis. J.L., C.S. and E.S. synthesized
the PAH-Li system. M.C. and A.R. supervised the work. CORRESPONDING AUTHORS Correspondence to Christoph Schnedermann or Akshay Rao. ETHICS DECLARATIONS COMPETING INTERESTS J.L., C.S. and
A.R. have filed a patent application based on some aspects of this work. PEER REVIEW PEER REVIEW INFORMATION _Nature_ thanks the anonymous reviewers for their contribution to the peer review
of this work. ADDITIONAL INFORMATION PUBLISHER’S NOTE Springer Nature remains neutral with regard to jurisdictional claims in published maps and institutional affiliations. EXTENDED DATA
FIGURES AND TABLES EXTENDED DATA FIG. 1 CHEMICAL PHASE TRANSITION SPEED WITH RESPECT TO THE ILLUMINATION WAVELENGTH AND POWER, EVALUATED BY WAVEFRONT VELOCITY OF BILAYER. The wavefront
velocity of each illumination follows left y-axis (nm/s) and black line is optical absorbance (right y-axis) (more information in Supplementary Information 5). EXTENDED DATA FIG. 2 PL
IMAGING OF PHOTO-REDOX PHASE PATTERNED MOS2. MoS2 flake in Fig. 4a, Scale bar, 5 μm. SUPPLEMENTARY INFORMATION SUPPLEMENTARY INFORMATION PEER REVIEW FILE SUPPLEMENTARY VIDEO 1 In situ RICM
measurement for chemical phase transition of MoS2, 780 nm illumination. Scale bar, 5 μm. SUPPLEMENTARY VIDEO 2 In situ RICM measurement for chemical phase transition of MoS2, 455nm
illumination. Middle power of 110 mW cm-2. Scale bar, 5 μm. SUPPLEMENTARY VIDEO 3 In situ RICM measurement for chemical phase transition of MoS2, 455 nm illumination. Low power of 20 mW
cm-2. Scale bar, 5 μm. SUPPLEMENTARY VIDEO 4 In situ RICM measurement for chemical phase transition of WS2, 455 nm illumination. Scale bar, 5 μm. RIGHTS AND PERMISSIONS OPEN ACCESS This
article is licensed under a Creative Commons Attribution 4.0 International License, which permits use, sharing, adaptation, distribution and reproduction in any medium or format, as long as
you give appropriate credit to the original author(s) and the source, provide a link to the Creative Commons licence, and indicate if changes were made. The images or other third party
material in this article are included in the article’s Creative Commons licence, unless indicated otherwise in a credit line to the material. If material is not included in the article’s
Creative Commons licence and your intended use is not permitted by statutory regulation or exceeds the permitted use, you will need to obtain permission directly from the copyright holder.
To view a copy of this licence, visit http://creativecommons.org/licenses/by/4.0/. Reprints and permissions ABOUT THIS ARTICLE CITE THIS ARTICLE Lim, J., Lee, JI., Wang, Y. _et al._
Photoredox phase engineering of transition metal dichalcogenides. _Nature_ 633, 83–89 (2024). https://doi.org/10.1038/s41586-024-07872-5 Download citation * Received: 16 May 2023 * Accepted:
24 July 2024 * Published: 28 August 2024 * Issue Date: 05 September 2024 * DOI: https://doi.org/10.1038/s41586-024-07872-5 SHARE THIS ARTICLE Anyone you share the following link with will
be able to read this content: Get shareable link Sorry, a shareable link is not currently available for this article. Copy to clipboard Provided by the Springer Nature SharedIt
content-sharing initiative