- Select a language for the TTS:
- UK English Female
- UK English Male
- US English Female
- US English Male
- Australian Female
- Australian Male
- Language selected: (auto detect) - EN
Play all audios:
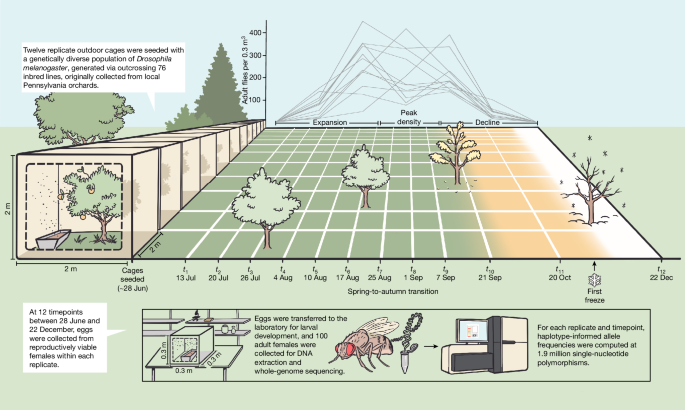
ABSTRACT Temporally fluctuating environmental conditions are a ubiquitous feature of natural habitats. Yet, how finely natural populations adaptively track fluctuating selection pressures
via shifts in standing genetic variation is unknown1,2. Here we generated genome-wide allele frequency data every 1–2 generations from a genetically diverse population of _Drosophila
melanogaster_ in extensively replicated field mesocosms from late June to mid-December (a period of approximately 12 total generations). Adaptation throughout the fundamental ecological
phases of population expansion, peak density and collapse was underpinned by extremely rapid, parallel changes in genomic variation across replicates. Yet, the dominant direction of
selection fluctuated repeatedly, even within each of these ecological phases. Comparing patterns of change in allele frequency to an independent dataset procured from the same experimental
system demonstrated that the targets of selection are predictable across years. In concert, our results reveal a fitness relevance of standing variation that is likely to be masked by
inference approaches based on static population sampling or insufficiently resolved time-series data. We propose that such fine-scaled, temporally fluctuating selection may be an important
force contributing to the maintenance of functional genetic variation in natural populations and an important stochastic force impacting genome-wide patterns of diversity at linked neutral
sites, akin to genetic draft. Access through your institution Buy or subscribe This is a preview of subscription content, access via your institution ACCESS OPTIONS Access through your
institution Access Nature and 54 other Nature Portfolio journals Get Nature+, our best-value online-access subscription $29.99 / 30 days cancel any time Learn more Subscribe to this journal
Receive 51 print issues and online access $199.00 per year only $3.90 per issue Learn more Buy this article * Purchase on SpringerLink * Instant access to full article PDF Buy now Prices may
be subject to local taxes which are calculated during checkout ADDITIONAL ACCESS OPTIONS: * Log in * Learn about institutional subscriptions * Read our FAQs * Contact customer support
SIMILAR CONTENT BEING VIEWED BY OTHERS MULTIPLE MECHANISMS DRIVE GENOMIC ADAPTATION TO EXTREME O2 LEVELS IN _DROSOPHILA MELANOGASTER_ Article Open access 12 February 2021 QUANTIFYING THE
EFFECT OF GENETIC, ENVIRONMENTAL AND INDIVIDUAL DEMOGRAPHIC STOCHASTIC VARIABILITY FOR POPULATION DYNAMICS IN _PLANTAGO LANCEOLATA_ Article Open access 30 November 2021 LONG-TERM STUDIES
PROVIDE UNIQUE INSIGHTS INTO EVOLUTION Article 19 March 2025 DATA AVAILABILITY Founder line sequences are available at the NCBI with the accession ID PRJNA722305. Sequences generated via
pooled sequencing for this experiment are available at the NCBI with the accession ID PRJNA1031645. Allele frequency data are available at the following Dryad repository:
https://doi.org/10.5061/dryad.xd2547dpv. CODE AVAILABILITY Code associated with all analyses conducted in this paper is publicly available at:
https://github.com/MarkCBitter/DrosophilaMesocosm21_FluctuatingSelection. CHANGE HISTORY * _ 12 MAY 2025 In the version of this article initially published, minus signs were missing from the
values below 0 in the _y_-axis labels of Fig. 2e, f; the figure is now updated in the HTML and PDF versions of the article. _ REFERENCES * Bitter, M. C. et al. Fluctuating selection and
global change: a synthesis and review on disentangling the roles of climate amplitude, predictability and novelty. _Proc. R. Soc. B_ 288, 20210727 (2021). Article CAS PubMed PubMed
Central Google Scholar * Botero, C. A., Weissing, F. J., Wright, J. & Rubenstein, D. R. Evolutionary tipping points in the capacity to adapt to environmental change. _Proc. Natl Acad.
Sci. USA_ 112, 184–189 (2015). Article ADS CAS PubMed Google Scholar * Chevin, L.-M., Lande, R. & Mace, G. M. Adaptation, plasticity, and extinction in a changing environment:
towards a predictive theory. _PLoS Biol._ 8, e1000357 (2010). Article PubMed PubMed Central Google Scholar * Buffalo, V. & Coop, G. Estimating the genome-wide contribution of
selection to temporal allele frequency change. _Proc. Natl Acad. Sci. USA_ 117, 20672–20680 (2020). Article ADS CAS PubMed PubMed Central Google Scholar * Clark, R. D. et al. The
practice and promise of temporal genomics for measuring evolutionary responses to global change. _Mol. Ecol. Resour._ https://doi.org/10.1111/1755-0998.13789 (2023). Article PubMed PubMed
Central Google Scholar * Lynch, M., Wei, W., Ye, Z. & Pfrender, M. E. The genome-wide signature of short-term temporal selection. _Proc. Natl Acad. Sci USA_ 121, e2307107121 (2024). *
Barton, N. H. & Turelli, M. Evolutionary quantitative genetics: how little do we know? _Annu. Rev. Genet._ 23, 337–370 (1989). Article CAS PubMed Google Scholar * Bertram, J. &
Masel, J. Different mechanisms drive the maintenance of polymorphism at loci subject to strong versus weak fluctuating selection. _Evolution_ 73, 883–896 (2019). Article PubMed Google
Scholar * Hedrick, P. W. Genetic polymorphism in heterogeneous environments: the age of genomics. _Annu. Rev. Ecol. Evol. Syst._ 37, 67–93 (2006). Article Google Scholar * Messer, P. W.,
Ellner, S. P. & Hairston, N. G. Can population genetics adapt to rapid evolution? _Trends Genet._ 32, 408–418 (2016). Article CAS PubMed Google Scholar * Wittmann, M. J., Bergland,
A. O., Feldman, M. W., Schmidt, P. S. & Petrov, D. A. Seasonally fluctuating selection can maintain polymorphism at many loci via segregation lift. _Proc. Natl Acad. Sci. USA_ 114,
E9932–E9941 (2017). Article ADS CAS PubMed PubMed Central Google Scholar * Gleason, J. M., Roy, P. R., Everman, E. R., Gleason, T. C. & Morgan, T. J. Phenology of _Drosophila_
species across a temperate growing season and implications for behavior. _PLoS ONE_ 14, e0216601 (2019). Article CAS PubMed PubMed Central Google Scholar * Boor, G. K. H., Schultz, C.
B., Crone, E. E. & Morris, W. F. Mechanism matters: the cause of fluctuations in boom–bust populations governs optimal habitat restoration strategy. _Ecol. Appl._ 28, 356–372 (2018).
Article Google Scholar * Kendall, B. E. et al. Why do populations cycle? A synthesis of statistical and mechanistic modeling approaches. _Ecology_ 80, 1789–1805 (1999). Article Google
Scholar * Behrman, E. L., Watson, S. S., O’Brien, K. R., Heschel, M. S. & Schmidt, P. S. Seasonal variation in life history traits in two _Drosophila_ species. _J. Evol. Biol._ 28,
1691–1704 (2015). Article CAS PubMed PubMed Central Google Scholar * Behrman, E. L. & Schmidt, P. How predictable is rapid evolution? Preprint at _bioRxiv_
https://doi.org/10.1101/2022.10.27.514123 (2022). * Schmidt, P. S. & Conde, D. R. Environmental heterogeneity and the maintenance of genetic variation for reproductive diapause in
_Drosophila melanogaster_. _Evolution_ 60, 1602–1611 (2006). PubMed Google Scholar * Band, H. T. & Ives, P. T. Correlated changes in environment and lethal frequency in a natural
population of _Drosophila melanogaster_. _Proc. Natl Acad. Sci. USA_ 47, 180–185 (1961). Article ADS CAS PubMed PubMed Central Google Scholar * Dobzhansky, T. Genetics of natural
populations IX. Temporal changes in the composition of populations of _Drosophila pseudoobscura_. _Genetics_ 28, 162–186 (1943). Article CAS PubMed PubMed Central Google Scholar *
Bergland, A. O., Behrman, E. L., O’Brien, K. R., Schmidt, P. S. & Petrov, D. A. Genomic evidence of rapid and stable adaptive oscillations over seasonal time scales in _Drosophila_.
_PLoS Genet._ 10, e1004775 (2014). Article PubMed PubMed Central Google Scholar * Machado, H. E. et al. Broad geographic sampling reveals the shared basis and environmental correlates of
seasonal adaptation in _Drosophila_. _eLife_ 10, e67577 (2021). Article CAS PubMed PubMed Central Google Scholar * Rudman, S. M. et al. Direct observation of adaptive tracking on
ecological time scales in _Drosophila_. _Science_ 375, eabj7484 (2022). Article CAS PubMed PubMed Central Google Scholar * Lässig, M., Mustonen, V. & Walczak, A. M. Predicting
evolution. _Nat. Ecol. Evol._ 1, 77 (2017). Article PubMed Google Scholar * Charlesworth, B. _Evolution in Age-Structured Populations_ (Cambridge Univ. Press, 1994). * Wiberg, R. A. W.,
Gaggiotti, O. E., Morrissey, M. B. & Ritchie, M. G. Identifying consistent allele frequency differences in studies of stratified populations. _Methods Ecol. Evol._ 8, 1899–1909 (2017).
Article PubMed PubMed Central Google Scholar * Corbett-Detig, R. B., Hartl, D. L. & Sackton, T. B. Natural selection constrains neutral diversity across a wide range of species.
_PLoS Biol._ 13, e1002112 (2015). Article PubMed PubMed Central Google Scholar * Buffalo, V. & Coop, G. The linked selection signature of rapid adaptation in temporal genomic data.
_Genetics_ 213, 1007–1045 (2019). Article PubMed PubMed Central Google Scholar * Bolnick, D. I., Barrett, R. D. H., Oke, K. B., Rennison, D. J. & Stuart, Y. E. (Non)parallel
evolution. _Annu. Rev. Ecol. Evol. Syst._ 49, 303–330 (2018). Article Google Scholar * Barrett, R. D. H. et al. Linking a mutation to survival in wild mice. _Science_ 363, 499–504 (2019).
Article ADS CAS PubMed Google Scholar * Colosimo, P. F. et al. Widespread parallel evolution in sticklebacks by repeated fixation of ectodysplasin alleles. _Science_ 307, 1928–1933
(2005). Article ADS CAS PubMed Google Scholar * Hoekstra, H. E., Hirschmann, R. J., Bundey, R. A., Insel, P. A. & Crossland, J. P. A single amino acid mutation contributes to
adaptive beach mouse color pattern. _Science_ 313, 101–104 (2006). Article ADS CAS PubMed Google Scholar * Yeaman, S. et al. Convergent local adaptation to climate in distantly related
conifers. _Science_ 353, 1431–1433 (2016). Article ADS CAS PubMed Google Scholar * Dobzhansky, T. Altitudinal and seasonal changes produced by natural selection in certain populations
of _Drosophila pseudoobscura_ and _Drosophila persimilis_. _Genetics_ 33, 158–176 (1948). Article CAS PubMed PubMed Central Google Scholar * Hill, W. G. & Robertson, A. The effect
of linkage on limits to artificial selection. _Genet. Res._ 8, 269–294 (1966). Article CAS PubMed Google Scholar * Felsenstein, J. The evolutionary advantage of recombination. _Genetics_
78, 737–756 (1974). Article CAS PubMed PubMed Central Google Scholar * Neher, R. A. Genetic draft, selective interference, and population genetics of rapid adaptation. _Annu. Rev.
Ecol. Evol. Syst._ 44, 195–215 (2013). Article Google Scholar * Turelli, M. & Barton, N. H. Polygenic variation maintained by balancing selection: pleiotropy, sex-dependent allelic
effects and G × E interactions. _Genetics_ 166, 1053–1079 (2004). Article PubMed PubMed Central Google Scholar * Aguade, M., Miyashita, N. & Langley, C. H. Reduced variation in the
yellow-achaete-scute region in natural populations of _Drosophila melanogaster_. _Genetics_ 122, 607–615 (1989). Article CAS PubMed PubMed Central Google Scholar * Barton, N. H. Genetic
hitchhiking. _Phil. Trans. R. Soc. Lond. B_ 355, 1553–1562 (2000). Article CAS Google Scholar * Begun, D. J. & Aquadro, C. F. Levels of naturally occurring DNA polymorphism correlate
with recombination rates in _D. melanogaster_. _Nature_ 356, 519–520 (1992). Article ADS CAS PubMed Google Scholar * Cai, J. J., Macpherson, J. M., Sella, G. & Petrov, D. A.
Pervasive hitchhiking at coding and regulatory sites in humans. _PLoS Genet._ 5, e1000336 (2009). Article PubMed PubMed Central Google Scholar * Charlesworth, B. & Jensen, J. D.
Effects of selection at linked sites on patterns of genetic variability. _Annu. Rev. Ecol. Evol. Syst._ 52, 177–197 (2021). Article PubMed PubMed Central Google Scholar * Gillespie, J.
H. Junk ain’t what junk does: neutral alleles in a selected context. _Gene_ 205, 291–299 (1997). Article CAS PubMed Google Scholar * Macpherson, J. M., Sella, G., Davis, J. C. &
Petrov, D. A. Genomewide spatial correspondence between nonsynonymous divergence and neutral polymorphism reveals extensive adaptation in _Drosophila_. _Genetics_ 177, 2083–2099 (2007).
Article CAS PubMed PubMed Central Google Scholar * Wittmann, M. J., Mousset, S. & Hermisson, J. Modeling the genetic footprint of fluctuating balancing selection: from the local to
the genomic scale. _Genetics_ 223, iyad022 (2023). Article PubMed Google Scholar * Buffalo, V. Quantifying the relationship between genetic diversity and population size suggests natural
selection cannot explain Lewontin’s Paradox. _eLife_ 10, e67509 (2021). Article CAS PubMed PubMed Central Google Scholar * Coop, G. Does linked selection explain the narrow range of
genetic diversity across species? Preprint at _bioRxiv_ https://doi.org/10.1101/042598 (2016). * Lewontin, R. C. _The Genetic Basis of Evolutionary Change_ (Columbia Univ. Press, 1974). *
Levins, R. _Evolution in Changing Environments_ (Princeton Univ. Press, 1968). * Stroud, J. T., Moore, M. P., Langerhans, R. B. & Losos, J. B. Fluctuating selection maintains distinct
species phenotypes in an ecological community in the wild. _Proc. Natl Acad. Sci. USA_ 120, e2222071120 (2023). Article CAS PubMed PubMed Central Google Scholar * Gingerich, P. D. Rates
of evolution: effects of time and temporal scaling. _Science_ 222, 159–161 (1983). Article ADS CAS PubMed Google Scholar * Richardson, J. L., Urban, M. C., Bolnick, D. I. & Skelly,
D. K. Microgeographic adaptation and the spatial scale of evolution. _Trends Ecol. Evol._ 29, 165–176 (2014). Article PubMed Google Scholar * Donihue, C. M. et al. Hurricane-induced
selection on the morphology of an island lizard. _Nature_ 560, 88–91 (2018). Article ADS CAS PubMed Google Scholar * Campbell-Staton, S. C. et al. Ivory poaching and the rapid evolution
of tusklessness in African elephants. _Science_ 374, 483–487 (2021). Article ADS CAS PubMed Google Scholar * Exposito-Alonso, M. et al. Genetic diversity loss in the Anthropocene.
_Science_ 377, 1431–1435 (2022). Article ADS CAS PubMed Google Scholar * Rudman, S. M. et al. Microbiome composition shapes rapid genomic adaptation of _Drosophila melanogaster_. _Proc.
Natl Acad. Sci. USA_ 116, 20025–20032 (2019). Article ADS CAS PubMed PubMed Central Google Scholar * Li, H. & Durbin, R. Fast and accurate short read alignment with
Burrows–Wheeler transform. _Bioinformatics_ 25, 1754–1760 (2009). Article CAS PubMed PubMed Central Google Scholar * Tilk, S. et al. Accurate allele frequencies from ultra-low coverage
Pool-seq samples in evolve-and-resequence experiments. _G3_ 9, 4159–4168 (2019). Article CAS PubMed PubMed Central Google Scholar * Kessner, D., Turner, T. L. & Novembre, J. Maximum
likelihood estimation of frequencies of known haplotypes from pooled sequence data. _Mol. Biol. Evol._ 30, 1145–1158 (2013). Article CAS PubMed PubMed Central Google Scholar * Kofler,
R., Pandey, R. V. & Schlötterer, C. PoPoolation2: identifying differentiation between populations using sequencing of pooled DNA samples (Pool-seq). _Bioinformatics_ 27, 3435–3436
(2011). Article CAS PubMed PubMed Central Google Scholar Download references ACKNOWLEDGEMENTS We are grateful to members of the Petrov and Schmidt laboratories for discussion during
experimental design, laboratory work and data analysis; M. Karageorgi and K. Solari for support with sample sequencing; J. Rhodes and S. Greenblum for feedback on statistical analysis and
computing; M. Exposito-Alonso, H. Fraser, O. Ghosh, S. Greenblum, J. Hemker, M. Karageorgi, B. Kim, J. Rhodes, K. Solari and S. Walton for insightful comments on drafts of the manuscript;
and R. Dhillon for the illustration presented in Fig. 1. Funding was provided by the National Science Foundation (NSF PRFB 2109407 to M.C.B.) and the US National Institutes of Health (NIH
R35GM118165 to D.A.P. and NIH R01GM137430 to P.S.). AUTHOR INFORMATION AUTHORS AND AFFILIATIONS * Department of Biology, Stanford University, Stanford, CA, USA M. C. Bitter, A. Huynh, Egor
Lappo & D. A. Petrov * Department of Biology, University of Pennsylvania, Philadelphia, PA, USA S. Berardi, H. Oken & P. Schmidt * Chan Zuckerberg Biohub, San Francisco, CA, USA D.
A. Petrov Authors * M. C. Bitter View author publications You can also search for this author inPubMed Google Scholar * S. Berardi View author publications You can also search for this
author inPubMed Google Scholar * H. Oken View author publications You can also search for this author inPubMed Google Scholar * A. Huynh View author publications You can also search for this
author inPubMed Google Scholar * Egor Lappo View author publications You can also search for this author inPubMed Google Scholar * P. Schmidt View author publications You can also search
for this author inPubMed Google Scholar * D. A. Petrov View author publications You can also search for this author inPubMed Google Scholar CONTRIBUTIONS The experiment was conceived by
M.C.B., D.A.P. and P.S. The mesocosm study was conducted by M.C.B., S.B., H.O. and P.S. Population census size estimates were conducted by A.H. DNA extraction, library preparation and
sequencing were conducted by M.C.B. Bioinformatic analysis and statistical analysis of allele frequency data were carried out by M.C.B. and E.L. M.C.B., D.A.P. and P.S. wrote the manuscript,
with feedback from all authors. CORRESPONDING AUTHORS Correspondence to M. C. Bitter, P. Schmidt or D. A. Petrov. ETHICS DECLARATIONS COMPETING INTERESTS The authors declare no competing
interests. PEER REVIEW PEER REVIEW INFORMATION _Nature_ thanks the anonymous reviewers for their contribution to the peer review of this work. Peer reviewer reports are available. ADDITIONAL
INFORMATION PUBLISHER’S NOTE Springer Nature remains neutral with regard to jurisdictional claims in published maps and institutional affiliations. EXTENDED DATA FIGURES AND TABLES EXTENDED
DATA FIG. 1 COMPARISON OF BASELINE POPULATION TO WILD _D. MELANOGASTER_ POPULATIONS. The degree of genome-wide differentiation between our baseline population (_n_ = 4) and the Pennsylvania
population from which it was derived (_n_ = 14) (Baseline: PA Pop) is comparable, and statistically indistinguishable, from that observed between the Pennsylvania population and other wild
populations throughout Eastern North America (_n_ = 6) (PA Pop: East NA Pops; one-tailed Student’s t-test, P value = 0.99). The baseline population is significantly less differentiated from
the Pennsylvania population (Baseline: PA Pop) than from populations in California (_n_ = 17) (Baseline: CA Pop; one-tailed Student’s t-test P value < 0.001) and European populations
(Baseline: EU Pops; one-tailed Student’s t-test, P value < 0.001), following the same trend as differentiation between the wild Pennsylvania population and other wild populations in
eastern North America (PA Pop: East NA Pops), California (PA Pop: CA Pop), and Europe (PA Pop: Eu Pops). Natural population sampling and data provided by Machado et al.30. EXTENDED DATA FIG.
2 GENOME-WIDE DIFFERENTIATION THROUGHOUT EXPERIMENT. Distribution of genome-wide Fst computed pairwise between all technical replicate samples (same DNA extraction, different library
preparation and sequencing lane; _n_ = 10), biological replicates (same time point and replicate cage, different pool of 100 flies; _n_ = 17), and samples collected at each time point (_n_ =
12) and the baseline population samples (‘Base’, _n_ = 4), for each of the twelve time points. Center lines of each box plot display the median Fst value, vertical lines denote the 25th and
75th percentiles, and dots indicate outlier values. The distributions of genome-wide FST between time point samples and the baseline population was significantly greater than that observed
between technical replicates (*) and biological replicates (+) (two-tailed Student’s t-test; P-value < 0.01). FST between time point samples and the baseline population increased
throughout the course of the experiment (generalized linear model; P = 0.039). EXTENDED DATA FIG. 3 SNP-PAIR LINKAGE WITHIN AND BETWEEN UNLINKED LOCI. SNP-pair linkage is calculated as the
correlation (R-squared) between founder genotypes. (a-c) Smoothed LOESS regressions (grey shaded regions indicate 95% confidence intervals) of linkage for (a) pairs of GLM significant SNPs
within and across all 264 unlinked loci, (b) pairs of GLM significant SNPs within the same unlinked locus, and (c) between pairs of SNPs located within separate, unlinked loci (_n_ =
1,000,000 total SNP-pair comparisons). (d) Empirical cumulative density functions of SNP-pair linkage across the top 50 SNPs of each of the identified 264 unlinked loci, segregated by
chromosomal arm. Linkage was calculated between top SNPs of separate loci located within 1 Mb of each other. Observed mean linkage (R2 values) between top SNPs for each chromosomal arm are
as follows: 2 L = 0.034; 2 R = 0.023; 3 L = 0.028; 3 R = 0.028; X = 0.027; Genome-wide = 0.029. EXTENDED DATA FIG. 4 CORRELATIONS OF ALLELE FREQUENCY MOVEMENT WITHIN AND ACROSS PUTATIVELY
UNLINKED LOCI. Correlations of allele frequency shifts (averaged across replicates) for pairs of GLM significant SNPs (starting frequencies and effect sizes in the same decile; _n_ =
1,000,0000 total comparisons). Each point on the plot shows the median correlation between focal SNPs and SNPs within the same unlinked locus (positive control SNPs, green points), SNPs in a
different identified locus on the same chromosomal arm (Comparison SNPs, black points; x-axis represents distance from focal SNP; filtered to only consider pairs of SNPs that fell below our
threshold for merging putatively linked clusters (r2 < 0.03)), and SNPs in loci located on different chromosomes (negative control SNPs, red points). Note error bars representing 95%
bootstrap confidence intervals obtained by resampling combinations of SNPs are too small to be visible on plots. Observed correlations are segregated by chromosomal arm (rows) and the number
of top SNPs (based on GLM P-value) evaluated when computing correlations. EXTENDED DATA FIG. 5 MINIMUM NUMBER OF FLIPS IN THE DOMINANT DIRECTION OF SELECTION INFERRED FROM CHANGES IN MEDIAN
BEHAVIOR OF SNPS IDENTIFIED ON FIVE AND TEN TIME POINT INTERVALS. Distribution of the number of flips in the dominant direction of selection observed throughout the experiment for sets of
target SNPs identified using GLM leave-one-out cross validation across all ten time point intervals (t1->11 and t2->12) and five time point intervals (t1->6, t2->7…t6->12),
and tested within each consecutive time point interval (e.g. t1->2, t2->3…t11->12). A flip was inferred when the median allele frequency shift at target SNPs switched signs (i.e.
fluctuated from positive to negative, or vice versa) and maintained a magnitude that was significantly greater than matched controls. Thus, the number of flips computed represents the
minimum number of changes in the direction of selection required to explain the observed patterns of median allele frequency behavior throughout the experiment. SNPs identified on five time
point intervals flipped in sign significantly more than those identified on ten time point intervals (Wilcoxon rank sum test, W = 706, p = 0.02). EXTENDED DATA FIG. 6 MEASUREMENT VARIANCE OF
TARGET AND MATCHED CONTROL SNPS IDENTIFIED ACROSS ALL FIVE TIME POINT INTERVALS AND THROUGHOUT SUMMER TO FALL TRANSITION (T1->11). Distribution of variances of allele frequency estimates
between biological replicate samples (obtained at time points 3 and 11) at sets of target and matched control SNPs underlying data presented in Figs. 2f and 3. The variances are not
significantly different between sets of target or matched control SNPs (Wilcoxon rank sum test, W = 591, P = 0.88). EXTENDED DATA FIG. 7 ALLELE FREQUENCY COVARIANCES AND CONVERGENCE
CORRELATIONS THROUGHOUT THE EXPERIMENT. (a) Mean covariances (across replicates) between each pair of single time point intervals (interval 3 corresponds to t3->4, interval 4 corresponds
to t4->5, etc.). Covariances between adjacent intervals are removed due to shared technical noise. Covariance estimates with confidence intervals non-overlapping the zero line indicate
that the signal of linked selection dominates over drift, while changes in the sign of covariances across intervals implicates fluctuations in the direction of selection. (b)
Replicate-specific covariances between the first single time point interval (interval 1; t1->2) and all remaining single time point intervals, plotted separately for each replicate cage.
(c) Mean convergence correlations between all pairs of replicates within each single time point interval. Positive convergence correlations suggest parallel allele frequency movement across
replicates for a given interval. EXTENDED DATA FIG. 8 MESOCOSM DAILY TEMPERATURE. Daily minimum and maximum temperature from a weather station located within the mesocosm study system.
SUPPLEMENTARY INFORMATION SUPPLEMENTARY INFORMATION Supplementary Figs 1–25. REPORTING SUMMARY PEER REVIEW FILE SUPPLEMENTARY FILE 1 SNPs identified as significant (FDR < 0.05; allele
frequency shift > 3%) via generalized linear model regression of allele frequency data across all cages from time points 1->11. SNP coordinates provided in _Drosophila melanogaster_
reference genome v. 5.39 SUPPLEMENTARY FILE 2 Coordinates of unlinked loci underpinning patterns of selection inferred via generalized linear regression of allele frequency data across all
cages from time points 1->11. SNP coordinates provided in _Drosophila melanogaster_ reference genome v. 5.39. SUPPLEMENTARY FILE 3 SNPs identified as significant (FDR < 0.05; allele
frequency shift > 3%) via generalized linear model regression of allele frequency data across all cages, separately for each five time point interval comparison. SNP coordinates provided
in _Drosophila melanogaster_ reference genome v. 5.39. RIGHTS AND PERMISSIONS Springer Nature or its licensor (e.g. a society or other partner) holds exclusive rights to this article under a
publishing agreement with the author(s) or other rightsholder(s); author self-archiving of the accepted manuscript version of this article is solely governed by the terms of such publishing
agreement and applicable law. Reprints and permissions ABOUT THIS ARTICLE CITE THIS ARTICLE Bitter, M.C., Berardi, S., Oken, H. _et al._ Continuously fluctuating selection reveals fine
granularity of adaptation. _Nature_ 634, 389–396 (2024). https://doi.org/10.1038/s41586-024-07834-x Download citation * Received: 23 January 2024 * Accepted: 16 July 2024 * Published: 14
August 2024 * Issue Date: 10 October 2024 * DOI: https://doi.org/10.1038/s41586-024-07834-x SHARE THIS ARTICLE Anyone you share the following link with will be able to read this content: Get
shareable link Sorry, a shareable link is not currently available for this article. Copy to clipboard Provided by the Springer Nature SharedIt content-sharing initiative


)
