- Select a language for the TTS:
- UK English Female
- UK English Male
- US English Female
- US English Male
- Australian Female
- Australian Male
- Language selected: (auto detect) - EN
Play all audios:
ABSTRACT The periosteum is the layer of cells that covers nearly the entire surface of every bone. Upon infection, injury or malignancy the bone surface undergoes new growth—the periosteal
reaction—but the mechanism and physiological role of this process remain unknown1,2. Here we show that the periosteal reaction protects against cancer invasion into the bone. Histological
analyses of human lesions of head and neck squamous cell carcinomas (HNSCCs) show that periosteal thickening occurs in proximity to the tumour. We developed a genetically dissectible mouse
model of HNSCC and demonstrate that inducible depletion of periosteal cells accelerates cancerous invasion of the bone. Single-cell RNA sequencing reveals that expression of the gene
encoding the protease inhibitor TIMP1 is markedly increased in the periosteum at the pre-invasive stage. This increase is due to upregulation of HIF1α expression in the tumour
microenvironment, and increased TIMP1 inactivates matrix-degrading proteases, promoting periosteal thickening to inhibit cancer invasion. Genetic deletion of _Timp1_ impairs periosteal
expansion, exacerbating bone invasion and decreasing survival in tumour-bearing mice. Together, these data show that the periosteal reaction may act as a functional stromal barrier against
tumour progression, representing a unique example of tissue immunity mediated by stromal cells. Access through your institution Buy or subscribe This is a preview of subscription content,
access via your institution ACCESS OPTIONS Access through your institution Access Nature and 54 other Nature Portfolio journals Get Nature+, our best-value online-access subscription $29.99
/ 30 days cancel any time Learn more Subscribe to this journal Receive 51 print issues and online access $199.00 per year only $3.90 per issue Learn more Buy this article * Purchase on
SpringerLink * Instant access to full article PDF Buy now Prices may be subject to local taxes which are calculated during checkout ADDITIONAL ACCESS OPTIONS: * Log in * Learn about
institutional subscriptions * Read our FAQs * Contact customer support SIMILAR CONTENT BEING VIEWED BY OTHERS HOW THE BONE MICROENVIRONMENT SHAPES THE PRE-METASTATIC NICHE AND METASTASIS
Article 13 December 2024 LYMPHOTOXIN_-_Β PROMOTES BREAST CANCER BONE METASTASIS COLONIZATION AND OSTEOLYTIC OUTGROWTH Article 15 August 2024 EVOLVING CANCER–NICHE INTERACTIONS AND
THERAPEUTIC TARGETS DURING BONE METASTASIS Article 05 October 2021 DATA AVAILABILITY The scRNA-seq, ChIP–seq and whole-exome sequencing data produced in this study have been deposited to the
Gene Expression Omnibus under accessions GSE241334, GSE256307 and GSE255936. Source data are provided with this paper. CODE AVAILABILITY R scripts47 for data analysis used in this study are
available at GitHub (https://github.com/nakamurakazu). REFERENCES * Duhamel, H. L. Sur une racine qui a la faculte de triendre en rouge les os des animaux vivants. _Mem. Acad. R. Sci.
Paris_ 52, 1–13 (1739). Google Scholar * Rana, R. S., Wu, J. S. & Eisenberg, R. L. Periosteal reaction. _Am. J. Roentgenol._ 193, W259–W272 (2009). Google Scholar * Vilchez Mercedes,
S. A. et al. Decoding leader cells in collective cancer invasion. _Nat. Rev. Cancer_ 21, 592–604 (2021). Article CAS PubMed Google Scholar * Friedl, P. & Wolf, K. Tumour-cell
invasion and migration: diversity and escape mechanisms. _Nat. Rev. Cancer_ 3, 362–374 (2003). CAS PubMed Google Scholar * Baracos, V. E., Martin, L., Korc, M., Guttridge, D. C. &
Fearon, K. C. H. Cancer-associated cachexia. _Nat. Rev. Dis. Primers_ 4, 17105 (2018). PubMed Google Scholar * Winer, A., Adams, S. & Mignatti, P. Matrix metalloproteinase inhibitors
in cancer therapy: turning past failures into future successes. _Mol. Cancer Ther._ 17, 1147–1155 (2018). CAS PubMed PubMed Central Google Scholar * Jackson, H. W., Defamie, V.,
Waterhouse, P. & Khokha, R. TIMPs: versatile extracellular regulators in cancer. _Nat. Rev. Cancer_ 17, 38–53 (2017). CAS PubMed Google Scholar * Hermann, C. D. et al. TIMP1
expression underlies sex disparity in liver metastasis and survival in pancreatic cancer. _J. Exp. Med._ 218, e20210911 (2021). CAS PubMed PubMed Central Google Scholar * Shimoda, M. et
al. Loss of the Timp gene family is sufficient for the acquisition of the CAF-like cell state. _Nat. Cell Biol._ 16, 889–901 (2014). CAS PubMed Google Scholar * Grünwald, B. et al.
Pancreatic premalignant lesions secrete tissue inhibitor of metalloproteinases-1, which activates hepatic stellate cells via CD63 signaling to create a premetastatic niche in the liver.
_Gastroenterology_ 151, 1011–1024.e1017 (2016). PubMed Google Scholar * Osawa, Y. et al. Liver acid sphingomyelinase inhibits growth of metastatic colon cancer. _J. Clin. Invest._ 123,
834–843 (2013). CAS PubMed PubMed Central Google Scholar * Head and neck squamous cell carcinoma. _Nat. Rev. Dis. Primers_ 6, 93 (2020). * Tsukasaki, M. et al. Periosteal stem cells
control growth plate stem cells during postnatal skeletal growth. _Nat. Commun._ 13, 4166 (2022). ADS CAS PubMed PubMed Central Google Scholar * Park, J. et al. CCL28-induced RARβ
expression inhibits oral squamous cell carcinoma bone invasion. _J. Clin. Invest._ 129, 5381–5399 (2019). CAS PubMed PubMed Central Google Scholar * Takaoka, M. et al. _Ha-Ras__G12V_
induces senescence in primary and immortalized human esophageal keratinocytes with p53 dysfunction. _Oncogene_ 23, 6760–6768 (2004). CAS PubMed Google Scholar * Nakagawa, H. et al. The
targeting of the cyclin D1 oncogene by an Epstein–Barr virus promoter in transgenic mice causes dysplasia in the tongue, esophagus and forestomach. _Oncogene_ 14, 1185–1190 (1997). CAS
PubMed Google Scholar * Sun, X. et al. Amplifying STING activation by cyclic dinucleotide-manganese particles for local and systemic cancer metalloimmunotherapy. _Nat. Nanotechnol._ 16,
1260–1270 (2021). ADS CAS PubMed PubMed Central Google Scholar * Hashimoto, K., Sato, S., Ochi, H., Takeda, S. & Futakuchi, M. Calvarial bone implantation and. _Bio Protoc._ 9,
e3151 (2019). PubMed PubMed Central Google Scholar * Hashimoto, K. et al. Cancer-secreted hsa-miR-940 induces an osteoblastic phenotype in the bone metastatic microenvironment via
targeting ARHGAP1 and FAM134A. _Proc. Natl Acad. Sci. USA_ 115, 2204–2209 (2018). ADS CAS PubMed PubMed Central Google Scholar * Network, C. G. A. Comprehensive genomic characterization
of head and neck squamous cell carcinomas. _Nature_ 517, 576–582 (2015). ADS Google Scholar * Alshetaiwi, H. et al. Defining the emergence of myeloid-derived suppressor cells in breast
cancer using single-cell transcriptomics. _Sci. Immunol._ 5, eaay6017 (2020). CAS PubMed PubMed Central Google Scholar * Tsukasaki, M. & Takayanagi, H. Osteoimmunology: evolving
concepts in bone-immune interactions in health and disease. _Nat. Rev. Immunol._ 19, 626–642 (2019). CAS PubMed Google Scholar * Debnath, S. et al. Discovery of a periosteal stem cell
mediating intramembranous bone formation. _Nature_ 562, 133–139 (2018). ADS CAS PubMed PubMed Central Google Scholar * Wilson, W. R. & Hay, M. P. Targeting hypoxia in cancer
therapy. _Nat. Rev. Cancer_ 11, 393–410 (2011). CAS PubMed Google Scholar * Otani, S. et al. Runx3 is required for oncogenic Myc upregulation in _p53_-deficient osteosarcoma. _Oncogene_
41, 683–691 (2022). CAS PubMed Google Scholar * Julien, A. et al. Skeletal stem/progenitor cells in periosteum and skeletal muscle share a common molecular response to bone injury. _J.
Bone Miner. Res._ 37, 1545–1561 (2022). CAS PubMed Google Scholar * Eckfeld, C. et al. TIMP-1 is a novel ligand of amyloid precursor protein and triggers a proinflammatory phenotype in
human monocytes. _J. Cell Biol._ 222, e202206095 (2023). CAS PubMed PubMed Central Google Scholar * Hirasawa, T. & Kuratani, S. Evolution of the vertebrate skeleton: morphology,
embryology, and development. _Zoological Lett._ 1, 2 (2015). PubMed PubMed Central Google Scholar * Shimada, A. et al. Trunk exoskeleton in teleosts is mesodermal in origin. _Nat.
Commun._ 4, 1639 (2013). ADS PubMed Google Scholar * Kajita, M. et al. Filamin acts as a key regulator in epithelial defence against transformed cells. _Nat. Commun._ 5, 4428 (2014). ADS
CAS PubMed Google Scholar * Morata, G. & Ripoll, P. Minutes: mutants of _Drosophila_ autonomously affecting cell division rate. _Dev. Biol._ 42, 211–221 (1975). CAS PubMed Google
Scholar * de la Cova, C., Abril, M., Bellosta, P., Gallant, P. & Johnston, L. A. _Drosophila myc_ regulates organ size by inducing cell competition. _Cell_ 117, 107–116 (2004). PubMed
Google Scholar * Hogan, C. et al. Characterization of the interface between normal and transformed epithelial cells. _Nat. Cell Biol._ 11, 460–467 (2009). CAS PubMed Google Scholar *
Nakamura, T. et al. Estrogen prevents bone loss via estrogen receptor alpha and induction of Fas ligand in osteoclasts. _Cell_ 130, 811–823 (2007). CAS PubMed Google Scholar * Wang, H. et
al. One-step generation of mice carrying mutations in multiple genes by CRISPR/Cas-mediated genome engineering. _Cell_ 153, 910–918 (2013). CAS PubMed PubMed Central Google Scholar *
Tsukasaki, M. et al. Stepwise cell fate decision pathways during osteoclastogenesis at single-cell resolution. _Nat. Metab._ 2, 1382–1390 (2020). CAS PubMed Google Scholar * Asano, T. et
al. Soluble RANKL is physiologically dispensable but accelerates tumour metastasis to bone. _Nat. Metab._ 1, 868–875 (2019). PubMed Google Scholar * Tsukasaki, M. et al. Host defense
against oral microbiota by bone-damaging T cells. _Nat. Commun._ 9, 701 (2018). ADS PubMed PubMed Central Google Scholar * Tsukasaki, M. et al. OPG production matters where it happened.
_Cell Rep._ 32, 108124 (2020). CAS PubMed Google Scholar * Kuleshov, M. V. et al. Enrichr: a comprehensive gene set enrichment analysis web server 2016 update. _Nucleic Acids Res._ 44,
W90–W97 (2016). CAS PubMed PubMed Central Google Scholar * Chen, E. Y. et al. Enrichr: interactive and collaborative HTML5 gene list enrichment analysis tool. _BMC Bioinformatics_ 14,
128 (2013). PubMed PubMed Central Google Scholar * Xie, Z. et al. Gene Set Knowledge Discovery with Enrichr. _Curr. Protoc._ 1, e90 (2021). CAS PubMed PubMed Central Google Scholar *
The Galaxy Community The Galaxy platform for accessible, reproducible and collaborative biomedical analyses: 2022 update. _Nucleic Acids Res._ 50, W345–W351 (2022). Google Scholar *
Robinson, J. T. et al. Integrative genomics viewer. _Nat. Biotechnol._ 29, 24–26 (2011). CAS PubMed PubMed Central Google Scholar * Yan, M. et al. ETS1 governs pathological
tissue-remodeling programs in disease-associated fibroblasts. _Nat. Immunol._ 23, 1330–1341 (2022). CAS PubMed Google Scholar * Akimoto, M., Maruyama, R., Takamaru, H., Ochiya, T. &
Takenaga, K. Soluble IL-33 receptor sST2 inhibits colorectal cancer malignant growth by modifying the tumour microenvironment. _Nat. Commun._ 7, 13589 (2016). ADS CAS PubMed PubMed
Central Google Scholar * Kazu. nakamurakazu/Stromal-defence-against-cancer-by-the-periosteum: stromal defence against cancer by the periosteum. _Zenodo_
https://doi.org/10.5281/zenodo.12204268 (2024). Download references ACKNOWLEDGEMENTS The authors thank T. Ushiku for valuable assistance in histological analyses and thoughtful comments on
the data interpretation and K. Kusubata, S. Yin, A. Suematsu and K. Kubo for thoughtful discussion and valuable technical assistance. This work was supported in part by the Japan Agency for
Medical Research and Development (AMED)-PRIME under grant number JP21gm6310029h0001; AMED-CREST under grant number JP19gm1210008; AMED Japan Initiative for World-leading Vaccine Research and
Development Centers (233fa627001h0002); AMED JP24ek0410108h0002; Grants-in-Aid for Scientific Research S (21H05046); Scientific Research B (21H03104); Challenging Research under grant
number 21K18254 and JST FOREST Program under grant number JPMJFR205Z; grant from Astellas Foundation for Research on Metabolic Disorders, the Kao Foundation for Arts and Sciences, the
Inamori Foundation, the Takeda Science Foundation, SENSHIN Medical Research Foundation, the Tokyo Society of Medical Sciences and the JSBMR Rising Star Grant. K. Nakamura was supported by a
JSPS Research Fellowship for Young Scientists (22KJ1029). AUTHOR INFORMATION AUTHORS AND AFFILIATIONS * Department of Immunology, Graduate School of Medicine and Faculty of Medicine, The
University of Tokyo, Tokyo, Japan Kazutaka Nakamura, Minglu Yan, Yutaro Ando, Kyoko Hashimoto, Qiao Gou, Ryunosuke Muro, Ayumi Itabashi, Takahiro Iguchi & Hiroshi Takayanagi * Oral and
Maxillofacial Surgery, Department of Sensory and Motor System Medicine, Graduate School of Medicine, The University of Tokyo, Tokyo, Japan Kazutaka Nakamura & Kazuto Hoshi * Department
of Osteoimmunology, Graduate School of Medicine and Faculty of Medicine, The University of Tokyo, Tokyo, Japan Masayuki Tsukasaki & Kazuo Okamoto * Department of Oral Molecular
Pathology, Tokushima University Graduate School of Biomedical Sciences, Tokushima, Japan Takaaki Tsunematsu * Department of Molecular Biology, University of Texas Southwestern Medical
Center, Dallas, TX, USA Minglu Yan * Laboratory of Oral-Maxillofacial Biology, Faculty of Odonto-Stomatology, University of Medicine and Pharmacy at Ho Chi Minh City, Ho Chi Minh City, Viet
Nam Nam Cong-Nhat Huynh * Division of Molecular Pathology, Research Institute for Biomedical Sciences, Tokyo University of Science, Chiba, Japan Ryunosuke Muro * Division of Immune
Environment Dynamics, Cancer Research Institute, Kanazawa University, Kanazawa, Japan Kazuo Okamoto * Department of Biochemistry, Tokyo Dental College, Tokyo, Japan Takashi Nakamura *
Department of Laboratory Animal Medicine, Research Institute, National Center for Global Health and Medicine, Tokyo, Japan Kenta Nakano & Tadashi Okamura * Department of Molecular Tumor
Biology, Graduate School of Biomedical Sciences, Nagasaki University, Nagasaki, Japan Tomoya Ueno & Kosei Ito * Department of Oral Pathology, Graduate School of Medical and Dental
Sciences, Tokyo Medical and Dental University, Tokyo, Japan Naozumi Ishimaru Authors * Kazutaka Nakamura View author publications You can also search for this author inPubMed Google Scholar
* Masayuki Tsukasaki View author publications You can also search for this author inPubMed Google Scholar * Takaaki Tsunematsu View author publications You can also search for this author
inPubMed Google Scholar * Minglu Yan View author publications You can also search for this author inPubMed Google Scholar * Yutaro Ando View author publications You can also search for this
author inPubMed Google Scholar * Nam Cong-Nhat Huynh View author publications You can also search for this author inPubMed Google Scholar * Kyoko Hashimoto View author publications You can
also search for this author inPubMed Google Scholar * Qiao Gou View author publications You can also search for this author inPubMed Google Scholar * Ryunosuke Muro View author publications
You can also search for this author inPubMed Google Scholar * Ayumi Itabashi View author publications You can also search for this author inPubMed Google Scholar * Takahiro Iguchi View
author publications You can also search for this author inPubMed Google Scholar * Kazuo Okamoto View author publications You can also search for this author inPubMed Google Scholar * Takashi
Nakamura View author publications You can also search for this author inPubMed Google Scholar * Kenta Nakano View author publications You can also search for this author inPubMed Google
Scholar * Tadashi Okamura View author publications You can also search for this author inPubMed Google Scholar * Tomoya Ueno View author publications You can also search for this author
inPubMed Google Scholar * Kosei Ito View author publications You can also search for this author inPubMed Google Scholar * Naozumi Ishimaru View author publications You can also search for
this author inPubMed Google Scholar * Kazuto Hoshi View author publications You can also search for this author inPubMed Google Scholar * Hiroshi Takayanagi View author publications You can
also search for this author inPubMed Google Scholar CONTRIBUTIONS K. Nakamura performed most of the experiments. M.T. conceived the project, designed the experiments, analysed and
interpreted the data and wrote the manuscript. T.T. and N.I. provided HNSCC cell lines and contributed to data interpretation. M.Y., Y.A., N.C.-N.H., K.Hashimoto, Q.G., R.M., A.I., T.I.,
K.Nakano and K.O. contributed to data collection and interpretation. T.U. and K.I. provided the osteosarcoma cell line. T.N., K.Nakano and T.O. contributed to the generation of genetically
modified mice. K.Hoshi contributed to human data collection. H.T. directed the project and wrote the manuscript. CORRESPONDING AUTHORS Correspondence to Masayuki Tsukasaki or Hiroshi
Takayanagi. ETHICS DECLARATIONS COMPETING INTERESTS M.T. and K.O. belong to an endowment department, Department of Osteoimmunology, supported by an unrestricted grant from Ayumi
Pharmaceutical Corporation, Elecom, Kondo Cotton Spinning, JCR Pharmaceuticals, Mikihouse, Mitsui Fudosan, Meiji, Noevir, Takenaka, Tennenbutsu Ikagaku Kenkyu Zaidan and Yakult. The other
authors declare no competing interests. PEER REVIEW PEER REVIEW INFORMATION _Nature_ thanks Mone Zaidi and the other, anonymous, reviewer(s) for their contribution to the peer review of this
work. ADDITIONAL INFORMATION PUBLISHER’S NOTE Springer Nature remains neutral with regard to jurisdictional claims in published maps and institutional affiliations. EXTENDED DATA FIGURES
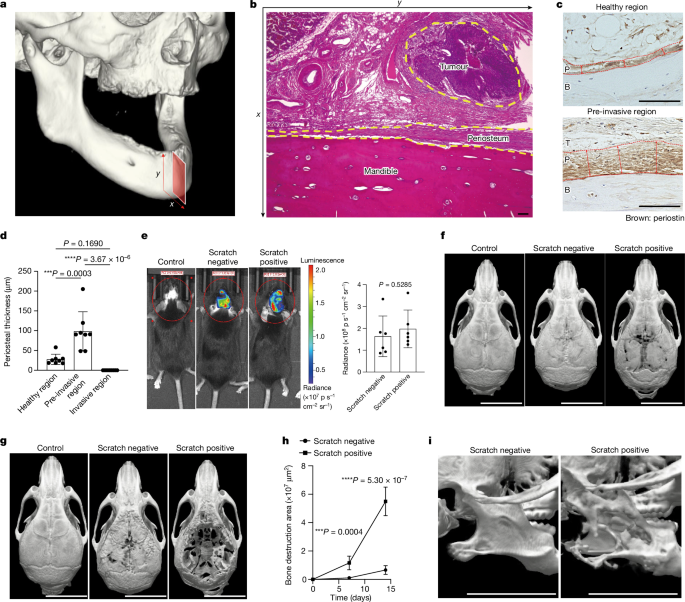
AND TABLES EXTENDED DATA FIG. 1 HISTOLOGICAL ANALYSIS OF HUMAN HNSCC LESIONS AND SUMMARY OF 8 CLINICAL CASES. A, H&E staining image of healthy, pre-invasive and invasive regions in
patients diagnosed with HNSCC. P: Periosteum, B: Bone, T: Tumours. Scale bars, 100 μm. Representative data of more than three independent experiments are shown. B, A summary of 8 clinical
cases of HNSCC. C, A simple linear regression analysis showing the correlation of the periosteal thickness and the distance from the tumour. _P_-value was determined with a _t_-test in
linear regression. Source Data EXTENDED DATA FIG. 2 THE MUTATIONAL PROFILE OF MOUSE HNSCC CELL LINES. A, Graphical matrix representation of the individual mutations in genes associated with
human HNSCCs in HNM007, AKR and NOOC1 cell lines. Listed are the alterations frequently observed in human HNSCC and the corresponding percentage of mutations analysed with the TCGA-HNSC
dataset. B, Mutation type annotated using SnpEff (Version 4.3t) to identify the putative effects on protein translation. EXTENDED DATA FIG. 3 CANCER-ASSOCIATED BONE DESTRUCTION AND THE
PERIOSTEAL THICKENING IN AKR AND NOOC1 MODELS. A,B, Representative micro-CT images (A) and bone destruction area (B) of calvarial osteolytic lesions of mice 2 weeks after the implantation of
AKR cells with or without scratching the periosteum (_n_ = 5 female mice per group). Scale bars, 7 mm. The _P_ value was determined with an unpaired two-tailed Student’s _t_-test. Data are
presented as the mean ± S.D C,D, Representative micro-CT images (C) and bone destruction area (D) of calvarial osteolytic lesions of mice 2 weeks after the implantation of NOOC1 cells with
or without scratching the periosteum (_n_ = 5 male mice per group). Scale bars, 7 mm. The _P_ value was determined with an unpaired two-tailed Student’s _t_-test. Data are presented as the
mean ± S.D. E, Bone destruction area of mandible osteolytic lesions of male mice 2 weeks after the implantation of HNM007 cells with or without scratching the periosteum (_n_ = 5). The _P_
value was determined with an unpaired two-tailed Student’s _t_-test. Data are presented as the mean ± S.D. F, Images of immunohistochemistry for pan-keratin and periostin in calvarial tissue
section of female mice. Red arrows indicate thickness of the periosteum. P: Periosteum, B: Bone. T: Tumour. Scale bars, 100 μm. Representative data of more than three independent
experiments are shown. G, Periosteal thickness of control and scratch-negative mice 1 week after the implantation of HNM007 cells (_n_ = 6 mice per group). The _P_ value was determined with
an unpaired two-tailed Student’s _t_-test. Data are presented as the mean ± S.D. H, Images of immunohistochemistry for pan-keratin in the calvarial tissue section 1 week after the
implantation of AKR cells without scratching the periosteum. Red arrows indicate thickness of the periosteum. P: Periosteum, B: Bone, T: Tumours. Scale bars, 100 μm. Representative data of
more than three independent experiments are shown. I, Periosteal thickness of control and scratch negative mice 1 week after the implantation of AKR cells (_n_ = 5 female mice per group).
The _P_ value was determined with an unpaired two-tailed Student’s _t_-test. Data are presented as the mean ± S.D. J, Images of immunohistochemistry for pan-keratin in the calvarial tissue
section 1 week after the implantation of NOOC1 cells without scratching the periosteum. Red arrows indicate thickness of the periosteum. P: Periosteum, B: Bone, T: Tumours. Scale bars, 100
μm. Representative data of more than three independent experiments are shown. K, Periosteal thickness of control and scratch negative mice 1 week after the implantation of NOOC1 cells (_n_ =
5 male mice per group). The _P_ value was determined with an unpaired two-tailed Student’s _t_-test. Data are presented as the mean ± S.D. Source Data EXTENDED DATA FIG. 4 MARKER GENES FOR
EACH CLUSTER IN THE SCRNA-SEQ DATA. Heatmap of top 5 marker genes that were differentially expressed in each cluster. EXTENDED DATA FIG. 5 THE EXPRESSION PATTERNS OF MDSC AND TREG MARKERS IN
THE UMAP CLUSTERING. A, Expression pattern of _Cd84_, _Arg2_, _Il1b_, _Clec4e_, _Wfdc17_ and _Jaml_ in the UMAP visualization. B, Expression pattern of _Cd4_, _Foxp3_, _Il10_, _Il2ra_,
_Ctla4_ and _Cd3e_ in the UMAP visualization. C, Images of immunohistochemistry for pan-keratin in the calvarial tissue section of female nude mice 1 week after the implantation of HNM007
cells without scratching the periosteum. Red arrows indicate thickness of the periosteum. P: Periosteum, B: Bone, T: Tumours. Scale bars, 100 μm. Representative data of more than three
independent experiments are shown. D, Periosteal thickness of control, scratch negative, and scratch positive nude mice 1 week after the implantation of HNM007 cells (_n_ = 5 female mice per
group). The _P_ values were calculated using a one-way ANOVA followed by Tukey’s multiple comparisons test (two-sided). Data are presented as the mean ± S.D. E, TRAP staining of the control
calvaria and calvarial osteolytic lesions 1 week after the implantation of HNM007 cells with or without scratching the periosteum. Scale bars, 100 μm. Representative data of more than three
independent experiments are shown. Source Data EXTENDED DATA FIG. 6 THE EXPRESSION PATTERNS OF PERIOSTEAL STROMAL CELL MARKERS IN THE UMAP CLUSTERING. A, Expression pattern of _Ctsk_,
_Postn_ and _Col3a1_ in the UMAP visualization. B, Violin plots showing the expression of _Pdgfra_ for each cluster. C, Violin plots showing the expression of _Pdpn_ for each cluster. D,
Violin plots showing the expression of _Postn_, _Col1a1_, _Col1a2_, _Col3a1_ and _Dcn_ for each cluster. E, A pairwise Jaccard index heatmap showing the correspondence between clusters
produced by UMAP and NMF/ k-means approaches. F, UMAP visualization of the clusters produced by the NMF/k-means approach. EXTENDED DATA FIG. 7 GATING STRATEGY FOR FACS ANALYSIS AND THE
HISTOLOGICAL ANALYSES ON THE PERIOSTEAL CELLS AT THE INVASIVE STAGE. A, Gating strategy for FACS analysis on periosteal cells. B, Immunofluorescence images for DAPI, periostin, and
pan-keratin in calvarial tissue section of the female mice 1 week after the implantation of HNM007 cells with or without scratching the periosteum. Scale bars, 100 μm. Representative data of
more than three independent experiments are shown. C, Representative H&E staining of the invasive region of HNSCC in humans. Scale bars, 100 μm. Representative data of more than three
independent experiments are shown. P: Periosteum, B: Bone, T: Tumours. EXTENDED DATA FIG. 8 THE EFFECT OF PERIOSTEAL CELL DEPLETION ON HNSCC BONE INVASION. A, FACS plot showing the deletion
efficiency of periosteal cells 1 week after the diphtheria toxin treatment (_n_ = 3 female mice per group). _P_ = 0.0118. The _P_ value was determined with an unpaired two-tailed Student’s
_t_-test. B, The number of periosteal cells 1 week after the diphtheria toxin treatment (_n_ = 3 female mice per group). Data are presented as the mean ± S.D. The _P_ value was determined
with an unpaired two-tailed Student’s _t_-test. C, Images of immunohistochemistry for periostin of calvaria in bone marrow chimeric mice 1 week after the diphtheria toxin treatment (_n_ = 3
female mice per group). P: Periosteum, B: Bone. Scale bars, 100 μm. Representative data of more than three independent experiments are shown. D, Periosteal thickness of calvaria in bone
marrow chimeric mice 1 week after the diphtheria toxin treatment (_n_ = 3 female mice per group). Data are presented as the mean ± S.D. The _P_ value was determined with an unpaired
two-tailed Student’s _t_-test. E, Images of H&E and TRAP staining of calvarial osteolytic lesions in bone marrow chimeric female mice 1 week after the implantation of HNM007 cells, with
or without diphtheria toxin treatment. Scale bars, 100 μm. Representative data of more than three independent experiments are shown. F, Osteocyte number in the calvarial osteolytic lesions
in bone marrow chimeric female mice 1 week after the implantation of HNM007 cells, with or without diphtheria toxin treatment (_n_ = 5). The _P_ value was determined with an unpaired
two-tailed Student’s _t_-test. Data are presented as the mean ± S.D. G, Osteoclast number in the calvarial osteolytic lesions in bone marrow chimeric female mice 1 week after the
implantation of HNM007 cells, with or without diphtheria toxin treatment (_n_ = 5). The _P_ value was determined with an unpaired two-tailed Student’s _t_-test. Data are presented as the
mean ± S.D. H, Images of immunohistochemistry for Ki-67 in calvarial tissue section of bone marrow chimeric female mice 1 week after the implantation of HNM007 cells, with or without
diphtheria toxin treatment. The red dotted lines represent the interface between tumour and the periosteum/bone. P: Periosteum, B: Bone. T: Tumour. Scale bars, 100 μm. Representative data of
more than three independent experiments are shown.I, Representative micro-CT images of the mandible in bone marrow chimeric mice 1 week after the implantation of HNM007 cells, with or
without diphtheria toxin treatment. Scale bars, 7 mm. Representative data of more than three independent experiments are shown. J, Micro-CT analysis of bone destruction area of the mandible
in bone marrow chimeric female mice 1 week after the implantation of HNM007 cells, with or without diphtheria toxin treatment (_n_ = 5). The _P_ value was determined with an unpaired
two-tailed Student’s _t_-test. Data are presented as the mean ± S.D. Source Data EXTENDED DATA FIG. 9 GENERATION AND CHARACTERIZATION OF _TIMP1_-DEFICIENT MICE. A, Expression pattern of the
_Timp1_ gene in the UMAP visualization. B, Volcano plot depicting differentially (log fold change > 0.36 and P < 0.05 as calculated by two-sided Wilcoxon Rank Sum test) expressed genes
in scratch-negative (pre-invasive stage) and scratch-positive (invasive stage) periosteal cells. Red and blue dots represent genes expressed at higher and lower levels in pre-invasive
stage, respectively. C, Violin plots showing the expression of _Timp1_ in the periosteal cell cluster in the control, scratch-negative and scratch-positive groups. The _P_ values were
determined with two-sided Wilcoxon rank sum test. D, Scheme of the targeting strategy for the _Timp1_ gene. E, Serum Timp1 concentration in the wild-type (_n_ = 4) and Timp1-KO mice (_n_ =
35). The _P_ value was determined with an unpaired two-tailed Student’s _t_-test. Data are presented as the mean ± S.D. F, The sequence region coloured by red denotes the deletion region
obtained with the CRISPR/Cas9 method. The amino acid sequence of wild-type and Timp1-KO mice were shown in lower panels. G, Macroscopic image and body weight of wild-type and Timp1-KO
17-week-old mice (_n_ = 3 female mice per group). The _P_ value was determined with an unpaired two-tailed Student’s _t_-test. Data are presented as the mean ± S.D. H, Representative
micro-CT images and parameters of the femur in wild-type and Timp1-KO 17-week-old female mice (_n_ = 3 mice per group). Scale bars,1 mm. The _P_ values were determined with an unpaired
two-tailed Student’s _t_-test. Data are presented as the mean ± S.D. I,J, Representative micro-CT images (I) and thickness (J) of the calvaria in wild-type and Timp1-KO 17-week-old female
mice (_n_ = 3 mice per group). Scale bars, 3 mm. The _P_ value was determined with an unpaired two-tailed Student’s _t_-test. Data are presented as the mean ± S.D. K, Images of
immunohistochemistry for periostin in calvarial tissue section in wild-type and Timp1-KO 17-week-old female mice. Red arrows indicate thickness of the periosteum. P: Periosteum, B:Bone.
Scale bars, 100 μm. Representative data of more than three independent experiments are shown. L, Periosteal thickness of wild-type and Timp1-KO 17-week-old female mice (_n_ = 3 mice per
group). Data are presented as the mean ± S.D. The _P_ value was determined with an unpaired two-tailed Student’s _t_-test. Source Data EXTENDED DATA FIG. 10 THE PHENOTYPES OF TIMP1 KO MICE
IN MULTIPLE HNSCC MODELS. A, Representative IVIS images of wild-type male (_n_ = 6) and Timp1-KO male (_n_ = 5) mice 18 days after the implantation of HNM007 cells without scratching the
periosteum. Red circles show region of interest (ROI) for the radiance analysis. Data are displayed in radiance units (p/s/cm2/sr). The _P_ value was determined with an unpaired two-tailed
Student’s _t_-test. Data are presented as the mean ± S.D. B, Tumour mass of wild-type male (_n_ = 6) and Timp1-KO male (_n_ = 5) mice 18 days after the implantation of HNM007 cells without
scratching the periosteum. The _P_ value was determined with an unpaired two-tailed Student’s _t_-test. Data are presented as the mean ± S.D. C, Representative IVIS images of wild-type and
Timp1-KO mice 1 week after the implantation of HNM007 cells without scratching the periosteum. Red circles show region of interest (ROI) for the radiance analysis. Data are displayed in
radiance units (p/s/cm2/sr). (_n_ = 6 male mice per group). The _P_ value was determined with an unpaired two-tailed Student’s _t_-test. Data are presented as the mean ± S.D. D,E,
Representative Micro-CT images (D) and bone destruction area (E) of wild-type male (_n_ = 7) and Timp1-KO male mice (_n_ = 12) 1 week after the implantation of HNM007 cells without
scratching the periosteum. Scale bars, 7 mm. The _P_ value was determined with an unpaired two-tailed Student’s _t_-test. Data are presented as the mean ± S.D. F,G, Representative micro-CT
images (F) and bone destruction area (G) of the calvarial osteolytic lesions in wild-type female (_n_ = 5) and Timp1-KO female mice (_n_ = 5) 10 days after the implantation of AKR cells
without scratching the periosteum. Scale bars, 7 mm. The _P_ value was determined with an unpaired two-tailed Student’s _t_-test. Data are presented as the mean ± S.D. H,I, Representative
micro-CT images (H) and bone destruction area (I) of the calvarial osteolytic lesions in wild-type male (_n_ = 5) and Timp1-KO male mice (_n_ = 5) 2 weeks after the implantation of NOOC1
cells without scratching the periosteum. Scale bars, 7 mm. The _P_ value was determined with an unpaired two-tailed Student’s _t_-test. Data are presented as the mean ± S.D. J, Images of
H&E and TRAP staining of calvarial osteolytic lesions in wild-type male and Timp1-KO male mice 1 week after the implantation of HNM007 cells without scratching the periosteum.
Representative data of more than three independent experiments are shown. Scale bars, 100 μm. K, Osteoclast number in the calvaria of the wild-type or Timp1-KO mice 1 week after the
implantation of HNM007 cells without scratching the periosteum (_n_ = 6 male mice per group). The _P_ value was determined with an unpaired two-tailed Student’s _t_-test. Data are presented
as the mean ± S.D. L, Immunofluorescence images for DAPI, periostin, type I collagen and pan-keratin in calvarial tissue section of the wild-type male and Timp1-KO male mice. P: Periosteum,
B: Bone, T: Tumour. Scale bars, 100 μm. Representative data of more than three independent experiments are shown. M, Thickness of the type I collagen+ and periostin+ layer in wild-type and
Timp1-KO mice 1 week after the implantation of HNM007 cells without scratching the periosteum (_n_ = 5 male mice per group). The _P_ value was determined with an unpaired two-tailed
Student’s _t_-test. Data are presented as the mean ± S.D. N, The experimental setting for the prophylactic administration of recombinant TIMP-1 in Fig. 3g,h. O, The experimental setting for
the prophylactic administration of recombinant TIMP-1 before the implantation of HNM007 cells in Fig. 3i,j. Source Data EXTENDED DATA FIG. 11 THE EXPRESSION PATTERNS OF PROTEASES, ECM
FACTORS AND CD63. A, Dot plot showing the expression of proteases and ECM factors in periosteal cells at steady state. B, Dot plot showing the expression of proteases in each cluster in
control and scratch negative (pre-invasive stage) groups. C, Violin plots showing the expression of _Lamp3_ (CD63) in each cluster. EXTENDED DATA FIG. 12 REGULATION OF TIMP1 EXPRESSION BY
HIF1Α SIGNALLING. A, H3K27ac ChIP–seq, H3K4me ChIP-seq and HIF1α ChIP-seq within the _Timp1_ gene locus in periosteal cells derived from the pre-invasive stage. B, H3K27ac ChIP–seq, H3K4me1
ChIP-seq and DNase-seq in human osteogenic cells, ARNT ChIP-seq in K562 cell line and RNA Pol II ChIA–PET in WTC11 cells within the _Timp1_ gene locus. C, The cell types and accession number
of epigenomic datasets used in (B). D, The effect of hypoxia on the _TIMP1_ expression in the human pulmonary endothelial cells (GSE157231). The TPM normalized expression values were
calculated by using GEO2R (n = 4 per group). The _P_ value was determined with an unpaired two-tailed Student’s _t_-test. Data are presented as the mean ± S.D. E, The effect of hypoxia on
the _TIMP1_ expression in the human pulmonary microvascular endothelial cells (GSE 53510). The TPM normalized expression values were calculated by using GEO2R (n = 3 per group). The _P_
value was determined with an unpaired two-tailed Student’s _t_-test. Data are presented as the mean ± S.D. F, The effect of hypoxia on the _TIMP1_ expression in the primary human fibroblasts
(GSE179848). The TPM normalized expression values were calculated by using GEO2R (n = 7 and 4) The _P_ value was determined with an unpaired two-tailed Student’s _t_-test. Data are
presented as the mean ± S.D. G, The effect of hypoxia on the _TIMP1_ expression in the human dental pulp cells (GSE118046). The TPM normalized expression values were calculated by using
GEO2R (n = 3 per group). The _P_ value was determined with an unpaired two-tailed Student’s _t_-test. Data are presented as the mean ± S.D. H, Immunohistochemistry (IHC) with a TIMP-1
antibody in human HNSCC lesions. P: Periosteum, B: Bone. Scale bar, 100 μm. Representative data of more than three independent experiments are shown. I, IHC score based on the percentage of
TIMP1-positive cells in human HNSCC lesions (_n_ = 8 biologically independent samples). Scale bars, 100 μm. The _P_ value was determined with an unpaired two-tailed Student’s _t_-test. Data
are presented as the mean ± S.D. J, IHC with a HIF1α antibody in human HNSCC lesions. P: Periosteum, B: Bone, T: Tumours. Scale bar, 100 μm. Representative data of more than three
independent experiments are shown. K, IHC score based on the percentage of HIF1α -positive cells in human HNSCC lesions (_n_ = 8). Scale bars, 100 μm. The _P_ value was determined with an
unpaired two-tailed Student’s _t_-test.Data are presented as the mean ± S.D. L, IHC with a HIF1α antibody in mouse HNSCC lesions. P: Periosteum, B: Bone, T: Tumours. Scale bar, 100 μm.
Representative data of more than three independent experiments are shown. M, IHC score based on the percentage of HIF1α -positive cells in mouse HNSCC lesions (_n_ = 5). Scale bars, 100 μm.
The _P_ value was determined with an unpaired two-tailed Student’s _t_-test. Data are presented as the mean ± S.D. N, Transcription factor network analysis on upregulated genes in the CD45–
periosteal stromal cell cluster during fracture healing (GSE195940). The _P_ values were determined with right-tailed Fisher’s exact tests adjusted with Benjamini–Hochberg multiple-testing
correction.O, Violin plots showing the expression of _Timp1_ in the CD45– periosteal stromal cell cluster in the control and fracture healing groups (GSE195940). The _P_ value was determined
with two-sided Wilcoxon rank sum test. P, Violin plots showing the expression of _Hif1a_ in the CD45– periosteal stromal cell cluster in the control and fracture healing groups (GSE195940).
The _P_ value was determined with two-sided Wilcoxon rank sum test. Source Data SUPPLEMENTARY INFORMATION REPORTING SUMMARY SOURCE DATA SOURCE DATA FIG. 1 SOURCE DATA FIG. 2 SOURCE DATA
FIG. 3 SOURCE DATA FIG. 4 SOURCE DATA EXTENDED DATA FIG. 1 SOURCE DATA EXTENDED DATA FIG. 3 SOURCE DATA EXTENDED DATA FIG. 5 SOURCE DATA EXTENDED DATA FIG. 8 SOURCE DATA EXTENDED DATA FIG. 9
SOURCE DATA EXTENDED DATA FIG. 10 SOURCE DATA EXTENDED DATA FIG. 12 RIGHTS AND PERMISSIONS Springer Nature or its licensor (e.g. a society or other partner) holds exclusive rights to this
article under a publishing agreement with the author(s) or other rightsholder(s); author self-archiving of the accepted manuscript version of this article is solely governed by the terms of
such publishing agreement and applicable law. Reprints and permissions ABOUT THIS ARTICLE CITE THIS ARTICLE Nakamura, K., Tsukasaki, M., Tsunematsu, T. _et al._ The periosteum provides a
stromal defence against cancer invasion into the bone. _Nature_ 634, 474–481 (2024). https://doi.org/10.1038/s41586-024-07822-1 Download citation * Received: 04 August 2023 * Accepted: 12
July 2024 * Published: 21 August 2024 * Issue Date: 10 October 2024 * DOI: https://doi.org/10.1038/s41586-024-07822-1 SHARE THIS ARTICLE Anyone you share the following link with will be able
to read this content: Get shareable link Sorry, a shareable link is not currently available for this article. Copy to clipboard Provided by the Springer Nature SharedIt content-sharing
initiative