- Select a language for the TTS:
- UK English Female
- UK English Male
- US English Female
- US English Male
- Australian Female
- Australian Male
- Language selected: (auto detect) - EN
Play all audios:
ABSTRACT KRAS GTPases are activated in one-third of cancers, and KRAS(G12C) is one of the most common activating alterations in lung adenocarcinoma1,2. KRAS(G12C) inhibitors3,4 are in
phase-I clinical trials and early data show partial responses in nearly half of patients with lung cancer. How cancer cells bypass inhibition to prevent maximal response to therapy is not
understood. Because KRAS(G12C) cycles between an active and inactive conformation4,5,6, and the inhibitors bind only to the latter, we tested whether isogenic cell populations respond in a
non-uniform manner by studying the effect of treatment at a single-cell resolution. Here we report that, shortly after treatment, some cancer cells are sequestered in a quiescent state with
low KRAS activity, whereas others bypass this effect to resume proliferation. This rapid divergent response occurs because some quiescent cells produce new KRAS(G12C) in response to
suppressed mitogen-activated protein kinase output. New KRAS(G12C) is maintained in its active, drug-insensitive state by epidermal growth factor receptor and aurora kinase signalling. Cells
without these adaptive changes—or cells in which these changes are pharmacologically inhibited—remain sensitive to drug treatment, because new KRAS(G12C) is either not available or exists
in its inactive, drug-sensitive state. The direct targeting of KRAS oncoproteins has been a longstanding objective in precision oncology. Our study uncovers a flexible non-uniform fitness
mechanism that enables groups of cells within a population to rapidly bypass the effect of treatment. This adaptive process must be overcome if we are to achieve complete and durable
responses in the clinic. Access through your institution Buy or subscribe This is a preview of subscription content, access via your institution ACCESS OPTIONS Access through your
institution Access Nature and 54 other Nature Portfolio journals Get Nature+, our best-value online-access subscription $29.99 / 30 days cancel any time Learn more Subscribe to this journal
Receive 51 print issues and online access $199.00 per year only $3.90 per issue Learn more Buy this article * Purchase on SpringerLink * Instant access to full article PDF Buy now Prices may
be subject to local taxes which are calculated during checkout ADDITIONAL ACCESS OPTIONS: * Log in * Learn about institutional subscriptions * Read our FAQs * Contact customer support
SIMILAR CONTENT BEING VIEWED BY OTHERS MEDIATOR KINASE INHIBITION IMPEDES TRANSCRIPTIONAL PLASTICITY AND PREVENTS RESISTANCE TO ERK/MAPK-TARGETED THERAPY IN _KRAS_-MUTANT CANCERS Article
Open access 31 May 2024 RAPID SIGNALING REACTIVATION AFTER TARGETED BRAF INHIBITION PREDICTS THE PROLIFERATION OF INDIVIDUAL MELANOMA CELLS FROM AN ISOGENIC POPULATION Article Open access 29
July 2021 IRS1 PHOSPHORYLATION UNDERLIES THE NON-STOCHASTIC PROBABILITY OF CANCER CELLS TO PERSIST DURING EGFR INHIBITION THERAPY Article 21 October 2021 DATA AVAILABILITY The data that
support the findings of this study are available within the paper and its Supplementary Information files. Source Data for Figs. 1–4 and Extended Data Figs. 2–9 are provided with the paper.
The scRNA-seq data have been deposited in the Gene Expression Omnibus (GEO) with the accession code GSE137912. Data or other materials are available from the corresponding author upon
reasonable request. CODE AVAILABILITY The analysis was performed using standard protocols with previously described computational tools. The scripts, along with the processed files described
in the Methods, are available from the corresponding author upon reasonable request. REFERENCES * Pylayeva-Gupta, Y., Grabocka, E. & Bar-Sagi, D. RAS oncogenes: weaving a tumorigenic
web. _Nat. Rev. Cancer_ 11, 761–774 (2011). Article CAS PubMed PubMed Central Google Scholar * Li, S., Balmain, A. & Counter, C. M. A model for RAS mutation patterns in cancers:
finding the sweet spot. _Nat. Rev. Cancer_ 18, 767–777 (2018). Article CAS PubMed Google Scholar * Ostrem, J. M., Peters, U., Sos, M. L., Wells, J. A. & Shokat, K. M. K-Ras(G12C)
inhibitors allosterically control GTP affinity and effector interactions. _Nature_ 503, 548–551 (2013). Article ADS CAS PubMed PubMed Central Google Scholar * Patricelli, M. P. et al.
Selective inhibition of oncogenic KRAS output with small molecules targeting the inactive state. _Cancer Discov_. 6, 316–329 (2016). Article CAS PubMed Google Scholar * Lito, P.,
Solomon, M., Li, L. S., Hansen, R. & Rosen, N. Allele-specific inhibitors inactivate mutant KRAS G12C by a trapping mechanism. _Science_ 351, 604–608 (2016). Article ADS CAS PubMed
PubMed Central Google Scholar * Simanshu, D. K., Nissley, D. V. & McCormick, F. RAS proteins and their regulators in human disease. _Cell_ 170, 17–33 (2017). Article CAS PubMed
PubMed Central Google Scholar * Hunter, J. C. et al. Biochemical and structural analysis of common cancer-associated KRAS mutations. _Mol. Cancer Res_. 13, 1325–1335 (2015). Article CAS
PubMed Google Scholar * Zeng, M. et al. Potent and selective covalent quinazoline inhibitors of KRAS G12C. Cell _Chem. Biol_. 24, 1005–1016 (2017). CAS Google Scholar * Janes, M. R. et
al. Targeting KRAS mutant cancers with a covalent G12C-specific inhibitor. _Cell_ 172, 578–589 (2018). Article CAS PubMed Google Scholar * Corcoran, R. B. et al. EGFR-mediated
re-activation of MAPK signaling contributes to insensitivity of _BRAF_ mutant colorectal cancers to RAF inhibition with vemurafenib. _Cancer Discov_. 2, 227–235 (2012). Article CAS PubMed
PubMed Central Google Scholar * Prahallad, A. et al. Unresponsiveness of colon cancer to BRAF(V600E) inhibition through feedback activation of EGFR. _Nature_ 483, 100–103 (2012). Article
ADS CAS PubMed Google Scholar * Lito, P., Rosen, N. & Solit, D. B. Tumor adaptation and resistance to RAF inhibitors. _Nat. Med_. 19, 1401–1409 (2013). Article CAS PubMed Google
Scholar * Grün, D. & van Oudenaarden, A. Design and analysis of single-cell sequencing experiments. _Cell_ 163, 799–810 (2015). Article PubMed CAS Google Scholar * Stuart, T. &
Satija, R. Integrative single-cell analysis. _Nat. Rev. Genet_. 20, 257–272 (2019). Article CAS PubMed Google Scholar * Risso, D., Perraudeau, F., Gribkova, S., Dudoit, S. & Vert,
J. P. A general and flexible method for signal extraction from single-cell RNA-seq data. _Nat. Commun_. 9, 284 (2018). Article ADS PubMed PubMed Central CAS Google Scholar * Trapnell,
C. et al. The dynamics and regulators of cell fate decisions are revealed by pseudotemporal ordering of single cells. _Nat. Biotechnol_. 32, 381–386 (2014). Article CAS PubMed PubMed
Central Google Scholar * Street, K. et al. Slingshot: cell lineage and pseudotime inference for single-cell transcriptomics. _BMC Genomics_ 19, 477 (2018). Article PubMed PubMed Central
CAS Google Scholar * Cheung, T. H. & Rando, T. A. Molecular regulation of stem cell quiescence. _Nat. Rev. Mol. Cell Biol_. 14, 329–340 (2013). Article CAS PubMed Google Scholar
* Oki, T. et al. A novel cell-cycle-indicator, mVenus–p27K−, identifies quiescent cells and visualizes G0–G1 transition. _Sci. Rep_. 4, 4012 (2014). Article PubMed PubMed Central CAS
Google Scholar * Lemmon, M. A. & Schlessinger, J. Cell signaling by receptor tyrosine kinases. _Cell_ 141, 1117–1134 (2010). Article CAS PubMed PubMed Central Google Scholar *
Drosten, M. et al. Genetic analysis of Ras signalling pathways in cell proliferation, migration and survival. _EMBO J_. 29, 1091–1104 (2010). Article CAS PubMed PubMed Central Google
Scholar * Katayama, H. et al. Phosphorylation by aurora kinase A induces Mdm2-mediated destabilization and inhibition of p53. _Nat. Genet_. 36, 55–62 (2004). Article CAS PubMed Google
Scholar * Lim, K. H. et al. Aurora-A phosphorylates, activates, and relocalizes the small GTPase RalA. _Mol. Cell. Biol_. 30, 508–523 (2010). Article CAS PubMed Google Scholar *
Umstead, M., Xiong, J., Qi, Q., Du, Y. & Fu, H. Aurora kinase A interacts with H-Ras and potentiates Ras–MAPK signaling. _Oncotarget_ 8, 28359–28372 (2017). Article PubMed PubMed
Central Google Scholar * Gong, X. et al. Aurora A kinase inhibition is synthetic lethal with loss of the _RB1_ tumor suppressor gene. _Cancer Discov_. 9, 248–263 (2019). Article PubMed
CAS Google Scholar * Donnella, H. J. et al. Kinome rewiring reveals AURKA limits PI3K-pathway inhibitor efficacy in breast cancer. _Nat. Chem. Biol_. 14, 768–777 (2018). Article CAS
PubMed PubMed Central Google Scholar * Shah, K. N. et al. Aurora kinase A drives the evolution of resistance to third-generation EGFR inhibitors in lung cancer. _Nat. Med_. 25, 111–118
(2019). Article CAS PubMed Google Scholar * Keen, N. & Taylor, S. Aurora-kinase inhibitors as anticancer agents. _Nat. Rev. Cancer_ 4, 927–936 (2004). Article CAS PubMed Google
Scholar * Sunaga, N. et al. Knockdown of oncogenic KRAS in non-small cell lung cancers suppresses tumor growth and sensitizes tumor cells to targeted therapy. _Mol. Cancer Ther_. 10,
336–346 (2011). Article CAS PubMed PubMed Central Google Scholar * Fakih, M. et al. Phase 1 study evaluating the safety, tolerability, pharmacokinetics (PK), and efficacy of AMG 510, a
novel small molecule _KRAS_ _G12C_ inhibitor, in advanced solid tumors. _J. Clin. Oncol_. 37, 3003 (2019). Article Google Scholar * Klein, A. M. et al. Droplet barcoding for single-cell
transcriptomics applied to embryonic stem cells. _Cell_ 161, 1187–1201 (2015). Article CAS PubMed PubMed Central Google Scholar * Macosko, E. Z. et al. Highly parallel genome-wide
expression profiling of individual cells using nanoliter droplets. _Cell_ 161, 1202–1214 (2015). Article CAS PubMed PubMed Central Google Scholar * Azizi, E. et al. Single-cell map of
diverse immune phenotypes in the breast tumor microenvironment. _Cell_ 174, 1293–1308 (2018). Article CAS PubMed PubMed Central Google Scholar * van Dijk, D. et al. Recovering gene
interactions from single-cell data using data diffusion. _Cell_ 174, 716–729 (2018). Article PubMed PubMed Central CAS Google Scholar * Huber, W. et al. Orchestrating high-throughput
genomic analysis with Bioconductor. _Nat. Methods_ 12, 115–121 (2015). Article CAS PubMed PubMed Central Google Scholar * McCarthy, D. J., Campbell, K. R., Lun, A. T. & Wills, Q. F.
Scater: pre-processing, quality control, normalization and visualization of single-cell RNA-seq data in R. _Bioinformatics_ 33, 1179–1186 (2017). CAS PubMed PubMed Central Google Scholar
* Vallejos, C. A., Risso, D., Scialdone, A., Dudoit, S. & Marioni, J. C. Normalizing single-cell RNA sequencing data: challenges and opportunities. _Nat. Methods_ 14, 565–571 (2017).
Article CAS PubMed PubMed Central Google Scholar * Lun, A. T., McCarthy, D. J. & Marioni, J. C. A step-by-step workflow for low-level analysis of single-cell RNA-seq data with
Bioconductor. _F1000Res_. 5, 2122 (2016). PubMed PubMed Central Google Scholar * Haghverdi, L., Buettner, F. & Theis, F. J. Diffusion maps for high-dimensional single-cell analysis of
differentiation data. _Bioinformatics_ 31, 2989–2998 (2015). Article CAS PubMed Google Scholar * Rodriguez, A. & Laio, A. Clustering by fast search and find of density peaks.
_Science_ 344, 1492–1496 (2014). Article ADS CAS PubMed Google Scholar * Cannoodt, R., Saelens, W. & Saeys, Y. Computational methods for trajectory inference from single-cell
transcriptomics. _Eur. J. Immunol_. 46, 2496–2506 (2016). Article CAS PubMed Google Scholar * Van den Berge, K. et al. Observation weights unlock bulk RNA-seq tools for zero inflation
and single-cell applications. _Genome Biol_. 19, 24 (2018). Article PubMed PubMed Central CAS Google Scholar * Ritchie, M. E. et al. limma powers differential expression analyses for
RNA-sequencing and microarray studies. _Nucleic Acids Res_. 43, e47 (2015). Article PubMed PubMed Central Google Scholar * Robinson, M. D., McCarthy, D. J. & Smyth, G. K. edgeR: a
Bioconductor package for differential expression analysis of digital gene expression data. _Bioinformatics_ 26, 139–140 (2010). Article CAS PubMed Google Scholar * Risso, D., Ngai, J.,
Speed, T. P. & Dudoit, S. Normalization of RNA-seq data using factor analysis of control genes or samples. _Nat. Biotechnol_. 32, 896–902 (2014). Article CAS PubMed PubMed Central
Google Scholar * Wu, D. et al. ROAST: rotation gene set tests for complex microarray experiments. _Bioinformatics_ 26, 2176–2182 (2010). Article CAS PubMed PubMed Central Google Scholar
* Sanson, K. R. et al. Optimized libraries for CRISPR–Cas9 genetic screens with multiple modalities. _Nat. Commun_. 9, 5416 (2018). Article ADS CAS PubMed PubMed Central Google
Scholar * Li, W. et al. MAGeCK enables robust identification of essential genes from genome-scale CRISPR/Cas9 knockout screens. _Genome Biol_. 15, 554 (2014). Article PubMed PubMed
Central CAS Google Scholar * Lito, P. et al. Disruption of CRAF-mediated MEK activation is required for effective MEK inhibition in KRAS mutant tumors. _Cancer Cell_ 25, 697–710 (2014).
Article CAS PubMed PubMed Central Google Scholar * Lito, P. et al. Relief of profound feedback inhibition of mitogenic signaling by RAF inhibitors attenuates their activity in BRAFV600E
melanomas. _Cancer Cell_ 22, 668–682 (2012). Article CAS PubMed PubMed Central Google Scholar * Xue, Y. et al. An approach to suppress the evolution of resistance in BRAFV600E-mutant
cancer. _Nat. Med_. 23, 929–937 (2017). Article CAS PubMed PubMed Central Google Scholar * He, L. et al. Methods for high-throughput drug combination screening and synergy scoring.
_Methods Mol. Biol_. 1711, 351–398 (2018). Article CAS PubMed PubMed Central Google Scholar Download references ACKNOWLEDGEMENTS The authors thank C. Sawyers and M. Mroczkowski for
their insight on the manuscript; R. Garippa for his advice on the CRISPR screen; and P. Jallepalli for his help with the interpretation of the AURKA findings. This work has been supported in
part by the NIH/NCI (1R01CA23074501 to P.L., 1R01CA23026701A1 to P.L., K08CA191082-01A1 to P.L. and 1F30CA232549-01 to J.Y.X.). P.L. is also supported in part by The Pew Charitable Trusts,
the Damon Runyon Cancer Research Foundation and the American Lung Association. E.d.S. is supported in part by the MSKCC Pilot Center for Precision Disease Modeling program (U54 OD020355).
D.R. is supported by Programma per Giovani Ricercatori Rita Levi Montalcini granted by the Italian Ministry of Education, University and Research. The authors acknowledge the Josie Robertson
Investigator Program at MSKCC, a Medical Scientist Training Program grant to the Weill Cornell–Rockefeller–Sloan Kettering Tri-Institutional MD-PhD Program (T32GM007739) and the MSKCC
Support Grant-Core Grant program (P30 CA008748). AUTHOR INFORMATION Author notes * These authors contributed equally: Jenny Y. Xue, Yulei Zhao AUTHORS AND AFFILIATIONS * Human Oncology and
Pathogenesis Program, Memorial Sloan Kettering Cancer Center, New York, NY, USA Jenny Y. Xue, Yulei Zhao, Jordan Aronowitz, Trang T. Mai, Alberto Vides, Dongsung Kim, Chuanchuan Li &
Piro Lito * Tri-Institutional MD-PhD Program, Weill Cornell Medical College and Rockefeller University and Memorial Sloan Kettering Cancer Center, New York, NY, USA Jenny Y. Xue & Piro
Lito * Antitumor Assessment Core Facility, Memorial Sloan Kettering Cancer Center, New York, NY, USA Besnik Qeriqi & Elisa de Stanchina * Computational and Systems Biology, Memorial
Sloan Kettering Cancer Center, New York, NY, USA Linas Mazutis * Department of Statistical Sciences, University of Padova, Padua, Italy Davide Risso * Department of Healthcare Policy and
Research, Weill Cornell Medical College, New York, NY, USA Davide Risso * Department of Medicine, Memorial Sloan Kettering Cancer Center, New York, NY, USA Piro Lito * Department of
Medicine, Weill Cornell Medical College, New York, NY, USA Piro Lito Authors * Jenny Y. Xue View author publications You can also search for this author inPubMed Google Scholar * Yulei Zhao
View author publications You can also search for this author inPubMed Google Scholar * Jordan Aronowitz View author publications You can also search for this author inPubMed Google Scholar *
Trang T. Mai View author publications You can also search for this author inPubMed Google Scholar * Alberto Vides View author publications You can also search for this author inPubMed
Google Scholar * Besnik Qeriqi View author publications You can also search for this author inPubMed Google Scholar * Dongsung Kim View author publications You can also search for this
author inPubMed Google Scholar * Chuanchuan Li View author publications You can also search for this author inPubMed Google Scholar * Elisa de Stanchina View author publications You can also
search for this author inPubMed Google Scholar * Linas Mazutis View author publications You can also search for this author inPubMed Google Scholar * Davide Risso View author publications
You can also search for this author inPubMed Google Scholar * Piro Lito View author publications You can also search for this author inPubMed Google Scholar CONTRIBUTIONS J.Y.X., Y.Z. and
P.L. designed the study and analysed data. J.Y.X., Y.Z., J.A., A.V., T.T.M., D.K. and C.L. performed experiments. B.Q. and E.d.S. helped to perform in vivo studies. L.M. and D.R. helped to
carry out the scRNA-seq experiment and performed statistical data analysis, respectively. J.Y.X., Y.Z. and P.L. were the main writers of the manuscript, with considerable help from D.R. All
other authors reviewed the manuscript and contributed to writing it. P.L. conceived and supervised the study. CORRESPONDING AUTHOR Correspondence to Piro Lito. ETHICS DECLARATIONS COMPETING
INTERESTS MSKCC has received research funds from companies developing G12C inhibitors and has confidentiality agreements with these companies. A part of these funds is allocated for research
to be conducted under the supervision of P.L. These funds were not used to support the work in this paper. The experiments in this paper were performed with commercially available
inhibitors. P.L. has not received honoraria, consultation fees, stock options or travel reimbursement from such companies. ADDITIONAL INFORMATION PEER REVIEW INFORMATION _Nature_ thanks
Frank McCormick, Arjun Raj and the other, anonymous, reviewer(s) for their contribution to the peer review of this work. PUBLISHER’S NOTE Springer Nature remains neutral with regard to
jurisdictional claims in published maps and institutional affiliations. EXTENDED DATA FIGURES AND TABLES EXTENDED DATA FIG. 1 THE EFFECT OF THE G12CI TREATMENT ON KRAS SIGNALLING ACROSS LUNG
CANCER CELL LINES. The indicated models were treated with increasing concentrations of the G12Ci (ARS1620) for 2 h (top panels) or with 10 μM over time (bottom panels), and immunoblotted to
determine the effect on KRAS signalling intermediates. Key genetic alterations found at baseline in the KRAS(G12C)-mutant cell lines used in this study are listed. A representative of two
independent experiments for each cell line is shown. EXTENDED DATA FIG. 2 QUALITY ASSESSMENT AND PROCESSING OF SCRNA-SEQ DATA. A, B, Gene counts as a function of UMI count. Cells are grouped
by length of G12Ci treatment (A) or tumour model (B). C, The number of cells expressing a gene, as a function of its average count across the dataset. D, Variance as a function of mean
expression. Technical variance (that is, variability attributed to technical factors) was calculated by the expression of ribosomal genes. _n_ = 10,177 single cells in A–D. E, The per cent
of variance explained by various experimental factors. A number of variables had a meaningful contribution to the variance of the dataset (that is, they accounted for greater than 1% of the
variation), suggesting the need to correct for these potentially confounding factors in downstream analysis. F, Dimensionality reduction and covariate regression using the ZINB-WaVE
algorithm. The _K_ parameter of 2 was chosen, as this minimizes batch and other covariate effects. G, _t_-SNE projection showing single cells coloured by length of inhibitor treatment. H,
Parameters used to cluster cells by using the Density Cluster algorithm. I, Cluster distribution in the indicated projections (top) and cell line composition of each cluster (bottom),
showing a similar representation of cells from different tumour models in each cluster. J, Silhouette-width analysis to assess the appropriateness of clustering. Negative values indicate
cells that have been inappropriately assigned. K, _t_-SNE projection of KRAS(G12C) single cells with the three inhibitory trajectories identified by the Slingshot algorithm. Source data
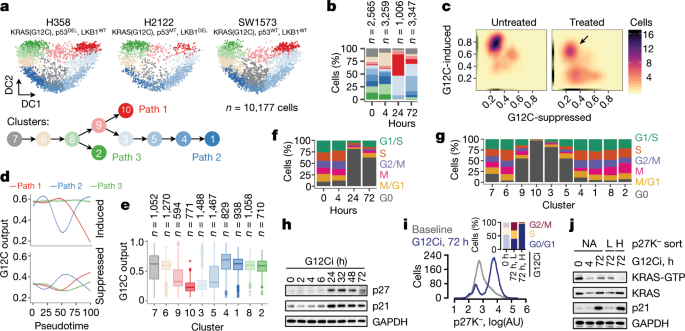
EXTENDED DATA FIG. 3 KRAS(G12C)-DEPENDENT TRANSCRIPTIONAL OUTPUT SCORE IN 10,177 LUNG CANCER CELLS. A, The distribution of KRAS(G12C)-specific gene-expression output score across single
cells in the three tumour models under study. The arrows denote cohorts of cells with high output despite treatment. B, Density plots showing the effect of G12Ci treatment on the KRAS(G12C)
output score (_n_ = 2,565 single cells from 0 h, _n_ = 3,259 single cells from 4 h, _n_ = 1,006 single cells from 24 h and _n_ = 3,347 single cells from 72 h). At 72 h the cells assume an
asymmetric distribution, suggesting that a subpopulation of KRAS(G12C) cells has adapted to treatment by reactivating KRAS(G12C)-dependent output (arrow). C, The KRAS(G12C) output score as a
function of pseudotime (which was adjusted to allow comparisons between trajectories). The trend line was derived by fitting a spline to the G12C output score for each cell (_n_ = 4,759
single cells in path 1, _n_ = 8,653 single cells in path 2 and _n_ = 4,050 single cells in path 3). D, E, The indicated variables are plotted for each cell in a two-dimensional _t_-SNE (D)
or diffusion component (E) space. For simplicity, only the key clusters delineating each trajectory are shown in E. Source data EXTENDED DATA FIG. 4 G12CI TREATMENT INDUCES QUIESCENCE IN A
SUBPOPULATION OF CANCER CELLS. A, Single cells were analysed to determine gene-expression signatures that correlated with the inhibitory fates. The top 20 signatures in each direction are
shown. B, The overlap in the cycle-specific gene-expression signatures used to classify cells along their cell-cycle phase. The G0 and G1 phase signatures comprise mostly non-overlapping
genes. C, A heat map of cell-cycle-specific gene-expression scores across each cell. Values were scaled across columns. D, Effect of G12Ci on cell-cycle distribution across treatment time
and tumour models. E, The cell lines were treated as shown, to determine the level of p27 expression by immunoblotting. A representative of two independent experiments is shown for all
except H2030, which was assayed once. F, KRAS(G12C)-mutant cells (H358) were synchronized with double thymidine treatment and then released in the presence or absence of G12Ci treatment,
followed by cell-cycle analysis using propidium iodide staining. This assay cannot distinguish G0 from G1. TT, double thymidine. A representative of two independent experiments is shown.
Source data EXTENDED DATA FIG. 5 BIOSENSOR VALIDATION OF THE DIVERGENT RESPONSE TO G12CI TREATMENT. A, Cells expressing the quiescence biosensor (H358, p27K−) were treated and rechallenged
with the G12Ci to determine the effect on quiescence (that is, p27K− high peak) at the indicated times. B, C, The cells were treated with the indicated inhibitors for 72 h to determine the
effect on cell number (B, _n_ = 2 biological replicates) or the distribution of biosensor expression (C). D, Comparison of the KRAS(G12C) output score between proliferating and quiescent
cells. The transcriptional output signature score derived from scRNA-seq analysis is similar to the KRAS–GTP levels determined by RBD pull-down in Fig. 1j. E, The cells were exposed to a
single treatment (0–72 h) or drug rechallenge (+) for 2 h or 24 h. Cell extracts were evaluated by immunoblotting. F, The indicated KRAS(G12C)-mutant lung cancer cell lines were treated with
the G12Ci for 72 h followed by drug rechallenge for 4 h. The percentage inhibition in KRAS–GTP/total was determined by comparing baseline versus 4-h G12Ci and 72-h G12Ci versus 72-h + 4-h
G12Ci. A representative of two experimental repeats is shown in A, E. Source data EXTENDED DATA FIG. 6 GENES WITH TRAJECTORY-SPECIFIC EXPRESSION PROFILES. A, Single cells were analysed to
identify differentially expressed genes by contrasting paths 1 and 2. The top 50 genes are shown. The teal dots indicate genes that were validated in subsequent experiments. B, A CRISPR–Cas9
screen was carried out in H358 cells to help to narrow down the list of genes with trajectory-specific expression (by identifying and focusing on genes modulating the antiproliferative
effect of the G12Ci). The schematic is not drawn to scale. Preference was given to genes with two or more sgRNAs that were downregulated by at least twofold in the G12Ci versus _t_0
comparison and that were also identified as having trajectory-specific expression in the scRNA-seq analysis. Pathways with several intermediates represented were prioritized. The number of
gene-specific sgRNAs that were depleted during G12Ci treatment is also shown. NT, non-targeting control. C, The trend in expression for the indicated genes as a function of pseudotime was
established by fitting a spline to single-cell data. The 95% confidence interval is shown. The pseudotime was adjusted to compare between trajectories. D, The expression of the indicated
genes in proliferating or quiescent cells. Only cells collected during the adaptive phase (24–72 h) of G12Ci treatment are shown. E, The gene false discovery rate (FDR) in the indicated
comparisons across either the entire cohort of cells or the subset of cells collected at the 72-h time point only (_n_ = 4,759 single cells in path 1, _n_ = 8,653 single cells in path 2, _n_
= 4,050 single cells in path 3, _n_ = 6,599 single cells in G1S, S, G2M, M or MG1 (proliferating) and _n_ = 3,578 single cells in G0 (quiescent). Source data EXTENDED DATA FIG. 7 THE
ADAPTIVE REACTIVATION OF KRAS DURING G12CI TREATMENT IS DEPENDENT ON EGFR SIGNALLING. A, The cells were treated with the G12Ci over time to determine the effect on HBEGF expression. mRNA
expression was determined by scRNA-seq (mean, _n_ > 1,000 single cells per time point, see Fig. 1b) or by quantitative PCR (qPCR, mean ± s.e.m., _n_ = 3). The amount of protein secreted
in the medium was quantified by enzyme-linked immunosorbent assay (mean ± s.e.m., _n_ = 3). Norm., normalized (minimum–maximum). B, Cells transfected with _HBEGF_-specific siRNAs were
treated with increasing concentrations of G12Ci for 72 h to determine the effect on viability (mean ± s.e.m., _n_ = 5). C, Cells treated with the G12Ci for 72 h were stimulated with EGF for
10 min, alone or in combination with the indicated inhibitors. Quiescent cells (p27K− high) were isolated by FACS and their extracts were assayed for active KRAS by RBD pull-down.
Immunoblots were quantified by densitometry and reported as fold change relative to unstimulated. D, E, Untreated or G12Ci-treated (24 h) H358 cells were stimulated with EGF (200 ng ml−1)
for 10 min alone or in combination with the indicated inhibitors. Cell extracts were analysed by immunoblotting (D). The effect of EGF stimulation at baseline (lanes 2–4 versus lane 1) or
after G12Ci treatment (lanes 6–8 versus lane 5) was quantified by densitometry (E). F–I, The indicated _KRAS__G12C_-mutant lung cancer cells (F, G) or HA–KRAS(G12C)-expressing RASless mouse
embryonic fibroblasts (H, I) were treated with the G12Ci alone or in combination with EGFR or SHP2 inhibitors, as shown. Cell extracts were subjected to RBD pull-down to determine the level
of active (GTP-bound) and total KRAS. The HA tag was used to determine the specific effect on KRAS(G12C) (H, I). J, H358 cells were treated with the G12Ci alongside the EGFR inhibitor
gefitinib (EGFRi), the pan-HER inhibitor afatinib (panHERi) or the SHP2 inhibitor SHP099 (SHP2i) to determine the effect on cancer cell growth (top) and the presence of treatment synergy
(bottom), by using the Bliss index. Red denotes synergy. The mean of three biological replicates is shown on top. K, The indicated KRAS(G12C)-mutant cells were treated with increasing
concentration of the G12Ci in the presence of 10%, 2% or 0% serum to determine the effect on cell viability (mean ± s.e.m., _n_ = 3). A representative of two independent experiments is shown
in D, F–I. Unless otherwise indicated, _n_ denotes biological replicates. Source data EXTENDED DATA FIG. 8 AURKA IS INVOLVED IN THE REACTIVATION OF KRAS–GTP DURING G12CI TREATMENT. A,
KRAS(G12C)-mutant lung cancer cells were treated with the G12Ci alone or in combination with AURKA inhibitor (AURKAi, alisertib, 10 μM) or panAURK inhibitor (tozasertib, 10 μM) to determine
the effect on KRAS–GTP levels over time. There is no effect on KRAS–GTP levels with the AURKAi treatment in the absence of the G12Ci treatment. B, RASless mouse embryonic fibroblasts
expressing KRAS(G12C) were treated as shown with the indicated concentrations of AURKAi (μM) to determine the effect on KRAS(G12C)–GTP. C, H358 cells stably transfected with
doxycycline-inducible AURKA (dox AURKA) were treated with the G12Ci in the presence or absence of doxycycline (2 μg ml−1). Extracts from cells were analysed by immunoblotting to determine
the effect on the indicated intermediates. D, H358 doxycycline-inducible AURKA cells were treated as shown and assayed to determine the effect on cell viability (mean + s.e.m, _n_ = 5). A
two-tailed _t_-test _P_ value is shown. E–G, H358 cells stably expressing HA-tagged KRAS G12C under a doxycycline-inducible promoter were treated with doxycycline for 24 h alone (E) or with
the indicated inhibitors (F, G). Cell extracts were immunoprecipitated and immunoblotted as indicated. H, KRAS(G12C)-mutant cell lines were treated as shown to determine the effect on cancer
cell growth (top) and the presence of treatment synergy (bottom), by using the Bliss index. Red denotes synergy. The mean of three biological replicates is shown on top. I, J, Mice bearing
SW1573 (I) or H2122 (J) xenografts were treated with the indicated inhibitors to determine the effect on tumour growth (mean + s.e.m, _n_ = 6 in SW1573, _n_ = 5 in H2122). A two-tailed
_t_-test _P_ value is shown. A representative of at least two independent experiments is shown in A–G. Unless otherwise indicated, _n_ denotes biological replicates. Source data EXTENDED
DATA FIG. 9 INHIBITION OF MAPK SIGNALLING STIMULATES NEW KRAS SYNTHESIS. A, The cells were treated with the indicated inhibitors and analysed to determine the level of _KRAS_ mRNA or KRAS
protein expression (mean ± s.e.m., _n_ = 3). LFC, log2-transformed fold change, relative to 0 h. The indicated _P_ values were determined by ANOVA (_P_ = 0.001) followed by pairwise
comparisons versus baseline, while correcting for multiple hypotheses (using Dunnett’s test in Prism). B, SW1573 (_KRAS__G12C_+/+) cells were transfected with non-targeting (NT) or
_KRAS_-specific siRNAs followed by treatment with the G12Ci and immunoblotting. C, H358 cells engineered to express HA–KRAS(G12C) under a doxycycline-inducible promoter were treated with the
G12Ci, alone or in the presence of doxycycline, to determine the effect on cell viability at 72 h (mean ± s.e.m., _n_ = 3). D, H358 p27K− cells were stably transfected with
doxycycline-inducible siRes-G12C. The cells were transfected with _KRAS__G12C_ siRNA (siG12C) followed by doxycycline (2 μg ml−1) induction. The effect on cell viability is shown as mean ±
s.e.m. (_n_ = 5 without doxycycline, _n_ = 4 with doxycycline). A two-tailed _t_-test _P_ value is shown. E, H358 cells with doxycycline-inducible HA–KRAS(G12C) were treated with doxycycline
(2 μg ml−1) for 24 h in serum-free medium. Then, the cells were exposed to either EGF (200 ng ml−1) followed by the G12Ci (10 μM), or vice versa. Cell extracts were analysed by RBD
pull-down and immunoblotting. The specific effect on KRAS(G12C) was determined by the HA tag. A representative of at least two independent experiments is shown in B, D, E. Unless otherwise
indicated, _n_ denotes biological replicates. Source data EXTENDED DATA FIG. 10 RAPID NON-UNIFORM ADAPTATION TO CONFORMATION-SPECIFIC KRAS(G12C) INHIBITION. Left, at baseline, KRAS(G12C)
cycles between its active (GTP-bound) and inactive (GDP-bound) conformations. Active KRAS(G12C) engages effector signalling, which regulates a transcriptional repertoire (that is, KRAS
output) that is responsible for controlling various cellular functions. Middle, shortly after exposure to G12Ci treatment, KRAS(G12C) is trapped in its inactive state, and eventually the
cancer cell population is sequestered in a low-KRAS output state. These cells stop proliferating and enter quiescence (G0). Right, over time, some cells undergo cell death and others adapt
to the G12Ci to reactivate KRAS transcriptional output, bypassing drug-induced quiescence to resume proliferation. Our model suggests that this occurs because cells with low-KRAS output
produce new KRAS(G12C) protein, which is not bound by the drug. Then, upstream signals operating in distinct cancer cell subpopulations—such as those mediated by EGFR or AURKA—maintain the
new protein in its active, drug-insensitive state. By comparison, in cells in which these upstream signals are not active (or in cells in which these signals are pharmacologically
inactivated), the new KRAS(G12C) spends a longer time in its inactive conformation, in which it can be bound by the drug and inhibited. This multifactorial process gives rise to a
non-uniform treatment response with diverging effects across the cancer cell population. SUPPLEMENTARY INFORMATION SUPPLEMENTARY INFORMATION This file contains the Supplementary Discussion,
Supplementary References, Supplementary Table 1 and Supplementary Figure 1. REPORTING SUMMARY 41586_2019_1884_MOESM3_ESM.CSV Supplementary Data 1.LOGCOUNT MATRIX. Expression matrix of
normalized log-transformed values where rows represent genes and columns represent single-cells. 41586_2019_1884_MOESM4_ESM.CSV Supplementary Data 2.CELL ANNOTATION. Annotation of
single-cells comprising the expression matrix by various parameters. 41586_2019_1884_MOESM5_ESM.CSV Supplementary Data 3.GENE ANNOTATION. Annotation of genes comprising the expression matrix
by various parameters, including FDR from various comparisons. 41586_2019_1884_MOESM6_ESM.CSV Supplementary Data 4.PSEUDOTIME BY TRAJECTORY. The pseudotime value for each single-cells in
each of the three trajectories identified. 41586_2019_1884_MOESM7_ESM.CSV Supplementary Data 5.G12C-DEPENDENT GENES FROM BULK RNASEQ. A list of KRAS G12C induced or suppressed genes
identified by bulk RNA sequencing. 41586_2019_1884_MOESM8_ESM.CSV Supplementary Data 6.G12C-DEPENDENT GENES PRESENT IN SCRNASEQ DATASET. KRAS G12C induced or suppressed genes that were found
to be expressed in the single-cell RNA sequencing dataset. SOURCE DATA SOURCE DATA FIG. 1 SOURCE DATA FIG. 2 SOURCE DATA FIG. 3 SOURCE DATA FIG. 4 SOURCE DATA EXTENDED DATA FIG. 2 SOURCE
DATA EXTENDED DATA FIG. 3 SOURCE DATA EXTENDED DATA FIG. 4 SOURCE DATA EXTENDED DATA FIG. 5 SOURCE DATA EXTENDED DATA FIG. 6 SOURCE DATA EXTENDED DATA FIG. 7 SOURCE DATA EXTENDED DATA FIG. 8
SOURCE DATA EXTENDED DATA FIG. 9 RIGHTS AND PERMISSIONS Reprints and permissions ABOUT THIS ARTICLE CITE THIS ARTICLE Xue, J.Y., Zhao, Y., Aronowitz, J. _et al._ Rapid non-uniform
adaptation to conformation-specific KRAS(G12C) inhibition. _Nature_ 577, 421–425 (2020). https://doi.org/10.1038/s41586-019-1884-x Download citation * Received: 07 May 2019 * Accepted: 31
October 2019 * Published: 08 January 2020 * Issue Date: 16 January 2020 * DOI: https://doi.org/10.1038/s41586-019-1884-x SHARE THIS ARTICLE Anyone you share the following link with will be
able to read this content: Get shareable link Sorry, a shareable link is not currently available for this article. Copy to clipboard Provided by the Springer Nature SharedIt content-sharing
initiative