- Select a language for the TTS:
- UK English Female
- UK English Male
- US English Female
- US English Male
- Australian Female
- Australian Male
- Language selected: (auto detect) - EN
Play all audios:
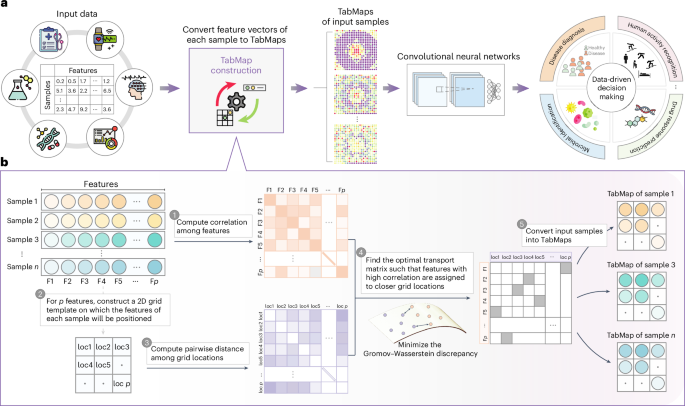
ABSTRACT Tabular data—rows of samples and columns of sample features—are ubiquitously used across disciplines. Yet the tabular representation makes it difficult to discover underlying
associations in the data and thus hinders their analysis and the discovery of useful patterns. Here we report a broadly applicable strategy for unravelling intertwined relationships in
tabular data by reconfiguring each data sample into a spatially semantic 2D topographic map, which we refer to as TabMap. A TabMap preserves the original feature values as pixel intensities,
with the relationships among the features spatially encoded in the map (the strength of two inter-related features correlates with their distance on the map). TabMap makes it possible to
apply 2D convolutional neural networks to extract association patterns in the data to aid data analysis, and offers interpretability by ranking features according to importance. We show the
superior predictive performance of TabMap by applying it to 12 datasets across a wide range of biomedical applications, including disease diagnosis, human activity recognition, microbial
identification and the analysis of quantitative structure–activity relationships. Access through your institution Buy or subscribe This is a preview of subscription content, access via your
institution ACCESS OPTIONS Access through your institution Access Nature and 54 other Nature Portfolio journals Get Nature+, our best-value online-access subscription $29.99 / 30 days cancel
any time Learn more Subscribe to this journal Receive 12 digital issues and online access to articles $119.00 per year only $9.92 per issue Learn more Buy this article * Purchase on
SpringerLink * Instant access to full article PDF Buy now Prices may be subject to local taxes which are calculated during checkout ADDITIONAL ACCESS OPTIONS: * Log in * Learn about
institutional subscriptions * Read our FAQs * Contact customer support SIMILAR CONTENT BEING VIEWED BY OTHERS TRANSFORMING TABULAR DATA INTO IMAGES VIA ENHANCED SPATIAL RELATIONSHIPS FOR CNN
PROCESSING Article Open access 16 May 2025 CONVERTING TABULAR DATA INTO IMAGES FOR DEEP LEARNING WITH CONVOLUTIONAL NEURAL NETWORKS Article Open access 31 May 2021 ENHANCED ANALYSIS OF
TABULAR DATA THROUGH MULTI-REPRESENTATION DEEPINSIGHT Article Open access 04 June 2024 DATA AVAILABILITY The BCTIL dataset is available from the Single Cell Portal
(https://singlecell.broadinstitute.org/single_cell). The TOX-171 and LUNG datasets are available from the scikit-feature repository64. The OncoNPC dataset can be requested from its authors.
Additional datasets used in this study are available from the UCI Machine Learning Repository65. The main data supporting the results in this study are available within the paper and its
Supplementary Information. Source data are provided with this paper. CODE AVAILABILITY The source code for TabMap is available via GitHub at https://github.com/rui-yan/TabMap. All methods
are implemented in Python, using PyTorch as the primary package for model training. The code base is made available for non-commercial and academic purposes. REFERENCES * Shilo, S., Rossman,
H. & Segal, E. Axes of a revolution: challenges and promises of big data in healthcare. _Nat. Med._ 26, 29–38 (2020). Article CAS PubMed Google Scholar * Obermeyer, Z. &
Emanuel, E. J. Predicting the future—big data, machine learning, and clinical medicine. _N. Engl. J. Med._ 375, 1216–1219 (2016). Article PubMed PubMed Central Google Scholar * Marx, V.
The big challenges of big data. _Nature_ 498, 255–260 (2013). Article CAS PubMed Google Scholar * Wu, X., Zhu, X., Wu, G.-Q. & Ding, W. Data mining with big data. _IEEE Trans. Knowl.
Data Eng._ 26, 97–107 (2013). Google Scholar * LaValle, S., Lesser, E., Shockley, R., Hopkins, M. S. & Kruschwitz, N. Big data, analytics and the path from insights to value. _MIT
Sloan Manage. Rev._ 52, 21–32 (2011). Google Scholar * Xing, L., Giger, M. L. & Min, J. K. _Artificial Intelligence in Medicine: Technical Basis and Clinical Applications_ (Academic
Press, 2020). * Wee-Chung Liew, A., Yan, H. & Yang, M. Pattern recognition techniques for the emerging field of bioinformatics: a review. _Pattern Recognit._ 38, 2055–2073 (2005).
Article Google Scholar * Tang, B., Pan, Z., Yin, K. & Khateeb, A. Recent advances of deep learning in bioinformatics and computational biology. _Front. Genet._ 10, 214 (2019). Article
PubMed PubMed Central Google Scholar * Karim, M. R. et al. Deep learning-based clustering approaches for bioinformatics. _Brief. Bioinform._ 22, 393–415 (2021). Article PubMed Google
Scholar * Kiselev, V. Y., Andrews, T. S. & Hemberg, M. Challenges in unsupervised clustering of single-cell RNA-seq data. _Nat. Rev. Genet._ 20, 273–282 (2019). Article CAS PubMed
Google Scholar * Nelder, J. A. & Wedderburn, R. W. M. Generalized linear models. _J. R. Stat. Soc. A_ 135, 370–384 (1972). Article Google Scholar * Tolles, J. & Meurer, W. J.
Logistic regression: relating patient characteristics to outcomes. _JAMA_ 316, 533–534 (2016). Article PubMed Google Scholar * Breiman, L. Random forests. _Mach. Learn._ 45, 5–32 (2001).
Article Google Scholar * Chen, T. &` Guestrin, C. Xgboost: a scalable tree boosting system. In _Proc. 22nd ACM SIGKDD International Conference on Knowledge Discovery and Data Mining_
785–794 (Association for Computing Machinery, 2016). * Alipanahi, B., Delong, A., Weirauch, M. T. & Frey, B. J. Predicting the sequence specificities of DNA-and RNA-binding proteins by
deep learning. _Nat. Biotechnol._ 33, 831–838 (2015). Article CAS PubMed Google Scholar * Ronao, C. A. & Cho, S.-B. Human activity recognition with smartphone sensors using deep
learning neural networks. _Expert Syst. Appl._ 59, 235–244 (2016). Article Google Scholar * Arik, S. Ö. & Pfister, T. Tabnet: attentive interpretable tabular learning. _Proc. AAAI
Conf. Artif. Intell_. 35, 6679–6687 (2021). * Huang, X., Khetan, A., Cvitkovic, M. & Karnin, Z. Tabtransformer: tabular data modeling using contextual embeddings. Preprint at
https://arxiv.org/abs/2012.06678 (2020). * Kadra, A., Lindauer, M., Hutter, F. & Grabocka, J. Well-tuned simple nets excel on tabular datasets. _Adv. Neural Inf. Process. Syst._ 34,
23928–23941 (2021). Google Scholar * Borisov, V. et al. Deep neural networks and tabular data: a survey. _IEEE Trans. Neural Netw. Learn. Syst_. 35, 7499–7519 (2022). * Gorishniy, Y.,
Rubachev, I., Khrulkov, V. & Babenko, A. Revisiting deep learning models for tabular data. _Adv. Neural Inf. Process. Syst._ 34, 18932–18943 (2021). Google Scholar * Shwartz-Ziv, R.
& Armon, A. Tabular data: deep learning is not all you need. _Inf. Fusion_ 81, 84–90 (2022). Article Google Scholar * Zhu, Y. et al. Converting tabular data into images for deep
learning with convolutional neural networks. _Sci. Rep._ 11, 11325 (2021). Article CAS PubMed PubMed Central Google Scholar * Anguita, D., Ghio, A., Oneto, L., Parra, X. &
Reyes-Ortiz, J. L. Human activity recognition on smartphones using a multiclass hardware-friendly support vector machine. In _Ambient Assisted Living and Home Care. 4th International
Workshop IWAAL 2012_ (eds Bravo, J. et al.) 216–223 (Springer, 2012). * Jayaram, N. & Baker, J. W. Correlation model for spatially distributed ground-motion intensities. _Earthq. Eng.
Struct. Dyn._ 38, 1687–1708 (2009). Article Google Scholar * ElShawi, R., Sherif, Y., Al-Mallah, M. & Sakr, S. Interpretability in healthcare: a comparative study of local machine
learning interpretability techniques. _Comput. Intell._ 37, 1633–1650 (2021). Article Google Scholar * Tjoa, E. & Guan, C. A survey on explainable artificial intelligence (xai): toward
medical xai. _IEEE Trans. Neural Netw. Learn. Syst._ 32, 4793–4813 (2020). Article Google Scholar * Yu, K.-H., Beam, A. L. & Kohane, I. S. Artificial intelligence in healthcare. _Nat.
Biomed. Eng._ 2, 719–731 (2018). Article PubMed Google Scholar * Shortliffe, E. H. & Sepúlveda, M. J. Clinical decision support in the era of artificial intelligence. _JAMA_ 320,
2199–2200 (2018). Article PubMed Google Scholar * Sharma, A., Vans, E., Shigemizu, D., Boroevich, K. A. & Tsunoda, T. Deepinsight: a methodology to transform a non-image data to an
image for convolution neural network architecture. _Sci. Rep._ 9, 11399 (2019). Article PubMed PubMed Central Google Scholar * Lundberg, S. M. & Lee, S.-I. A unified approach to
interpreting model predictions. _Adv. Neural Inf. Process. Syst_. 31, 4768–4777 (2017). * Savas, P. et al. Single-cell profiling of breast cancer T cells reveals a tissue-resident memory
subset associated with improved prognosis. _Nat. Med._ 24, 986–993 (2018). Article CAS PubMed Google Scholar * Jia, J., Li, H., Huang, Z., Yu, J. & Cao, B. Comprehensive immune
landscape of lung-resident memory CD8+ T cells after influenza infection and reinfection in a mouse model. _Front. Microbiol._ 14, 1184884 (2023). Article PubMed PubMed Central Google
Scholar * Lelliott, E. J. et al. NKG7 enhances cd8+ T cell synapse efficiency to limit inflammation. _Front. Immunol._ 13, 931630 (2022). Article CAS PubMed PubMed Central Google
Scholar * Wen, T. et al. NKG7 is a T-cell–intrinsic therapeutic target for improving antitumor cytotoxicity and cancer immunotherapy. _Cancer Immunol. Res._ 10, 162–181 (2022). Article CAS
PubMed Google Scholar * Ting, D. S. W., Carin, L., Dzau, V. & Wong, T. Y. Digital technology and COVID-19. _Nat. Med._ 26, 459–461 (2020). Article CAS PubMed PubMed Central
Google Scholar * LeCun, Y., Bengio, Y. & Hinton, G. Deep learning. _Nature_ 521, 436–444 (2015). Article CAS PubMed Google Scholar * Bazgir, O. et al. Representation of features as
images with neighborhood dependencies for compatibility with convolutional neural networks. _Nat. Commun._ 11, 4391 (2020). Article CAS PubMed PubMed Central Google Scholar * Shavitt,
I. & Segal, E. Regularization learning networks: deep learning for tabular datasets. _Adv. Neural Inf. Process. Syst_. 31, 1386–1396 (2018). * Kossen, J. et al. Self-attention between
datapoints: going beyond individual input–output pairs in deep learning. _Adv. Neural Inf. Process. Syst._ 34, 28742–28756 (2021). Google Scholar * Zhou, B., Khosla, A., Lapedriza, A.,
Oliva, A. & Torralba, A. Learning deep features for discriminative localization. In _Proc. IEEE Conference on Computer Vision and Pattern Recognition_ 2921–2929 (IEEE, 2016). *
Selvaraju, R. R. et al. Grad-cam: visual explanations from deep networks via gradient-based localization. In _Proc. IEEE International Conference on Computer Vision_ 618–626 (IEEE, 2017). *
Ribeiro, M. T., Singh, S. & Guestrin, C. “Why should i trust you?”: explaining the predictions of any classifier. In _Proc. 22nd ACM SIGKDD International Conference on Knowledge
Discovery and Data Mining_ 1135–1144 (Association for Computing Machinery, 2016). * Peyré, G. et al. Computational optimal transport: with applications to data science. _Found. Trends Mach.
Learn._ 11, 355–607 (2019). Article Google Scholar * Moon, I. et al. Machine learning for genetics-based classification and treatment response prediction in cancer of unknown primary.
_Nat. Med_. 29, 2057–2067 (2023). * Peyré, G., Cuturi, M. & Solomon, J. Gromov–Wasserstein averaging of kernel and distance matrices. In _International Conference on Machine Learning_
2664–2672 (PMLR, 2016). * Cuturi, M. Sinkhorn distances: lightspeed computation of optimal transport. _Adv. Neural Inf. Process. Syst_. 26, 2292–2300 (2013). * Crouse, D. F. On implementing
2D rectangular assignment algorithms. _IEEE Trans. Aerosp. Electron. Syst._ 52, 1679–1696 (2016). Article Google Scholar * Shapley, L. S. in _Contributions to the Theory of Games II_ (eds
Kuhn, H. W. & Tucker, A. W.) 307–317 (Princeton Univ. Press, 1953). * Deng, X. & Papadimitriou, C. H. On the complexity of cooperative solution concepts. _Math. Oper. Res._ 19,
257–266 (1994). Article Google Scholar * Datta, A., Sen, S. & Zick, Y. Algorithmic transparency via quantitative input influence: theory and experiments with learning systems. In _2016
IEEE Symposium on Security and Privacy (SP)_ 598–617 (IEEE, 2016). * Štrumbelj, E. & Kononenko, I. Explaining prediction models and individual predictions with feature contributions.
_Knowl. Inf. Syst._ 41, 647–665 (2014). Article Google Scholar * Shrikumar, A., Greenside, P. & Kundaje, A. Learning important features through propagating activation differences. In
_International Conference on Machine Learning_ 3145–3153 (PMLR, 2017). * Sakar, C., Serbes, G., Gunduz, A., Nizam, H. & Sakar, B. Parkinson’s disease classification. _UCI Machine
Learning Repository_ https://doi.org/10.24432/C5MS4X (2018). * Mansouri, K., Ringsted, T., Ballabio, D., Todeschini, R. & Consonni, V. QSAR biodegradation. _UCI Machine Learning
Repository_ https://doi.org/10.24432/C5H60M (2013). * Reyes-Ortiz, J., Anguita, D., Ghio, A., Oneto, L. & Parra, X. Human activity recognition using smartphones. _UCI Machine Learning
Repository_ https://doi.org/10.24432/C54S4K (2012). * Mah, P. & Veyrieras, J.-B. MicroMass. _UCI Machine Learning Repository_ https://doi.org/10.24432/C5T61S (2013). * Guyon, I., Gunn,
S., Ben-Hur, A. & Dror, G. Arcene. _UCI Machine Learning Repository_ https://doi.org/10.24432/C58P55 (2008). * Cole, R. & Fanty, M. ISOLET. _UCI Machine Learning Repository_
https://doi.org/10.24432/C51G69 (1994). * Lathrop, R. p53 Mutants. _UCI Machine Learning Repository_ https://doi.org/10.24432/C5T89H (2010). * Wolberg, W., Mangasarian, O., Street, N. &
Street, W. Breast cancer Wisconsin (diagnostic). _UCI Machine Learning Repository_ https://doi.org/10.24432/C5DW2B (1995). * Bhattacharjee, A. et al. Classification of human lung carcinomas
by mRNA expression profiling reveals distinct adenocarcinoma subclasses. _Proc. Natl Acad. Sci. USA_ 98, 13790–13795 (2001). Article CAS PubMed PubMed Central Google Scholar * Li, J. et
al. Feature selection: a data perspective. _ACM Comput. Surv._ 50, 1–45 (2017). Google Scholar * Li, J. et al. scikit-feature feature selection repository. _GitHub_
https://jundongl.github.io/scikit-feature (2018). * _UCI Machine Learning Repository_; https://archive.ics.uci.edu Download references ACKNOWLEDGEMENTS We acknowledge the support from the
Stanford Cancer Institute and the National Institutes of Health (1K99LM014309, 1R01CA223667 and 1R01CA275772). AUTHOR INFORMATION Author notes * These authors contributed equally: Rui Yan,
Md Tauhidual Islam. AUTHORS AND AFFILIATIONS * Institute for Computational and Mathematical Engineering, Stanford University, Stanford, CA, USA Rui Yan & Lei Xing * Department of
Radiation Oncology, Stanford University, Stanford, CA, USA Md Tauhidual Islam & Lei Xing * Department of Electrical Engineering, Stanford University, Stanford, CA, USA Lei Xing Authors *
Rui Yan View author publications You can also search for this author inPubMed Google Scholar * Md Tauhidual Islam View author publications You can also search for this author inPubMed
Google Scholar * Lei Xing View author publications You can also search for this author inPubMed Google Scholar CONTRIBUTIONS L.X. and M.T.I. conceived the experiments. R.Y. conducted the
experiments and analysed the results. All authors contributed to writing the paper. CORRESPONDING AUTHOR Correspondence to Lei Xing. ETHICS DECLARATIONS COMPETING INTERESTS The authors
declare no competing interests. PEER REVIEW PEER REVIEW INFORMATION _Nature Biomedical Engineering_ thanks Yitan Zhu and the other, anonymous, reviewer(s) for their contribution to the peer
review of this work. ADDITIONAL INFORMATION PUBLISHER’S NOTE Springer Nature remains neutral with regard to jurisdictional claims in published maps and institutional affiliations. EXTENDED
DATA EXTENDED DATA FIG. 1 PROBABILITY DISTRIBUTIONS OF MODEL PREDICTIONS AND ROC CURVES FOR TABMAP AND FIVE OTHER PREDICTION MODELS. Probability distributions of model predictions (left) and
ROC curves (right) from 5-fold cross-validation on the PD dataset for (A) TabMap, (B) 1DCNN, (C) LR, (D) RF, (E) GB, and (F) XGB. In the ROC curves, the blue curve illustrates the mean
performance across the hold-out test set, where each fold represents 20% of the tested data. The gray shaded area shows the standard deviation of the performance. Source data EXTENDED DATA
FIG. 2 CONFUSION MATRICES FOR TABMAP AND FIVE OTHER PREDICTION MODELS. Average confusion matrices from 5-fold cross-validation on the HAR dataset for (A) TabMap, (B) 1DCNN, (C) LR, (D) RF,
(E) GB, and (F) XGB. Source data EXTENDED DATA FIG. 3 CELL-TYPE ANNOTATION AND CANONICAL BIOMARKER IDENTIFICATION USING TABMAP. (A) 2D t-SNE visualization of T cells using embeddings
extracted from the fully connected layer of the trained TabMap model, with ten distinct clusters represented by different colors. (B) Top 20 genes with the highest SHAP values crucial for
identifying T cell subtypes CD8+TRM, CD4+FOXP3+, and CD4+RGCC+. Key genes previously identified in literature are marked in red on the y-axis. (C) Heat map illustrating local attributions of
key genes based on SHAP values, with cells grouped into clusters as indicated by color bars at the bottom. Key genes for each cluster are annotated on the y-axis. Attribution values are
color-coded, with positive attributions shown in red and negative attributions in blue. Source data SUPPLEMENTARY INFORMATION SUPPLEMENTARY INFORMATION Supplementary figures and tables.
REPORTING SUMMARY SOURCE DATA SOURCE DATA FIGS. 2–4, EXTENDED DATA FIGS. 1–3 AND SUPPLEMENTARY FIGS. 1, 2, 4–8 Statistical source data. RIGHTS AND PERMISSIONS Springer Nature or its licensor
(e.g. a society or other partner) holds exclusive rights to this article under a publishing agreement with the author(s) or other rightsholder(s); author self-archiving of the accepted
manuscript version of this article is solely governed by the terms of such publishing agreement and applicable law. Reprints and permissions ABOUT THIS ARTICLE CITE THIS ARTICLE Yan, R.,
Islam, M.T. & Xing, L. Interpretable discovery of patterns in tabular data via spatially semantic topographic maps. _Nat. Biomed. Eng_ 9, 471–482 (2025).
https://doi.org/10.1038/s41551-024-01268-6 Download citation * Received: 15 March 2023 * Accepted: 23 September 2024 * Published: 15 October 2024 * Issue Date: April 2025 * DOI:
https://doi.org/10.1038/s41551-024-01268-6 SHARE THIS ARTICLE Anyone you share the following link with will be able to read this content: Get shareable link Sorry, a shareable link is not
currently available for this article. Copy to clipboard Provided by the Springer Nature SharedIt content-sharing initiative