- Select a language for the TTS:
- UK English Female
- UK English Male
- US English Female
- US English Male
- Australian Female
- Australian Male
- Language selected: (auto detect) - EN
Play all audios:
ABSTRACT The complex ammonium transport and assimilation network of _E. coli_ involves the ammonium transporter AmtB, the regulatory proteins GlnK and GlnB, and the central N-assimilating
enzymes together with their highly complex interactions. The engineering and modelling of such a complex network seem impossible because functioning depends critically on a gamut of data
known at patchy accuracy. We developed a way out of this predicament, which employs: (i) a constrained optimization-based technology for the simultaneous fitting of models to heterogeneous
experimental data sets gathered through diverse experimental set-ups, (ii) a ‘rubber band method’ to deal with different degrees of uncertainty, both in experimentally determined or
estimated parameter values and in measured transient or steady-state variables (training data sets), (iii) integration of human expertise to decide on accuracies of both parameters and
variables, (iv) massive computation employing a fast algorithm and a supercomputer, (v) an objective way of quantifying the plausibility of models, which makes it possible to decide which
model is the best and how much better that model is than the others. We applied the new technology to the ammonium transport and assimilation network, integrating recent and older data of
various accuracies, from different expert laboratories. The kinetic model objectively ranked best, has _E. coli'_s AmtB as an active transporter of ammonia to be assimilated with GlnK
minimizing the futile cycling that is an inevitable consequence of intracellular ammonium accumulation. It is 130 times better than a model with facilitated passive transport of ammonia.
SIMILAR CONTENT BEING VIEWED BY OTHERS A NEURAL-MECHANISTIC HYBRID APPROACH IMPROVING THE PREDICTIVE POWER OF GENOME-SCALE METABOLIC MODELS Article Open access 03 August 2023 ACBM: AN
INTEGRATED AGENT AND CONSTRAINT BASED MODELING FRAMEWORK FOR SIMULATION OF MICROBIAL COMMUNITIES Article Open access 26 May 2020 A VERSATILE ACTIVE LEARNING WORKFLOW FOR OPTIMIZATION OF
GENETIC AND METABOLIC NETWORKS Article Open access 05 July 2022 INTRODUCTION Ammonium is the preferred nitrogen source for _E. coli_,1 which has two ammonium-assimilating routes: the
glutamate dehydrogenase (GDH) pathway and the glutamine synthetase (GS)/glutamate synthase (GOGAT) cycle. The affinity of GS for ammonium (~0.1 mM) exceeds the affinity of GDH for ammonium
(~1 mM).2,3 GS is intensively regulated via covalent modification and gene expression. Glutamate and glutamine are precursors to most cellular nitrogen.4 Notwithstanding its complexity, the
regulation of ammonium assimilation is understood,5 except for an abyss in the understanding of the energetics, mechanisms and regulation of the transport. _E. coli_ is capable of growing in
media with ammonium present in the low μM range because of the transporter AmtB, a member of the Amt/MEP/Rh transporter superfamily.5 The energetics of the transport remains a matter of
debate (reviewed in refs. 5,6,7,8,9,10). Based on indirect structural information, AmtB was claimed to conduct uncharged NH3 through a channel.11,12 Accordingly, none of the cell’s free
energy should be needed for nitrogen import across the cytoplasmic membrane. Boogerd et al.8 argued however that AmtB-mediated NH3 transport must be driven by some free energy input in order
to accumulate NH4+ sufficiently for the growth observed at low extracellular ammonium concentrations; AmtB transporting NH4+ rather than NH3 would do the job. Computational modelling
efforts have been devoted to revealing the complicated regulations in the ammonium assimilation network function as a whole13,14,15,16,17,18,19 (see also Section 11.2 of Supplementary
Information). Although the existing models captured qualitative or semi-quantitative behaviours known to exist at the time, they have not been challenged with more recent quantitative
experimental data, such as by Yuan et al.19 A quantitative model including transport, taking all relevant data sets into account simultaneously, consistent with fundamental thermodynamic and
kinetic limitations and then at sufficient accuracy, is necessary for a decision on the ammonium transport controversy. Such integral models are still impossible however, now because of
heterogeneity of the data sets in terms of quality, relevance, and completeness. Where the concentrations of most RNAs and proteins can be measured quantitatively, only a limited number of
kinetic parameters have been measured experimentally, and then at rather diverse accuracies. Unmeasured parameters are to be estimated such that the model reproduces experimental
observations accurately, but not too accurately as those observations are themselves subject to limited accuracy. The highly important expertise of biological domain experts should but
cannot be taken into account neither robustly nor objectively. In order to identify parameter values uniquely by fitting the model to experimental data,20,21,22,23 much experimental data is
required, particularly of the types that matter most, such as concentration time series. In some cases the most pertinent experimental data cannot be obtained because the experimental
methodologies are unavailable or impossible. Given these limitations, how can modellers develop models that are sufficiently realistic to test hypotheses about the more complex underlying
biology and to then engage in engineering? The multiple and diverse experimental data sets, the kinetic and thermodynamic considerations of both transport and subsequent assimilation of
ammonium, the knowledge about the complex regulatory network around GS, and the expert knowledge on parameter values, all come with uncertainties. This suggested to us that rather than to
come to a binary decision as to which of the two models of ammonium transport and its regulation is right, we should develop a methodology that ranks the models in terms of their relative
likelihood given all data and knowledge uncertainties. We used our five-pronged technology to achieve this: we quantitatively rank the two competing models of _E. coli's_ ammonium
transport and assimilation network in which direct experimental assays are impossible due to the high permeability of membranes to ammonia (NH3). The model that is 130 times more likely than
its runner-up has the AmtB-mediated ammonium transport consumes cellular free energy and the regulator protein GlnK minimizes the futile cycling inevitably associated with the active
transport of NH3. RESULTS PARAMETER ESTIMATION AND MODEL PLAUSIBILITY For kinetic models to be considered convincing, they should be capable of fitting experimentally measured variables. If
the models require unrealistic parameter values for a good fit, they fail to comply with reality. Each individual model parameter comes with a certain level of uncertainty however.
Accordingly, we divided model parameters into three classes (I–III) and a special class. Class I parameters are considered most trustworthy, since their values have been directly
experimentally determined (informed guesses). Class II parameters are somewhat less reliable, since they were not directly measured and they are therefore to be estimated to the best of our
(current) biochemical or physiological knowledge relevant to the parameters at stake (educated guesses). In contrast, there are neither experimental data nor particular knowledge available
for Class III parameters, and these are given reference values based on common sense and general knowledge (rough guesses). Finally, we use parameters that have reference values that are not
allowed to be changed during the parameter estimation (special class), i.e. these are unsearched (US) parameters; their values are taken to be constant for obvious reasons or because there
is firm evidence for their invariableness (constants). The acceptable deviation of model parameter values from the corresponding reference values differ between individual parameters.
Obviously, the last-mentioned special class harbours model parameters that are not allowed to change whatsoever, their reference value does not alter during the entire modelling exercise (no
rubber bands). Next, we argue that class III parameters should be allowed to change freely from their reference values which holds the implication for modelling that there is no penalty for
changing these values (infinitely flexible rubber bands). However, there are good reasons to trust the class I and II reference parameter values and as a consequence, altering their values
should come with a certain penalty. We therefore used penalty weights for model parameter deviations that differed between class I and II parameters, i.e. ‘rubber bands’ of differing
strengths were used; the penalty for a class I was heavier than for a class II parameter (For details, see Methods). Now, the latter two classes of parameters enable us to quantify the
overall model plausibility (MP). The procedure is a constrained optimization problem with different strengths of ‘rubber-bands’ applying to class I–III model parameters. Here the objective
function (_f_) to be minimized is the weighted deviation of model parameter values from their reference values (informed, educated, and rough guesses) [Eq. (3a)], subject to constraint
functions (_g_1, _g_2, …) [Eq. (3b)] and to lower and upper bounds on model parameter values [Eq. (3c)]. The constraint functions are squared residuals between experimental values and
simulated values with certain allowable errors. The _g__i_ values of >0 indicate the fitting is not sufficient. Therefore, we consider only models that exhibit _g__i_ values of ≤0 for all
constraints, without exception. Under this condition, the model will fit the experimentally observed behaviours. For such models, the objective function _f_ will have certain values, which
are nearly always >0. With this knowledge, we are able to develop a method to quantify MP based on the deviation of model parameters from reference class I and II parameter values. In
short, we assume that a class I or II parameter follows the normal distribution in which the mean represents the reference value. The more the model needs to change parameters from their
reference values, the less plausible the model is. We formulated _f_ as the natural logarithm of the inverse of MP. Therefore, minimization of _f_ is equal to maximization of MP (see
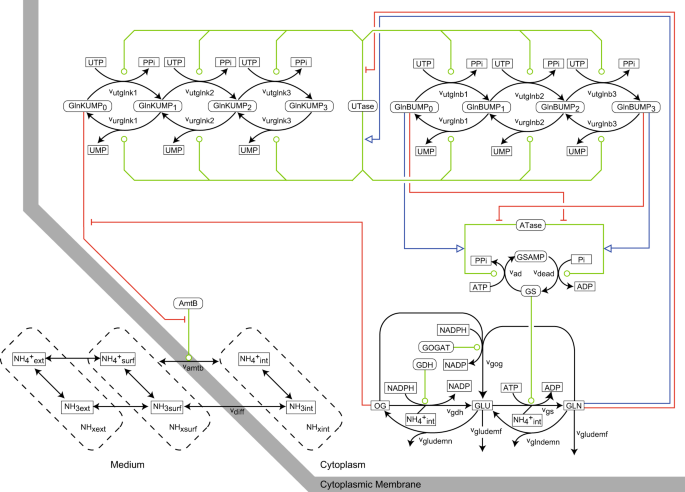
Methods). MODEL CONSTRUCTION The _E. coli_ ammonium transport and assimilation network is shown in Fig. 1, using CADLIVE notation.14,24,25 The mathematical model is described in Tables
S1–S4. We developed two models based either on the active or on the passive transporter hypothesis. Both models include the unmediated diffusion of NH3 and the AmtB-mediated ammonium
transport (either active or passive) through the cytoplasmic membrane, and the regulation of AmtB by GlnK. For both the active and the passive transporter models, we assume that the driving
force of the transport is the electro-chemical potential of NH4+ or NH3. The only difference between the active and passive transporter models is the theoretical accumulation factor of NH4+
(i.e. the ratio of the intracellular to the extracellular NH4+ concentration at the transporter equilibrium) denoted as _φ_. For the active transporter model, we assume AmtB is an active
transporter of NH3 by which ammonium is transported as NH4+ or NH3 + H+ (See our Fig. S1a and Fig. 2CD of van Heeswijk et al.5). Because of the positive charge, NH4+ can accumulate inside
cells up to a maximum concentration ratio _φ_ determined by the membrane potential (inside negative). In the active transporter model, _φ_ is for that reason a function of the membrane
potential (Δ_ψ_): $$\varphi = \exp \left( {\frac{{ - F \cdot \Delta \psi }}{{RT}}} \right),$$ (1) where Δ_ψ_ is the transmembrane electrical potential, _F_ is the Faraday constant, _R_ is
the gas constant, _T_ is the absolute temperature. Given Δ_ψ_ = −150 mV, _φ_ = 275 (or 313) at _T_ = 310 K (or 303 K). For the passive transporter model, we assume that AmtB is a
facilitating passive transporter of NH3 (See our Fig. S1c and Fig. 2B of van Heeswijk et al.5), and thus only the concentration gradient of NH3 is the driving force of transport, and NH3
cannot accumulate inside cells. However, at equilibrium, NH4+ can then still be accumulated in or expelled from cells if the internal pH is lower or higher, respectively, than the external
pH. Accordingly, in the passive transporter model, _φ_ is a function of pH difference: $$\varphi = 10^{\mathrm{pH}_{\mathrm{ext}} - \mathrm{pH}_{\mathrm{int}}},$$ (2) where pHext and pHint
are extracellular and intracellular pH, respectively. Given pHint = 7.6, _φ_ = 0.25 (or 0.63) at pHext = 7.0 (or 7.4). To solve the constrained optimization problem, we employed the
real-coded genetic algorithm (GA) named IS-SR-REXstar/JGG (see Section 4.3 of Supplementary Information). We performed the parameter estimation on the supercomputer Shirokane3. A single run
for the parameter estimation took 12 h using 21 cores of Intel Xeon E5-2670 v3. Using a single core of a standard PC, such a single run would have taken some 10 days. Throughout this
article, we performed 85 runs. Therefore, a supercomputer is essential to construct and test realistic kinetic models within a reasonable time scale. The experimental training dataset on
which the constraint functions are based is summarized in Table S9. For fair model comparison, the same constraints (_g_1–52) were used for the active and passive transporter models. We used
experimental data from the following three papers. Yuan et al.19 (Yuan hereafter) grew _E. coli_ (wild type, ΔGDH, and ΔGOGAT) on filters on top of a solid agarose-medium mixture to enable
rapid, noninvasive sampling of the intracellular metabolome. To induce N-limitation in cells growing on the filter, the initial NH4+ concentration was set to 2 mM. Some 3 h later, the
surface NH4+ concentration at the agarose-filter interface became measurably depleted. Since the underlying agarose provides a reservoir of ammonium, growth did not stop, but the growth rate
was reduced, indicating that cultures were N-limited. Transferring the N-limited filter culture to plates with 10 mM NH4+ induced an N-upshift and partially restored the growth rate. At
various time points for up to 30 min after the N-upshift, extracts from the cells on the filters were analysed by a set of LC-MS/MS methods. Kim et al.26 (Kim hereafter) developed
microfluidic growth chambers in which NH4+ can be maintained continuously at low concentrations. From the growth rates, they estimated the intracellular NH4+ concentrations, the rates of the
ammonium transport via AmtB, non-facilitated ammonia diffusion, and ammonium assimilation. Radchenko et al.27 (Radchenko hereafter) grew _E. coli_ under N-limitation and then added 200 µM
NH4+ to the liquid culture medium to cause a moderate N-upshift. The uridylylation state of GlnK and the binding of GlnK to AmtB were investigated prior to N-upshift and then periodically
after the N-upshift. THE ACTIVE TRANSPORTER MODEL IS 130 TIMES MORE LIKELY THAN THE PASSIVE TRANSPORTER MODEL We performed five independent runs of parameter estimation each for the active
and the passive transporter models. GA found parameter sets that satisfied all the constraints (_γ_ = 0) for both the active transporter model and the passive transporter model, indicating
that both models can fit the training data used. However, there was a significant difference in the objective function value _f_ (_p_ = 0.008, Wilcoxon rank-sum test): 8.4 and 13.3 for the
active and the passive transporter models, respectively. Since we defined _f_ as the natural logarithm of the inverse of MP, we can calculate MP from _f_ values: MP is 2.2 × 10⁻⁴ and 1.7 ×
10−6 for the active and the passive transporter models, respectively. Therefore, MP of the active transporter model is 130 times higher than that of the passive transporter model. The
difference in MP stems mainly from the difference in GS-related parameters. Since NH4+ cannot be accumulated in the passive transporter model, an unreasonably high Vmax of GS is required to
explain rapid cell growth at μM range of external NH4+ (see Section 9 of Supplementary Information). REFINING THE ACTIVE TRANSPORTER MODEL Since the active transporter model is much more
likely than the passive transporter model, we hereafter focus on the active transporter model. First, we refined the active transporter model by incorporating Kim’s semi-experimental data
which were calculated based on the active transporter hypothesis. Namely, we performed five new runs of parameter estimation with the full set of the constraint functions (_g_1–58). We
plotted the deviation of the average of estimated values from their reference values. Class I and II parameters are shown in Fig. 2. Changes in 94% of class I parameters and 97% in class II
parameters (circles in Fig. 2a, b) were less than twofold and fivefold on either side of the reference value, respectively, indicating that the model is able to reproduce the observed
behaviours while using realistic parameter values. Out of five independent runs of the GA, the parameter set that yielded the smallest value of the objective function (_f_) will be discussed
further, also because the results to be shown for this particular set, essentially did not differ from those of the other 4 parameter sets (see Table S10 for all the estimated parameter
sets). Next, we checked whether the refined active transporter model (with the smallest _f_ value) actually fitted to training experimental data (see Comparison with Training Data in Figs
3–5). As shown in Fig. 3a, the refined active transporter model fits the experimental data reported by Yuan, with respect to the transient glutamine and glutamate changes after the 10 mM
N-upshift. The refined active transporter model successfully reproduced Kim’s experimental data for _E. coli_ cells growing with glucose (Fig. 4a–c): The simulated growth rate of the wild
type remained constant at ~0.8 h−1 regardless of the extracellular NH4+ concentration, and fits well to the experimental data (blue line in Fig. 4a). And, the growth of the ΔAmtB strain
decreased at external NH4+ concentrations below ~40 μM (red line in Fig. 4a). Based on measured growth rates, Kim estimated the internal NH4+ concentration and rates of AmtB-mediated
ammonium transport, unfacilitated diffusion, and net ammonium assimilation. The model fitted these quasi-experimental data as well: Lowering the extracellular NH4+ concentration from 1000 to
60 µM resulted in a linear decrease of the intracellular NH4+ concentration of the wild type from 628 down to 35 μM. At a further decrease of the external NH4+ concentration down to 4 µM,
the internal NH4+ concentration remained virtually constant (blue line in Fig. 4b). The net influx of ammonium (vnet) was constant at ~40 mM/min regardless of the extracellular NH4+
concentration (yellow line in Fig. 4c), a remarkable feat vis-à-vis the requirements and homeostasis of the cell. In all this, the model was consistent with the experimental data. However,
the model also shows how all this works: Above 60 μM external NH4+, almost all the ammonium transport proceeds via unfacilitated NH3 diffusion (vdiff). As the external NH4+ decreases
further, the unfacilitated NH3 diffusion decreases to negative values (red line in Fig. 4c); this negative value of vdiff indicates NH3 back diffusion, i.e. passive outward NH3 permeation.
The flux via AmtB (vamtb) increases just as much as the cells need (blue line in Fig. 4c), thereby minimizing the back diffusion.26 The refined active transporter model reproduced
Radchenko’s experimental data for the wild type (Fig. 5a–c). The transient increase in both un-uridylylated GlnK and GlnK with one UMP-group, upon the N-upshift (200 µM NH4+) were both
accurately reproduced by the model (Fig. 5a). Also, the relative steadiness of GlnK with two UMP-groups as well as the transient decrease in GlnK with three UMP-groups followed by the
partial recovery were simulated by the model (Fig. 5b), as were the transient full inactivation of AmtB by the formation of the GlnKAmtB complex within 2 min after the N-upshift and the
slower activation of AmtB by releasing GlnK (Fig. 5c). MODEL VALIDATION In order to validate the refined active transporter model, we investigated whether this model fitted to experimental
data that was not used for parameter estimation (see Comparison with Non-training Data in Figs 3–5). The model correctly reproduced both transient responses after the small N-upshift for the
wild type and ΔGOGAT for Yuan’s experiments (yellow lines in Fig. 3b). The model’s behaviour upon the N-depletion was reasonable in a qualitative sense, except for the glutamate transient
in the wild type (blue lines in Fig. 3b). Furthermore, the model reproduced the transient responses of ΔATase (green lines in Fig. 3c). Finally, the model also successfully fitted the
glutamine and glutamate transients in ΔAmtB (blue lines in Fig. 3c; see also Section 10 of Supplementary Information). Next, we investigated whether the model could reproduce non-training
data for Kim’s experiments. We simulated differences in carbon sources by changing the value of the minimal doubling time _τ_0 (For details, see Section 2.2 of Supplementary Information).
The model provided a good fitting to the experimental data for glycerol (Fig. 4d–f) and glucose 6 phosphate + gluconate (Fig. 4g–i) as growth substrates. This is valid for the specific
growth rate of wild type and ΔAmtB (Fig. 4d, g), for the internal NH4+ concentration of both wild type and ΔAmtB (Fig. 4e, h), and for vamtb, vdiff, and vnet of the wild type (Fig. 4f, i).
Finally, we investigated whether the model could reproduce non-training data for Radchenko’s experiments: The experimental data for the GlnK Y51A mutant that contains a variant GlnK protein
that cannot be uridylylated. Only unuridylylated GlnK was present before and after the N-upshift (Fig. 5g, h), but, more importantly, the model reproduced the transient GlnKAmtB complex
formation that was experimentally observed (Fig. 5i). Radchenko concluded that association and dissociation of the GlnKAmtB complex were independent of the uridylylation state of GlnK and
that binding of 2-oxoglutarate (and ATP) to GlnK influenced the dynamics of its interaction with AmtB. Since 2-oxoglutarate has not been measured for this mutant, we optimized the time
evolution of the 2-oxoglutarate concentration and found a similar pattern as in the wild type, but at higher concentrations (Fig. 5j). When using this dynamic 2-oxoglutarate input, the model
predicted not only the transient increase/decrease pattern of GlnK free of bound 2-oxoglutarate, but also the opposite transient decrease/increase pattern of GlnK species with one, two or
three bound 2-oxoglutarate molecules (Fig. 5k). Radchenko did not measure the extracellular and intracellular ammonium concentrations either.27,28 Fig. 5f (wild type) and Fig. 5l (GlnK Y51A)
show the external and internal NH_x_ (NH4+ + NH3) concentration as calculated by the refined active transporter model. Both NH_x_ traces look quite similar for the wild type and the mutant.
Because of the rapid AmtB-mediated ammonium transport immediately after the N-upshift, the extracellular NH_x_ decreases to a sub-μM level within 2 min. GLNK IS AN INDISPENSABLE REGULATOR
TO LIMIT AMMONIUM/AMMONIA FUTILE CYCLING AmtB-mediated active ammonium transport and passive outward NH3 permeation together constitute a futile cycle8,26,29,30 (Fig. 6a). Therefore, Boogerd
et al. hypothesized that GlnK is necessary not only to block but also to fine-tune the AmtB-mediated active NH3 transport in order to limit futile cycling whilst satisfying the demand of N
input for growth.8 This hypothesis was addressed by the microfluidics experiments carried out by Kim26 and the latter experiments were used as training and non-training datasets in this
paper. To test this hypothesis further, we performed an in silico experiment that would be practically impossible to realize in vitro or in vivo. We subjected virtual wild type and mutant
cells, adapted to 4 μM extracellular ammonium, to a sudden increase in the extracellular ammonium concentration (which was maintained afterwards). For the virtual mutant, we removed all GlnK
proteins upon the N-upshift. In this analysis, we assumed that the membrane potential, ATP, NADPH, and cellular enzyme make-up remained constant after the N-upshift for at least 20 min. The
interesting variables at steady state are presented in Fig. 6. After the N-upshift up to 60 μM extracellular NH4+, in the wild-type cells, GlnK adjusted the AmtB-mediated ammonium transport
to the minimum flux necessary to maintain ~20 μM intracellular NH4+ given the back diffusion rate (solid lines in Fig. 6b–e). After the N-upshift beyond 60 μM extracellular NH4+, the
wild-type cell completely blocked the AmtB-mediated transport. For the wild type, the three fluxes vamtb, vdiff, and vnet (Fig. 6b) and the internal ammonium concentration (Fig. 6c) were
almost indistinguishable from those shown in Fig. 4b, c, respectively, due to the fine-tuning of active ammonium transport by GlnK. The virtual mutant cannot limit the futile cycling because
of the absence of GlnK (dotted lines in Fig. 6b–e). Its back diffusion rate of NH3 (red dotted line in Fig. 6b) was as high as 1300 mM/min at 1 mM extracellular ammonium. Assuming that NH3
is symported with one H+ and the H+/ATP coupling ratio is 3,31,32,33 the resultant dissipation of proton motive force would be equivalent to the loss of more than 400 mM/min of ATP.
Considering that the overall ATP production rate is typically some 500 mM/min for cells growing exponentially with glucose in minimal medium,34 the energy loss by the futile cycling in this
virtual mutant would amount to some 80% of the overall ATP production in the cell and not only preclude growth but even compromise maintenance of the living state. In summary, the most
balanced model of ammonium assimilation produced here proves that GlnK is an indispensable regulator to hold in check the dissipation of proton motive force by the ammonium/ammonia futile
cycling. DISCUSSION The new modelling technology presented here succeeded to integrate experimental data gathered in state-of-the-art experiments carried out by three independent research
groups from two continents. Generally, it is difficult to develop a kinetic model capable of quantitatively reproducing different experimental data from different research groups. The data
tend to address highly different aspects of the model at different accuracies, yet address the very same model so that parameter changes necessitated in one experimental setting destroy
model correspondence with the data produced in another setting. With our new technology we succeeded to accommodate the experimental data obtained by the three research groups in terms of
one and the same parameter set and one and the same model, except for the limited number of experiment-specific necessary adjustments: the refined active transporter model has 115 parameters
in total, and only 11 parameters such as external pH and maximum specific growth rate needed experiment-specific adjustments. Our endeavour was successful because we formulated our
parameter estimation problem as a constrained optimization problem, allowed for different accuracies, and performed GAs on a supercomputer. Since there were multiple training sets of
experimental data, it would have been impossible to tune parameters manually by trial and error: too many permutations. But what was possible and important, was the input of human expertise
in judging the accuracy of parameters and variables used for model building. This was accomplished by allowing parameters to deviate from their reference value, as if allowing rubber bands
to be stretched, but with ‘forces’ counteracting the deviations and with force constants that were adjusted by human experts so as to reflect the accuracy of the parameter. Also, variables
were allowed to deviate from measured values since these were inaccurate to some extent as well. Once training data had been converted to constraint functions and reference values of kinetic
parameters had been implemented, our technology estimated the most plausible values of kinetic parameters with minimal changes in the most firmly established parameters. To our knowledge,
this type of doubly constrained optimization is not commonly used in kinetic modelling (e.g.35,36). Yet, this constrained optimization was here demonstrated to be highly effective in
generating realistic in silico models. We took the ammonium transport and assimilation network merely as an example because it is so complex and controversial that it requires an objective
comparison of model likelihood, which we delivered as concretely as a factor of likelihood (i.e. 130). The parameter estimation technique presented in this paper should essentially be
applicable to other complex systems as long as reference parameter values and training data concerning model variables are available. We would like it to be tested in many other systems
including cell biology, biotechnology, and microbial ecology. Biology is complex and the performance of its models depends critically on parameter values and variables that are known with
limited accuracy. Our technology is able to weigh the various certainties and uncertainties and integrate human expertise with parameters and experimental data. This should then produce the
best available model given experimental data that are limited by resources as much as by feasibility of experimental determinations of some parameters and variables. The question was whether
the model resulting from our new technology would be powerful enough to be decisive in an important biological issue. We showed that it was: when we applied our technology to ammonium
assimilation in _E. coli_, the model in which AmtB is an active transporter and GlnK minimizes ammonium/ammonia futile cycling was 130 times more probable than the existing alternative model
of facilitated passive transport of NH3. The topic of active versus passive transport of ammonium by AmtB has been vividly debated.5,6,7,8,9,10 Structural studies reported in 2004 that AmtB
is an NH3 channel, i.e. a passive transporter.11,12 Other studies thereafter seemed to support this conclusion.37,38,39,40,41,42 Although this may still be the consensus view, recent
studies suggested that AmtB is an active NH3 (or passive NH4+) transporter.43,44,45,46,47 We tackled this elusive problem in an unprecedented way: kinetic modelling comprising the
transporter, signal proteins, and metabolic enzymes. We developed two models based on the active and passive transporter hypotheses, respectively. Rather than coming to the more classical
type of conclusion that one model is right and the other model is wrong, we discuss this in terms of relative likelihoods of alternative mechanisms. According to MP, the active transporter
model is 130 times more likely than the passive transporter model. The parameter estimation and model selection problem has been tackled before, notably by Bayesian approaches (see Liepe et
al.48 and within), which also use prior knowledge about parameter values. While optimization algorithms (such as the one that we used) try to obtain a _single_ parameter set that best
enables a model to fit experimental data, Bayesian approaches try to find the _probability distribution_ of such parameter sets. Bayesian approaches thus make it possible to assess
confidence by assessing the probability distributions of unknown parameters. However, due to their much higher computational cost, Bayesian approaches have rarely been applied to models with
more than a dozen unknown parameters (The largest model we have found to which a Bayesian approach has been applied has 19 unknown parameters. See Liepe et al.48 and references therein).
Our constrained optimization-based approach is a computationally much cheaper alternative to Bayesian approaches: We were able to integrate prior information into parameter estimation and
still obtained parameter estimates for 94 unknown (class I–III) parameters within a reasonable computational time (12 h). Our constrained optimization-based approach can deal with the
uncertainty not only in a single but also in multiple network connections. To illustrate this, we consider the hypothetical situation in which we investigate whether GlnB is (de)uridylylated
(it is common knowledge that this is the case). We have created an alternative model in which GlnB is not (de)uridylylated, i.e. we eliminated 6 edges for _v__utglnb_1-3 and _v__urglnb_1-3
in Fig. 1. Apart from the GlnB (de)uridylylation, the rest of the network of the alternative model was the same as the refined active transporter model. Next, we performed parameter
estimation for the alternative model and obtained an MP of 3.6 × 10⁻⁸, which is much smaller than that of the refined active transporter model (1.1 × 10⁻⁴). We concluded that the alternative
model is less plausible, and that it is highly likely that GlnB is (de)uridylylated. We conclude that as long as models can fit training experimental data and reference parameter values are
provided, our approach can rank competing models with different network connections. We performed five independent runs of parameter estimation each for the active, the passive, and the
refined active transporter models. In Table S10, we showed all the estimated parameter sets. These parameter sets provide comparable fitting results as all the constraints are satisfied
(_g__i_ ≤ 0 for all _i_). The parameter sets in Table S10 have similar parameter values for each model, indicating that parameters are almost identified: The median of the coefficient of
variation (CV) for all search parameters is 0.05, and all the CVs are less than 0.38. The key to identifiability is to penalize deviations of parameters from the reference values. In
principle, the parameters of class I and II (i.e. penalized parameters) can be uniquely determined. Other parameter sets which are very different from those in Table S10 may fit training
data (_g__i_ ≤ 0 for all _i_); however, it is likely that they provide smaller MP than that in Table S10. For more discussion of this important issue, see Section 13 of Supplementary
Information. Our methodology cannot rank different parameter sets with the same deviations of parameters from the reference values. To rank such parameter sets, other model ranking criteria
such as robustness to parameter changes can be used.49,50 We conducted a sensitivity analysis for important model variables and fluxes (Table S13). In the passive transporter model, the
growth rate is highly sensitive to internal and external pH changes because only the concentration gradient of NH3 is the driving force of the ammonium transport. In contrast, the growth
rate is less sensitive in the active transporter model. Therefore, not only in terms of the parameter deviation from the reference values but also in terms of robustness, the active
transporter model is better than the passive transporter model. Where in chemistry and physics new technologies are first tested in silico, this has been much less successful in
bioengineering. The thousands of nonlinearly interacting processes in biology have long been the legitimate culprit: insufficient data were available. Thanks to functional genomics and
biochemical technologies the quantity of experimental data should no longer constitute a limitation. Indeed, we are almost able to measure every single of the thousands of molecule types
that run living cells. It would seem that the quantity of data should suffice for a ‘deep biology’ understanding and for an engineering of cell-based systems by using dynamic in silico
replica models of the intracellular networks. Such integral kinetic modelling should enable prediction of complex dynamic responses to complex perturbations,51,52 including those of
precision bioengineering. We have here developed a new, balanced modelling technology that enables decisions on the relative rather than absolute validity of mechanisms in crucial biological
networks. Indeed, an innovation is that with this analysis we refrain from concluding that the one model is right and the other wrong. We consider it likely that this relative likelihood of
the two models will change with more experimental data becoming available in the future. We see the future of biotechnology as one in which models are not true or false but more and less
likely at rates driven by the developing amounts of big data. Hence we see the methodology we here developed as big (data) biotechnology. METHODS CONSTRAINED OPTIMIZATION-BASED PARAMETER
ESTIMATION The parameter estimation problem can be formulated as a constrained optimization problem: $${\mathrm{minimize}}\ f({\mathbf{p}}),$$ (3a) $${\mathrm{subject}}\,{\mathrm{to}}\
{\mathbf{g}}({\mathbf{p}}) \le {\mathbf{0}},$$ (3b) $${\mathbf{p}}^L \le {\mathbf{p}} \le {\mathbf{p}}^U,$$ (3c) where P = (_p_1, _p_2, …) is the search parameter vector, i.e. a set of
parameters to be searched, and _p__i_ is the _i_th parameter. _f_ is the objective function that evaluates deviation of parameter estimates from the reference values (_reference_ refers to
the values used to initiate the search, for which measured values, educated guesses or rough guesses are taken). _f_ is defined as the natural logarithm of the inverse of MP (see Section 4.1
of Supplementary Information). G = (_g_1, _g_2, …) is the constraint function vector that evaluates model fitting to training data, i.e. the experimental data to which an in silico model
should fit. If the fitting is not sufficient, _g__i_ takes a positive value. For example, a constraint function that evaluates model fitting to time course data is given by
$$g_i({\mathbf{p}}) = \frac{1}{n}\mathop {\sum}\limits_{j = 1}^n {\left( {\frac{{x_j^{\mathrm{sim}} - x_j^{\mathrm{exp}}}}{{x_j^{\mathrm{exp}}}}} \right)^2} - \varepsilon _i^2,$$ (4) where
_x__j_sim and _x__j_exp are simulated and experimental data points of a model variable, _n_ is the number of data points, and _ε__i_ is the allowable error. For the actual equations, see
Section 4.2 of Supplementary Information. In Eq. (3), P_L_ and P_U_ are the lower bound and upper bound vectors, respectively. The aim of the constrained optimization problem is to minimize
parameter deviation from the reference values (_f_) while keeping a good fit to training experimental data (G ≤ 0). The modelling workflow is illustrated in Fig. S5. We divided search
parameters into three classes (see Table S4): Class I, II, and III parameters are those for which measured values (I), educated guesses (II), and rough guesses (III) are available. In this
study, the objective function _f_ is given by: $$f({\mathbf{p}}) = \lambda _I\mathop {\sum}\limits_{p_i \in {\mathrm{Class}}\,I} {\left( {\ln \frac{{p_i}}{{p_i^ \ast }}} \right)^2} + \lambda
_{II}\mathop {\sum}\limits_{p_i \in {\mathrm{Class}}\,II} {\left( {\ln \frac{{p_i}}{{p_i^ \ast }}} \right)^2} + \lambda _{III}\mathop {\sum}\limits_{p_i \in {\mathrm{Class}}\,III} {\left(
{\ln \frac{{p_i}}{{p_i^ \ast }}} \right)^2} ,$$ (5) where _p__i_* is the reference value of the _i_th parameter, and _λ__j_ (_j_ = _I_, _II_, _III_) is the class-related penalty weight for a
parameter change (_λ__I_ > _λ__II_ > _λ__III_ ≥ 0). We used _λ__I_ = 1.0407, _λ__II_ = 0.1930, and _λ__III_ = 0. We derived Eq. (5) based on MP. Thus, we can calculate MP from _f_:
$$MP({\mathbf{p}}) = e^{ - f({\mathbf{p}})}.$$ (6) Therefore, minimizing _f_ is equal to maximizing MP. For more details on the objective function _f_ and MP, see Sections 3 and 4 of
Supplementary Information. In the constrained optimization, the constraint violation _γ_ is used to check if the constraint equations [Eq. (3b)] are satisfied. $$\gamma ({\mathbf{p}}) =
\mathop {\sum}\limits_{i = 1}^{n_{\mathrm{constraint}}} {\left[ {\max \left( {0,g_i({\mathbf{p}})} \right)} \right]^2} ,$$ (7) where the max function returns the higher value of two inputs:
0 and _g__i_(P). _γ_ = 0 indicates that all the constraint functions are satisfied, i.e. the model fits the training data. _γ_ > 0 indicates one or more constraint functions are not
satisfied. Different allowable errors _ε__k_ (_k_ = _I_, _II_, _III_) are used for the constraint functions in a manner similar to the penalty weights _λ__j_ (_j_ = _I_, _II_, _III_) for the
objective function (see Section 4 of Supplementary Information). The aim of the constrained optimization can be rephrased as to find parameter vectors that provide the smallest possible _f_
value while satisfying _γ_ = 0. Equation (3) is the standard formalism of constrained optimization problems, and a wide variety of optimization algorithms and software (e.g.53,54,55) have
been proposed to deal with them. We employ a genetic algorithm (GA) named IS-SR-REXstar/JGG (Iterative Start and Stochastic Ranking, Real-coded Ensemble Crossover star/Just Generation Gap).
GAs are metaheuristic techniques that have been developed inspired by the evolution of living organisms. IS-SR-REXstar/JGG has been a slightly modified from SR-REXstar/JGG.53 For details,
see Section 4.3 of Supplementary Information. Here we provide a brief description of how IS-SR-REXstar/JGG solves the constrained optimization problem [Eq. (3)]: * (1) Randomly generate an
initial population in which each individual is characterized by a set of different values for search parameters. To evaluate _g__i_ and _γ_ for each individual, Yuan, Kim, and Radchenko
experiments are simulated. * (2) Select a subset of individuals from the population. The selected ones are called parents. * (3) Generate children using the parents (outside the population)
and compute _f_ and _γ_ for them. * (4) Select some children that provide small values of _f_ and _γ_. * (5) Replace the parents in the population with the selected children, thereby
creating a partly changed population, while maintaining the number of individuals. * (6) If the _f_ and _γ_ have not been decreased for many generations, go to the step (1). Otherwise, go
the step (2). The iteration is stopped at the predefined computational time (12 h). By performing the steps (1)-(6), parameter sets providing large _f_ and _γ_ values are eliminated from the
population, and those providing small _f_ and _γ_ values emerge. Eventually, we can obtain an individual (i.e. a parameter set) that provides a small _f_ value with _γ_ = 0. The stochastic
ranking enables GAs to reduce both _f_ and _γ_ values in a balanced way.56 Fig. S6 illustrates how the GA works in a simple problem. DATA AVAILABILITY The authors declare that the data
supporting the findings of this study are available within the paper and its supplementary information files. CODE AVAILABILITY Custom C and MATLAB codes used in this study are available
upon request. The MATLAB codes for the refined active transporter model are provided as a supplementary file of this article (41540_2019_91_MOESM3_ESM.zip). The SBML file for the refined
active transporter model for Kim’s experiment is available from BioModels database (MODEL1901090001). REFERENCES * Reitzer, L. Nitrogen assimilation and global regulation in Escherichia
coli. _Annu. Rev. Microbiol._ 57, 155–176 (2003). Article CAS Google Scholar * Miller, R. E. & Stadtman, E. R. Glutamate synthase from Escherichia coli. An iron-sulfide flavoprotein.
_J. Biol. Chem._ 247, 7407–7419 (1972). CAS PubMed Google Scholar * Sakamoto, N., Kotre, A. M. & Savageau, M. A. Glutamate dehydrogenase from Escherichia coli: purification and
properties. _J. Bacteriol._ 124, 775–783 (1975). CAS PubMed PubMed Central Google Scholar * Wohlhueter, R. M., Schutt, H. & Holzer, H. in _The Enzymes of Glutamine Metabolism_ (eds
S. Prusiner & E. R. Stadtman) 44–64 (Academic Press, New York, 1973). * van Heeswijk, W. C., Westerhoff, H. V. & Boogerd, F. C. Nitrogen assimilation in Escherichia coli: putting
molecular data into a systems perspective. _Microbiol. Mol. Biol. Rev._ 77, 628–695 (2013). Article Google Scholar * Andrade, S. L. & Einsle, O. The Amt/Mep/Rh family of ammonium
transport proteins. _Mol. Membr. Biol._ 24, 357–365 (2007). Article CAS Google Scholar * Neuhauser, B., Dynowski, M. & Ludewig, U. Switching substrate specificity of AMT/MEP/ Rh
proteins. _Channels_ 8, 496–502 (2014). Article Google Scholar * Boogerd, F. C. et al. AmtB-mediated NH3 transport in prokaryotes must be active and as a consequence regulation of
transport by GlnK is mandatory to limit futile cycling of NH4(+)/NH3. _FEBS Lett._ 585, 23–28 (2011). Article CAS Google Scholar * Javelle, A. et al. Structural and mechanistic aspects of
Amt/Rh proteins. _J. Struct. Biol._ 158, 472–481 (2007). Article CAS Google Scholar * Winkler, F. K. Amt/MEP/Rh proteins conduct ammonia. _Pflugers Arch._ 451, 701–707 (2006). Article
CAS Google Scholar * Khademi, S. et al. Mechanism of ammonia transport by Amt/MEP/Rh: structure of AmtB at 1.35 A. _Science_ 305, 1587–1594 (2004). Article CAS Google Scholar * Zheng,
L., Kostrewa, D., Berneche, S., Winkler, F. K. & Li, X. D. The mechanism of ammonia transport based on the crystal structure of AmtB of Escherichia coli. _Proc. Natl Acad. Sci. USA_ 101,
17090–17095 (2004). Article CAS Google Scholar * Bruggeman, F. J., Boogerd, F. C. & Westerhoff, H. V. The multifarious short-term regulation of ammonium assimilation of Escherichia
coli: dissection using an in silico replica. _FEBS. J._ 272, 1965–1985 (2005). Article CAS Google Scholar * Kurata, H., Masaki, K., Sumida, Y. & Iwasaki, R. CADLIVE dynamic simulator:
direct link of biochemical networks to dynamic models. _Genome Res._ 15, 590–600 (2005). Article CAS Google Scholar * Ma, H., Boogerd, F. C. & Goryanin, I. Modelling nitrogen
assimilation of Escherichia coli at low ammonium concentration. _J. Biotechnol._ 144, 175–183 (2009). Article CAS Google Scholar * Ma, H., Boogerd, F. C. & Goryanin, I. Corrigendum to
“Modelling nitrogen assimilation of Escherichia coli at low ammonium concentration” [J. Biotechnol. 144 (2009) 175–183]. _J Biotechnol_ 150, 207 (2010). * Masaki, K., Maeda, K. &
Kurata, H. Biological design principles of complex feedback modules in the E. coli ammonia assimilation system. _Artif. Life_ 18, 53–90 (2012). Article Google Scholar * Gosztolai, A. et
al. GlnK facilitates the dynamic regulation of bacterial nitrogen assimilation. _Biophys. J._ 112, 2219–2230 (2017). Article CAS Google Scholar * Yuan, J. et al. Metabolomics-driven
quantitative analysis of ammonia assimilation in E. coli. _Mol. Syst. Biol._ 5, 302 (2009). Article Google Scholar * Banga, J. R. & Balsa-Canto, E. Parameter estimation and optimal
experimental design. _Essays Biochem._ 45, 195–209 (2008). Article CAS Google Scholar * Jaqaman, K. & Danuser, G. Linking data to models: data regression. _Nat. Rev. Mol. Cell Biol._
7, 813–819 (2006). Article CAS Google Scholar * Sontag, E. D. For differential equations with r parameters, 2r+1 experiments are enough for identification. _J. Nonlinear Sci._ 12, 553–583
(2003). Article Google Scholar * van Beek, J. H., Hauschild, A. C., Hettling, H. & Binsl, T. W. Robust modelling, measurement and analysis of human and animal metabolic systems.
_Philos. Trans. A Math. Phys. Eng. Sci._ 367, 1971–1992 (2009). Article Google Scholar * Kurata, H., Matoba, N. & Shimizu, N. CADLIVE for constructing a large-scale biochemical network
based on a simulation-directed notation and its application to yeast cell cycle. _Nucleic Acids Res._ 31, 4071–4084 (2003). Article CAS Google Scholar * Kurata, H. et al. Extended
CADLIVE: a novel graphical notation for design of biochemical network maps and computational pathway analysis. _Nucleic Acids Res._ 35, e134 (2007). Article Google Scholar * Kim, M. et al.
Need-based activation of ammonium uptake in Escherichia coli. _Mol. Syst. Biol._ 8, 616 (2012). PubMed PubMed Central Google Scholar * Radchenko, M. V., Thornton, J. & Merrick, M.
Association and dissociation of the GlnK-AmtB complex in response to cellular nitrogen status can occur in the absence of GlnK post-translational modification. _Front. Microbiol._ 5, 731
(2014). Article Google Scholar * Radchenko, M. V., Thornton, J. & Merrick, M. Control of AmtB-GlnK complex formation by intracellular levels of ATP, ADP, and 2-oxoglutarate. _J. Biol.
Chem._ 285, 31037–31045 (2010). Article CAS Google Scholar * Kleiner, D. The transport of NH3 and NH4+ across biological membranes. _Biochim. Biophys. Acta_ 639, 41–52 (1981). Article
CAS Google Scholar * Neijssel, O. M., Buurman, E. T. & Teixeira de Mattos, M. J. The role of futile cycles in the energetics of bacterial growth. _Biochim. Biophys. Acta_ 1018, 252–255
(1990). Article CAS Google Scholar * Stouthamer, A. H. & Bettenhaussen, C. Utilization of energy for growth and maintenance in continuous and batch cultures of microorganisms. A
reevaluation of the method for the determination of ATP production by measuring molar growth yields. _Biochim. Biophys. Acta_ 301, 53–70 (1973). Article CAS Google Scholar * Boogerd, F.
C., van Verseveld, H. W., Torenvliet, D., Braster, M. & Stouthamer, A. H. Reconsideration of the efficiency of energy transduction in Paracoccus denitrificans during growth under a
variety of culture conditions. _Arch. Microbiol._ 139, 344–350 (1984). Article CAS Google Scholar * Tomashek, J. J. & Brusilow, W. S. Stoichiometry of energy coupling by
proton-translocating ATPases: a history of variability. _J. Bioenerg. Biomembr._ 32, 493–500 (2000). Article CAS Google Scholar * Gonzalez, J. E., Long, C. P. & Antoniewicz, M. R.
Comprehensive analysis of glucose and xylose metabolism in Escherichia coli under aerobic and anaerobic conditions by 13C metabolic flux analysis. _Metab. Eng._ 39, 9–18 (2017). Article CAS
Google Scholar * Tohsato, Y., Ikuta, K., Shionoya, A., Mazaki, Y. & Ito, M. Parameter optimization and sensitivity analysis for large kinetic models using a real-coded genetic
algorithm. _Gene_ 518, 84–90 (2013). Article CAS Google Scholar * Kotte, O., Zaugg, J. B. & Heinemann, M. Bacterial adaptation through distributed sensing of metabolic fluxes. _Mol.
Syst. Biol._ 6, 355 (2010). Article Google Scholar * Khademi, S. & Stroud, R. M. The Amt/MEP/Rh family: structure of AmtB and the mechanism of ammonia gas conduction. _Physiology_ 21,
419–429 (2006). Article CAS Google Scholar * Javelle, A., Thomas, G., Marini, A. M., Kramer, R. & Merrick, M. In vivo functional characterization of the Escherichia coli ammonium
channel AmtB: evidence for metabolic coupling of AmtB to glutamine synthetase. _Biochem. J._ 390, 215–222 (2005). Article CAS Google Scholar * Soupene, E., He, L., Yan, D. & Kustu, S.
Ammonia acquisition in enteric bacteria: physiological role of the ammonium/methylammonium transport B (AmtB) protein. _Proc. Natl Acad. Sci. USA_ 95, 7030–7034 (1998). Article CAS Google
Scholar * Soupene, E., Lee, H. & Kustu, S. Ammonium/methylammonium transport (Amt) proteins facilitate diffusion of NH3 bidirectionally. _Proc. Natl Acad. Sci. USA_ 99, 3926–3931
(2002). Article CAS Google Scholar * Kustu, S. & Inwood, W. Biological gas channels for NH3 and CO2: evidence that Rh (Rhesus) proteins are CO2 channels. _Transfus. Clin. Biol._ 13,
103–110 (2006). Article CAS Google Scholar * Li, X. D., Lupo, D., Zheng, L. & Winkler, F. Structural and functional insights into the AmtB/Mep/Rh protein family. _Transfus. Clin.
Biol._ 13, 65–69 (2006). Article CAS Google Scholar * Hall, J. A. & Yan, D. The molecular basis of K+ exclusion by the Escherichia coli ammonium channel AmtB. _J. Biol. Chem._ 288,
14080–14086 (2013). Article CAS Google Scholar * Fong, R. N., Kim, K. S., Yoshihara, C., Inwood, W. B. & Kustu, S. The W148L substitution in the Escherichia coli ammonium channel AmtB
increases flux and indicates that the substrate is an ion. _Proc. Natl Acad. Sci. USA_ 104, 18706–18711 (2007). Article CAS Google Scholar * Lamoureux, G., Javelle, A., Baday, S., Wang,
S. & Berneche, S. Transport mechanisms in the ammonium transporter family. _Transfus. Clin. Biol._ 17, 168–175 (2010). Article CAS Google Scholar * Wang, S., Orabi, E. A., Baday, S.,
Berneche, S. & Lamoureux, G. Ammonium transporters achieve charge transfer by fragmenting their substrate. _J. Am. Chem. Soc._ 134, 10419–10427 (2012). Article CAS Google Scholar *
Baday, S., Wang, S., Lamoureux, G. & Berneche, S. Different hydration patterns in the pores of AmtB and RhCG could determine their transport mechanisms. _Biochemistry_ 52, 7091–7098
(2013). Article CAS Google Scholar * Liepe, J. et al. A framework for parameter estimation and model selection from experimental data in systems biology using approximate Bayesian
computation. _Nat. Protoc._ 9, 439–456 (2014). Article CAS Google Scholar * Morohashi, M. et al. Robustness as a measure of plausibility in models of biochemical networks. _J. Theor.
Biol._ 216, 19–30 (2002). Article CAS Google Scholar * Bates, D. G. & Cosentino, C. Validation and invalidation of systems biology models using robustness analysis. _IET Syst. Biol._
5, 229–244 (2011). Article CAS Google Scholar * Tummler, K. & Klipp, E. The discrepancy between data for and expectations on metabolic models: How to match experiments and
computational efforts to arrive at quantitative predictions? _Curr. Opin. Syst. Biol._ 8, 1–6 (2018). Article Google Scholar * Miskovic, L., Tokic, M., Fengos, G. & Hatzimanikatis, V.
Rites of passage: requirements and standards for building kinetic models of metabolic phenotypes. _Curr. Opin. Biotechnol._ 36, 146–153 (2015). Article CAS Google Scholar * Maeda, K.,
Boogerd, F. C. & Kurata, H. libRCGA: a C library for real-coded genetic algorithms for rapid parameter estimation of kinetic models. _IPSJ Trans. Bioinform._ 11, 31–40 (2018). Article
Google Scholar * Ji, X. & Xu, Y. libSRES: a C library for stochastic ranking evolution strategy for parameter estimation. _Bioinformatics_ 22, 124–126 (2006). Article CAS Google
Scholar * Balsa-Canto, E., Henriques, D., Gabor, A. & Banga, J. R. AMIGO2, a toolbox for dynamic modeling, optimization and control in systems biology. _Bioinformatics_ 32, 3357–3359
(2016). Article CAS Google Scholar * Runarsson, T. P. & Yao, X. Stochastic ranking for constrained evolutionary optimization. _IEEE Trans. Evol. Comput._ 4, 284–294 (2000). Article
Google Scholar * Schneider, C. A., Rasband, W. S. & Eliceiri, K. W. NIH Image to ImageJ: 25 years of image analysis. _Nat. Methods_ 9, 671–675 (2012). Article CAS Google Scholar
Download references ACKNOWLEDGEMENTS We thank JD Rabinowitz, M Merrick, T Hwa, M Kim, M Barahona, A Gosztolai, and J Schumacher for providing us extra data on details of their papers. We
thank FJ Bruggeman, E Murabito, Y Matsuoka, and M Iida for scientific suggestions. The super-computing resource was provided by the Human Genome Center, Institute of Medical Science, the
University of Tokyo. This work was supported by Grant-in-Aid for Young Scientists (18K18153) and Grant-in-Aid for Scientific Research (B) (16H02898) from Japan Society for the Promotion of
Science, and partially supported by Aid for Research Abroad from Yoshida Foundation for Science and Technology. This work was further financially supported by the Netherlands Organization
for Scientific Research (NWO) in the integrated program of WOTRO (W01.65.324.00/project 4) Science for Global Development as well as by various systems biology grants, including Synpol:
EU-FP7 (KBBE.2012.3.4-02 #311815), Corbel: EU-H2020 (NFRADEV-4-2014-2015 #654248), Epipredict: EU-H2020 MSCA-ITN-2014-ETN: Marie Skłodowska-Curie Innovative Training Networks (ITN-ETN)
#642691, BBSRC China: BB/J020060/1. AUTHOR INFORMATION AUTHORS AND AFFILIATIONS * Frontier Research Academy for Young Researchers, Kyushu Institute of Technology, Kitakyushu, Fukuoka, Japan
Kazuhiro Maeda * Department of Bioscience and Bioinformatics, Kyushu Institute of Technology, Iizuka, Fukuoka, Japan Kazuhiro Maeda & Hiroyuki Kurata * Department of Molecular Cell
Biology, Faculty of Science, VU University Amsterdam, O|2 building, Amsterdam, Netherlands Hans V. Westerhoff & Fred C. Boogerd * Manchester Centre for Integrative Systems Biology,
Manchester Interdisciplinary Biocentre, School of Chemical Engineering and Analytical Science, The University of Manchester, Manchester, UK Hans V. Westerhoff * Synthetic Systems Biology and
Nuclear Organization, Swammerdam Institute for Life Sciences, University of Amsterdam, Amsterdam, Netherlands Hans V. Westerhoff * Biomedical Informatics R&D Center, Kyushu Institute of
Technology, Iizuka, Fukuoka, Japan Hiroyuki Kurata Authors * Kazuhiro Maeda View author publications You can also search for this author inPubMed Google Scholar * Hans V. Westerhoff View
author publications You can also search for this author inPubMed Google Scholar * Hiroyuki Kurata View author publications You can also search for this author inPubMed Google Scholar * Fred
C. Boogerd View author publications You can also search for this author inPubMed Google Scholar CONTRIBUTIONS K.M., H.V.W., H.K. and F.C.B. conceived the study. K.M. developed the
methodology with guidance and input from all authors. H.V.W. and H.K. supervised the study. K.M., H.V.W. and F.C.B. wrote the manuscript with input from H.K., K.M. and F.C.B. assembled the
Supplementary Information. CORRESPONDING AUTHORS Correspondence to Hans V. Westerhoff or Hiroyuki Kurata. ETHICS DECLARATIONS COMPETING INTERESTS The authors declare no competing interests.
ADDITIONAL INFORMATION PUBLISHER’S NOTE: Springer Nature remains neutral with regard to jurisdictional claims in published maps and institutional affiliations. SUPPLEMENTARY INFORMATION
SUPPLEMENTARY INFORMATION TABLES S1 - S4 AND S10 - S13 SIMULATION PROGRAM IN MATLAB RIGHTS AND PERMISSIONS OPEN ACCESS This article is licensed under a Creative Commons Attribution 4.0
International License, which permits use, sharing, adaptation, distribution and reproduction in any medium or format, as long as you give appropriate credit to the original author(s) and the
source, provide a link to the Creative Commons license, and indicate if changes were made. The images or other third party material in this article are included in the article’s Creative
Commons license, unless indicated otherwise in a credit line to the material. If material is not included in the article’s Creative Commons license and your intended use is not permitted by
statutory regulation or exceeds the permitted use, you will need to obtain permission directly from the copyright holder. To view a copy of this license, visit
http://creativecommons.org/licenses/by/4.0/. Reprints and permissions ABOUT THIS ARTICLE CITE THIS ARTICLE Maeda, K., Westerhoff, H.V., Kurata, H. _et al._ Ranking network mechanisms by how
they fit diverse experiments and deciding on _E. coli_'s ammonium transport and assimilation network. _npj Syst Biol Appl_ 5, 14 (2019). https://doi.org/10.1038/s41540-019-0091-6
Download citation * Received: 12 October 2018 * Accepted: 12 March 2019 * Published: 12 April 2019 * DOI: https://doi.org/10.1038/s41540-019-0091-6 SHARE THIS ARTICLE Anyone you share the
following link with will be able to read this content: Get shareable link Sorry, a shareable link is not currently available for this article. Copy to clipboard Provided by the Springer
Nature SharedIt content-sharing initiative


