- Select a language for the TTS:
- UK English Female
- UK English Male
- US English Female
- US English Male
- Australian Female
- Australian Male
- Language selected: (auto detect) - EN
Play all audios:
ABSTRACT The potential-pH diagram, a graphical representation of the thermodynamically predominant reaction products in aqueous corrosion, is originally proposed for the corrosion of pure
metals. The original approach only leads to stoichiometric oxides and hydroxides as the oxidation products. However, numerous experiments show that non-stoichiometric oxide scales are
prevalent in the aqueous corrosion of alloys. In the present study, a room temperature potential-pH diagram considering oxide solid solutions, as a generalization of the traditional
potential-pH diagram with stoichiometric oxides, is constructed for an FCC single-phase multi-principal element alloy (MPEA) based on the CALculation of PHAse Diagram method. The predominant
reaction products, the ions in aqueous solution, and the cation distribution in oxides are predicted. The oxide solid solution is stabilized by the mixing free energy (or mixing entropy)
and the stabilizing effect becomes more significant as the temperature increases. Consequently, solid solution oxides are stable in large regions of the potential-pH diagram and the mixing
free energy mostly affects the equilibrium composition of the stable oxides, while the shape of stable regions for oxides is mostly determined by the structure of the stable oxides.
Agreements are found for Ni2+, Fe2+, and Mn2+ between the atomic emission spectroelectrochemistry measurements and thermodynamic calculations, while deviations exist for Cr3+ and Co2+
possibly due to surface complexation with species such as Cl− and the oxide dissolution. By incorporating the solution models of oxides, the current work presents a general and more accurate
way to analyze the reaction products during aqueous corrosion of MPEAs. SIMILAR CONTENT BEING VIEWED BY OTHERS A PERCOLATION THEORY FOR DESIGNING CORROSION-RESISTANT ALLOYS Article 01
February 2021 ELEMENTAL PARTITIONING AND CORROSION RESISTANCE OF NI–CR ALLOYS REVEALED BY ACCURATE AB-INITIO THERMODYNAMIC AND ELECTROCHEMICAL CALCULATIONS Article Open access 14 December
2023 A FIRST-PRINCIPLES ANALYSIS OF THE CHARGE TRANSFER IN MAGNESIUM CORROSION Article Open access 14 September 2020 INTRODUCTION Degradation by aqueous corrosion is ubiquitous for materials
under various environments, causing significant damage to structural and functional engineered components in most industrial sectors1,2. The predominant electrochemical and chemical
reactions governing material degradation processes can be represented by the potential-pH diagram, a pioneering approach advanced by Marcel Pourbaix (hence also named Pourbaix diagram)3,4.
In this diagram, the regions for thermodynamically predominant reaction products (e.g., aqueous complexes, oxides, hydroxides, oxy-hydroxides, etc.) are plotted as a function of the pH of
water (or aqueous solution) and electrode potential (_E_) based on the minimization of the Gibbs energies of formation for all the possible reactions, in order to distinguish the _E_-pH-_T_
conditions for immunity, active corrosion, and passivity of a given element2,3,4,5,6. Originally, the _E_-pH diagram was proposed for the predominant reactions between pure metals and an
aqueous solution containing dissolved H+, OH−, H2, and O23,4. The solid reaction products were limited to the metal–hydrogen–oxygen (M–H–O) type of compounds, hence referred to as M–H–O type
_E_-pH diagram2,3,4,5,6. To construct the _E_-pH diagrams by calculation, independent reactions involving solid and aqueous products are listed with their reaction thermodynamics, and the
equilibrium of reactions correspond to the boundaries between predominant species. Such diagrams cannot be applied to predict the dissolution of an alloy composed of multiple metallic
elements6. A common way to predict the dissolution and the predominant reaction products of an alloy using such diagrams is to superimpose several independent _E_-pH diagrams for pure
metals. However, this method cannot yield an accurate prediction of the predominant reaction products in such situations6,7. To overcome this obstacle, the _E_-pH diagrams for binary
Fe–Cu8,9, Fe–Cr8,10, Fe–Ni7, and Ni–Cr alloys7 were constructed focusing on the effect of multi-metallic oxides in comparison with _E_-pH diagrams for pure metals. It was found that the
passivity regions for alloys were larger due to the formation of multi-metallic oxides7. For example, the NiFe2O4 spinel phase in the corrosion of Ni–Fe alloys cannot be predicted by simply
superimposing the _E_-pH diagrams of Ni and Fe, since NiFe2O4 is not present in either of them6,7. Using the thermodynamic data for oxides from binary alloys, the _E_-pH diagram for Fe–Cr–Ni
alloy was constructed, which consequently resembled the combination of _E_-pH diagrams for binary alloys7. Moreover, the heat capacities of ions were estimated by the Criss–Cobble method11,
which is only applicable to charged aqueous complexes. The _E_-pH diagram for Fe–Cr–Ni alloy was revised with updated thermodynamic data for spinel oxides (i.e., NiCr2O4, FeCr2O4,
NiFe2O4)12 and the modified Helgeson–Kirkham–Flowers model was adopted to further incorporate the uncharged aqueous species13,14. However, in these _E_-pH diagrams, the metallic elements
were assumed to be in their standard states with unit activities and the thermodynamics resulting from alloying was not considered7,8,9,10,12. The _E_-pH diagram is exceedingly complex for
multicomponent alloys (more than three alloy elements), mostly due to a large number of possible oxides as reaction products. Moreover, in the case of aqueous solutions containing various
salts, species, and phases (e.g., sulfur- and chlorine-containing species) not encountered in the M–H–O type _E_-pH diagrams are expected to be stable under certain _E_-pH conditions. The
lack of thermodynamic data for these possible reaction products has become the major obstacle in constructing the _E_-pH diagram for complex systems. With the advent and popularization of
first-principles calculations based on the density functional theory (DFT) in materials research, the free energy of the predominant species can be calculated given their crystal structures
without experimental input15,16. However, the accuracy of this approach in determining phase boundary is inevitably limited by the inherent uncertainty in energies from first-principles
calculations, i.e., up to ±0.5 eV per atom for certain oxides15. Moreover, the difficulty arises when attempting to model the aqueous solution or disordered non-stoichiometric solid phases
in DFT, which requires exceptionally large simulation cells and poses computational challenges17. In recent decades, thermodynamic databases for multicomponent systems based on the
methodology called CALculation of PHAse Diagram (CALPHAD) has been widely applied to materials design. In this method, a thermodynamic model is fitted to the thermochemical data for a phase
or equilibrium for phase transformations from experiments. This enables optimization of the corresponding thermodynamic parameters so that an analytical expression of the Gibbs energy as a
function of temperature and composition can be obtained18. This is a very active field of materials research and has been successfully applied to the design of various materials19. Employing
the Redlich–Kister polynomials18, the excess Gibbs energy due to the non-ideal thermodynamic interactions between components in complex systems can be efficiently represented without
significantly increasing the number of fitting parameters18. Moreover, thermodynamic parameters for sub-systems can be directly adopted to describe the thermodynamics of higher-order
systems, making it convenient to further develop the database for multicomponent systems (e.g., commercial alloys)18,19. The Gibbs energy of formation can be obtained with CALPHAD-type
thermodynamic databases for chemical-free energy and the Nernst potential for the energy change associated with charge transfer6,7 for a large number of phases in multicomponent systems.
This significantly increases the capability for the analysis of complex systems, such as in the case of aqueous corrosion of commercial alloys20,21. Such approaches have been adopted to
analyze the aqueous corrosion of stainless steels20,21,22,23,24, SAM40 amorphous steel coatings25,26, Ni-based superalloys1,27, and multi-principal element alloys (MPEAs, or high entropy
alloys, HEAs)28,29. The previous _E_-pH diagrams for alloys are calculated considering only stoichiometric oxides along with other compounds, mostly due to the complexity in thermodynamics
of non-stoichiometric oxides. However, non-stoichiometric oxides are increasingly prevalent in the aqueous corrosion of many alloys as the chemistry of the metallic materials becomes more
complicated. Non-stoichiometric corundum (Fe,Cr)2O3 and spinel (Fe,Cr,Ni)3O4 were characterized in the oxide scales by transmission electron microscopy (TEM) instruments equipped with
energy-dispersive spectroscopy (EDS) for 316 and 304 stainless steels in pressurized water at high temperatures30,31. Huang et al. observed the non-stoichiometric spinel Ni_x_Fe1−_x_Fe2O4
and Ni_x_Fe1−_x_Cr2O4 of Ni-based superalloy in high-temperature alkaline environments30,31. Although attempts were made to model the non-stoichiometric spinel in the _E_-pH diagram, the
non-stoichiometric oxides were treated as a mechanical mixture of the stoichiometric endmembers, therefore, the solid solution nature of oxides was not considered32,33. In the corrosion of
Ni-22%Cr-6%Mo (wt. %) alloy in aqueous solution at pH 4 with K2S2O8 and Na2SO4, non-stoichiometric halite (Ni,Cr)O was observed, which is attributed to the kinetic “solute capture” effect
due to the fast passivation (compared with the diffusion of elements) process34. A recent review showed the formation of various complex oxides in aqueous corrosion and high-temperature
oxidation of refractory HEAs35. Recently, a non-stoichiometric oxide solid solution was also observed by 3D-atom probe tomography (3D-APT) and X-ray photoelectron spectroscopy (XPS) during
passivation of 38Ni-21Cr-20Fe-13Ru-6Mo-2W (at. %) high entropy alloy in sulfate solutions36. A solid solution oxide was also observed on a 38Ni-20Fe-22Cr-10Mn-10Co (at.%) MPEA passivated in
NaCl at pH 4 and −0.25 V vs. saturated calomel electrode (SCE)37. Therefore, the solution nature of oxides as a generalization of stoichiometric ones should be incorporated in the
construction of _E_-pH diagrams to predict the predominant reactions observed during the corrosion of such complex alloys. Calculation of _E_-pH diagrams with an oxide solid solution is more
challenging since the non-stoichiometric oxides modeled as solid solutions would require more thermodynamic interaction parameters on certain sublattices compared with the stoichiometric
oxides. In addition, the numerical process of minimizing the Gibbs energy becomes even more demanding due to the extra thermodynamic parameters in thermodynamic models for solutions. In the
current work, we investigated the predominant reactions in heterogeneous interaction systems between 10−2 mol of FCC single-phase MPEA Ni38Fe20Cr22Mn10Co10 (at.%, denoted as Cr22
hereafter)37 and 1 kg of water containing 0.6 mol NaCl at 25 °C and 1 atm ambient pressure. The non-stoichiometric oxides were modeled by the compound energy formulism (CEF or sublattice
model) in CALPHAD approach18. The effects of mixing of cations on stability of oxides, the _E_-pH diagrams, the molality (i.e., moles of solute per kg of solvent, denoted as ‘m’) of
predominant ions in aqueous solution, and stability of solid oxide solution phases were analyzed. The calculations were validated by the experimental results of the dissolved ions in an
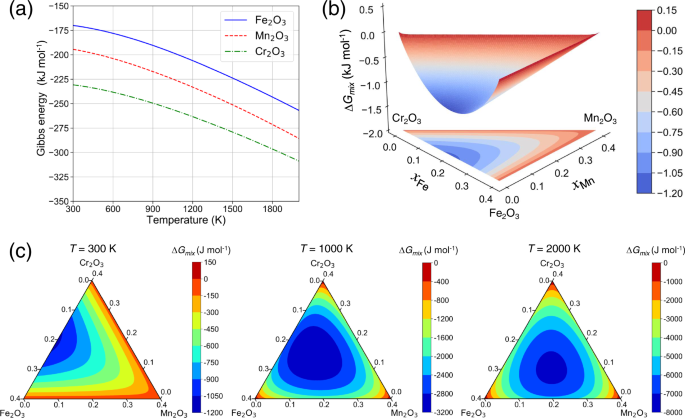
aqueous solution. RESULTS THERMODYNAMIC MODELING OF OXIDES The free energy of stoichiometric corundum, i.e., Cr2O3, Fe2O3 and Mn2O3, and oxide solution (Cr, Fe, Mn)2O3 are calculated to
reveal the stability of non-stoichiometric oxides vs. their stoichiometric counterparts. For stoichiometric phases, the Gibbs energy is modeled by Eq. (2) in the “Methods” section and is
only dependent on the temperature as shown in Fig. 1a. The non-stoichiometric oxides can be modeled by the CEF with the mixing of alloy elements on certain sublattices. In Fig. 1b, the
surface for the mixing free energy of corundum oxide solution (Cr, Fe, Mn)2O3 is shown. The mixing of Cr and Fe stabilizes (Cr, Fe, Mn)2O3 while mixing with Mn is not favored on the cation
sublattice. As temperature increases, the mixing free energy decreases significantly due to the role of mixing entropy and mixing of Cr, Fe, and Mn are expected on the sublattice for
cations. If the temperature is high enough, the role of chemical interactions becomes less important and the system will approach the ideal mixing limit, indicated by the fact that the
composition corresponding to the minimum of Δ_G_mix approaches the equimolar limit on the cation sublattice (Fig. 1c). Therefore, the mixing of alloy elements will lead to a decrease in
mixing free energy, which stabilizes the corundum oxide solution. And the stabilizing effect becomes much more significant at high temperatures. _E_-PH DIAGRAM WITH STOICHIOMETRIC OXIDES The
_E_-pH diagram of Cr22 MPEA, and various compounds (e.g., oxide, hydroxide and oxy-hydroxides) at 25 °C and 1 atm ambient pressure is calculated for the heterogeneous interaction between
10−2 mol of alloy (i.e., N(Ni) = 3.8 × 10⁻³ mol, N(Fe) = 2 × 10⁻³ mol, N(Cr) = 2.2 × 10⁻³ mol, N(Mn) = 1 × 10⁻³ mol, N(Co) = 1 × 10⁻³ mol) and 1 kg H2O containing 0.6 m of NaCl. The standard
hydrogen electrode (SHE) is chosen as the reference for the electrode potential. To assess the thermodynamic stability of the alloy, the pseudo-binary phase diagram of
Ni(60−_x_)Fe20Cr_x_Mn10Co10 (at.%) is calculated, which reveals a large single-phase region for FCC phase from 905 to 1611 K for _x_ = 22 (Supplementary Fig. 1). Hence, only the FCC phase is
considered for the Cr22 MPEA in the calculations of _E_-pH diagrams. To reveal the complete stability regions of oxide phases, both gas phases and gaseous species dissolved in aqueous
solution (i.e., H2 and O2) are excluded from the calculation, which otherwise would be overlaid with the reaction products and covered by gas-phase regions of predominance existing outside
of the 1.23 V vs. SHE, a wide region of water stability. The calculated _E_-pH diagram for Cr22 MPEA with stoichiometric oxides is shown in Fig. 2. The lower and upper dashed lines denote
the pH and potential where water decomposes to 1 atm gaseous H2 and O2, respectively, and are referred to as hydrogen evolution reaction (HER) and oxygen evolution reaction (OER). Immunity
is defined as the scenario where the metal is stable and none of the metallic elements is oxidized7. Hence, neither solid corrosion product is formed nor do the metallic elements dissolve
into an aqueous solution in the immunity region. In the current work, an _E_-pH condition is considered immunity if no solid reaction product is formed and the largest concentration of all
the dissolved ions for each applicable alloy elements is <10−6 m6,7,8,9,10,12 (see region 1 in Fig. 2). Other commonly used criteria for critical ion concentration included 10−6 gram-atom
per liter3,4, 10−8 m12, and ion activity of 10−6 5, etc. Various critical ion concentrations of different magnitudes were also adopted to examine its effect on phase boundaries3,4,5,6. Note
that the choice of critical ion concentration for the definition of immunity is arbitrary and modifications might be more appropriate for particular applications3,4. With this criterion,
the critical potential for the onset of dissolution at low pH, i.e., the upper boundary of the immunity region, is predicted to be −1.31 V vs. SHE (line between region 1 and 2 in Fig. 2).
This critical potential between immunity and active dissolution is determined by the chemical potential of the most active elements in the alloy, i.e., Mn in Cr22 MPEA. Similarly, the
highest potential under which the dealloyed FCC phase can be stable (between region 2 and 3 in Fig. 2) is determined by the most inert alloy element, i.e., Ni in Cr22 MPEA. The right
boundary of the immunity region is determined by the formation of Cr2O3 corundum at high pH (between region 1 and 14 in Fig. 2). With increased potential at low pH, the alloy elements
dissolve into the aqueous solution and are stable as ions. As such, no solid species is formed even as all the metallic elements are dissolved (green region in Fig. 2), which corresponds to
active corrosion. Passivity is defined as the region in _E_-pH diagram where solid reaction products are thermodynamically stable. Note that thermodynamics alone cannot determine whether the
solid reaction products will stay in a stable and protective form for a given time or not, thus an experimental input is required to support the thermodynamic prediction5,29. In Fig. 2,
regions 4–29 predict various thermodynamically stable solid compounds including oxides, hydroxides, and oxy-hydroxides. Two corundum phases Fe2O3 and Cr2O3 are predicted to be stable in Fig.
2, with Fe2O3 being stable over regions 5–10 and 15 while Cr2O3 would be stable over 9–11, 19–20, 22–23, 26, and 29. Note that Fe2O3 corundum is mainly stable at high potentials while Cr2O3
is stable at low and medium potentials. Multiple spinels are thermodynamically stable over regions 16–27 and would coexist as a mixture. In the calculation, the stable region of NiO and
Ni(OH)2 always coincide with each other, which is due to the closeness between the free energy of reactions that produce NiO and Ni(OH)2 at room temperature38. Considering that NiO and
Ni(OH)2 usually coexist as complex corrosion products in experiments38,39,40,41, the region for NiO and Ni(OH)2 is labeled “NiO/Ni(OH)2”. Dissolved gaseous species (i.e., H2 and O2) in the
aqueous solution can also play important roles in corrosion processes. For example, water or proton reduction in the stable region for H2 affects the initiation of stress corrosion
cracking42 and reduction of dissolved oxygen as a cathodic half-cell reaction occurring below OER line in the stable region for water and hydroxyl enable spontaneous corrosion43. To analyze
the effects of dissolved gaseous species on the stability of metallic species outside the stable region for water, the _E_-pH diagram for Cr22 MPEA is also calculated with the H2 and O2 gas
phases excluded while dissolved gaseous species are included (Supplementary Fig. 2). This corresponds to the situation where the reactions producing gaseous species are slow due to higher
kinetic barriers than other reactions, hence the gas phases can be excluded44. The diagram with gaseous species in aqueous solution is the same as the one without gaseous species (Fig. 2)
within the stable region for water (between the potentials for HER and OER). Above the potential for OER, water is thermodynamically unstable and the transition to O2 species (i.e.,
\(2{\mathrm{H}}_2{\mathrm{O}} \to {\mathrm{O}}_2 + 4{\mathrm{H}}^ + + 4{{e}}^ -\)) is favored. Since the gas phases are excluded in the analysis, the aqueous solution will be oversaturated
with dissolved O2 species above OER. As a result, several horizontal boundaries of oxides at high potentials are predicted, which agree with the features in the calculated _E_-pH diagrams
for C-22 alloy with gaseous species in aqueous solutions27. Below the potential for HER (lower dashed line in Supplementary Fig. 2), the aqueous solution will be saturated with H2 species
and the calculations do not converge if the concentration of H2 species in the aqueous solution becomes unrealistically large (red region in Supplementary Fig. 2). _E_-PH DIAGRAM WITH
NON-STOICHIOMETRIC OXIDES To incorporate the solution nature of the non-stoichiometric oxides, the CEF with multiple sublattices is adopted, where the site fractions of elements on each
sublattice are optimized to find the equilibrium composition of the corresponding phase. However, the sublattice model introduces a large number of site fractions as the degrees of freedom
(DOFs) in the Gibbs energy minimization process. A large number of DOFs pose challenges to the numerical convergence and make it more difficult to find the equilibrium state (defined by the
global minimum in free energy). For example, to analyze the reactions involving spinel phase with three possible metallic elements (e.g., Fe, Ni, Cr), only the amounts of spinel phases
(e.g., moles of FeCr2O4, NiCr2O4, NiFe2O4, Fe3O4, etc.) are needed in the optimization if spinel phases are assumed to be stoichiometric. However, for spinel solid solution modeled using CEF
as (Cr2+, Cr3+, Fe2+, Fe3+, Ni2+)1(Cr3+, Fe2+, Fe3+, Ni2+, Va)2(Cr2+, Fe2+, Va)2(O2-)4, with Va denoting vacancy45, the numbers of DOFs for three sublattices of cations are 4, 4, and 2,
respectively. Therefore, 10 more DOFs are needed to find the equilibrium state in addition to the amounts of spinel phases. The number of DOFs in numerical optimization will dramatically
increase with the number of oxide solid solution phases. This further complicates the calculation that already involves two solution phases, i.e., aqueous solution and the FCC phase of the
alloy. To track the accurate positions of phase boundaries, a larger number of calculations for the equilibrium state under specified conditions, which, although challenging, can still be
handled by POLY-3 module in Thermo-Calc if all oxides are assumed to be stoichiometric. Current numerical tests show that, if the oxides are allowed to be non-stoichiometric and CEF is
adopted to describe their thermodynamics, the POLY-3 module in Thermo-Calc fails to reach numerical convergence due to the large number of DOFs for the site fractions. After removing the
unreasonable output data due to the convergence issue, some regions of the output diagram show noisy data (Figs. 3, 5, 9 and Supplementary Fig. 3). This makes it difficult to automatically
track the phase boundaries of non-stoichiometric oxides on _E_-pH diagram using POLY-3 module. With the free energy minimization in POLY-3 module, the equilibrium state can be determined for
a given set of conditions (namely temperature, pressure, amount of water, amount of the alloy, and concentrations of dissolved species), which corresponds to a single point on the _E_-pH
diagram. To manually track the boundaries for predominant reactions, the equilibrium information from many combinations of _E_-pH conditions are collected. The unreasonable results due to
numerical non-convergence are excluded, and then the phase boundaries are determined accordingly. To test the validity of this approach, the variations of predominant reaction products as a
function of pH at 0.5 V vs. SHE and as a function of potential at pH = 4 are analyzed. At 0.5 V vs. SHE and pH lower than 2, no oxide is predicted to be stable as shown in Fig. 3a, b. Here,
the sum of concentrations of cations in the aqueous solution reaches the corresponding amount of elements in the alloy, i.e., 3.8 × 10⁻³ m, 2 × 10⁻³ m, 2.2 × 10⁻³ m, 1 × 10⁻³ m, 1 × 10⁻³ m
for Ni2+, Fe2+, Cr3+, Mn2+, and Co2+, respectively. Under such conditions, the aqueous solution is the only stable phase and all the alloy elements are dissolved, indicating active corrosion
of the alloy. As pH increases, solid solution corundum and spinel containing various elements but not all, as well as stoichiometric Ni6MnO8 and NiMnO3, are predicted to be stable,
meanwhile dissolved Cr and Ni hydroxide ions become stable in aqueous solution. If the potential is low enough at pH = 4, only the FCC solid solution, other than the aqueous solution, is
predicted to be stable. As such, the concentrations of all the ions in the aqueous phase are below a threshold value of 10−6 m, indicating thermodynamic immunity to corrosion6,7,8,9,10. As
potential increases, the concentration of Mn2+ surpasses 10−6 m at the critical potential of −1.31 V vs. SHE, and dealloying by the dissolution of Mn begins. Although Mn starts to dissolve
under such conditions, the other alloy elements (namely Ni, Fe, Cr, and Co) remain unoxidized in the alloy, thus the FCC phase with a different composition from the bulk Cr22 MPEA is still
stable (Supplementary Fig. 3). At further increased potentials, oxide solution corundum and spinel, in addition to Fe oxy-hydroxide (FeOOH), are predicted to be stable. Note that the
critical potential for the onset of active corrosion (i.e., −1.31 V vs. SHE) in Fig. 3 for non-stoichiometric oxides is the same as reported in Fig. 2 since the metal is directly oxidized to
aqueous cations in a low pH region and none of the oxides are stable. Hence, the solution nature of oxides does not affect certain electrochemical reactions at relatively low potentials. In
case of heterogeneous distribution of alloy elements or phase separation in the parent alloy, preferential dissolution could lead to local curvatures in morphology, which depend on the
scale of the compositional inhomogeneities and may change the local potential46,47. Such behavior cannot be analyzed using the current approach with the thermodynamics of bulk phases. With
the results from many single-point (_E_-pH) equilibrium calculations, the regions of stability on the _E_-pH diagram for each non-stoichiometric oxide are manually tracked and their borders
are converted to phase boundary lines, as shown in Fig. 4. Compared with Fig. 2, the regions for immunity, dealloying of the FCC phase, and active corrosion are almost the same as Fig. 4.
However, the phase boundaries in the passivity region of Fig. 4 are very different. Considering non-stoichiometric oxides modeled by CEF, oxide solid solution phases, i.e., corundum
(Fe,Cr)2O3, spinel (Fe,Ni,Cr,Mn,Co)3O4, cubic (Co,Fe)2O3, and (Ni,Mn)2(Ni,Mn,O)3 with space group \({\mathrm{Ia}}\bar 3\) (prototype cubic Mn2O3), are found to be stable over large portions
of the _E_-pH diagram. The findings of corundum and spinel are broadly consistent with XPS and 3D-APT results on Cr22 where Ni, Cr, Fe, Mn, Co are detected in the oxide formed during
passivation in non-stoichiometric proportions with binding energies that cannot rule out corundum and spinels37. The oxide solution-phase modeled by CEF is a general case and reduces to the
pure stoichiometric version if the alloying elements are limited. Comparing the stable regions for stoichiometric with non-stoichiometric oxides (e.g., Cr2O3 + Fe2O3 in Fig. 2 vs. corundum
solid solution in Fig. 4), the phase boundaries are moved although the shapes of stable regions are not changed significantly for both corundum and spinel solid solution phases. Therefore,
the mixing of alloy elements on the sublattices of oxide structures is important in determining the stability and composition of oxide scales during passivation. The concentrations of the
dominant ions in the aqueous solution can also be determined from the single-point equilibrium calculations. The variations in the concentrations of several ions are shown in Fig. 5.
Numerical tests demonstrated that ion concentration <10−9 m is no longer reliable with current settings for equilibrium calculations (see “Methods” section). Hence, the distribution of
ions with concentration varying from 10−2 to 10−9 m are shown. The distribution maps for most of the ions (e.g., Ni2+, Fe2+, Fe3+, Cr2+, Cr3+, and CrO42−) follow similar shapes as the
threshold values change, while those for Mn2+ and Co2+ change due to the formation of other oxides or hydroxides. Note that, distribution maps for some ions (especially for Co2+) shows
irregular noisy data, which are due to the numerically non-convergent single-point calculations. For practical purposes, ions with concentration <10−6 m will be difficult to detect and
may be ignored in the analysis6,7,8,9,10. Therefore, the threshold value of 10−6 m is used to show the variation of the dominant ions in the aqueous solution as a function of potential and
pH, shown in Fig. 6. At two regions on the diagram, there are no ions in the aqueous solution, namely the immunity region, and low potential/high pH region (i.e., labeled 32 in Fig. 6). The
former is expected as there are no alloy elements dissolved in an aqueous solution within the immunity region. For the latter, the numerical calculations show that all the metallic elements
either remain in dealloyed FCC phase or form solid stable species such as oxides, hydroxides, and oxy-hydroxides. Other than these two pH domains (i.e., regions 1 and 32 in Fig. 6), the
predominant ions in aqueous solution oxidized from alloy are shown. At regions with low potential or pH, cations for metallic elements with various valence states are dominant. Other ions,
namely chromate (VI) anions, manganate (VII) anion, and hydroxide ions with positive (e.g., Cr(OH)2+), negative (e.g., Ni(OH)3−), or neutral complexes (e.g., Ni(OH)2), becomes prevalent with
increasing potential and pH. CATION DISTRIBUTION IN OXIDES The non-stoichiometric spinel, corundum, and cubic M2O3 modeled by CEF are predicted to be stable under certain conditions for
Cr22 MPEA, shown in Figs. 7, 8 and Supplementary Fig. 4, respectively. Despite some shifts in phase boundaries, the regions for non-stoichiometric oxides overlap with combined regions of
their stoichiometric counterparts. The molar fractions (denoted as _x_) of alloy elements in spinel and corundum are shown in Figs. 7 and 8, respectively. Although the non-stoichiometric
spinel phase is stable in large regions with high pH, several boundaries can be identified following the distribution of elements. At low potentials, Cr and Mn are the dominant cations with
\(x\left( {{\mathrm{Cr}}} \right) \approx 28.6\,\%\) and \(x\left( {{\mathrm{Mn}}} \right) \approx 14.3\,\%\) indicating stoichiometric MnCr2O4 spinel. At increase potential (−0.5 to 0.7 V
vs. SHE) and medium pH (3.5–6) approximately, a spinel close to CoCr2O4 is the dominant species. As potential and pH further increase, Cr is absent in spinel while mixing of Ni, Fe, Mn, and
Co cations are prevalent in the spinel phase. Similarly, for non-stoichiometric corundum, the stable regions with different dominant cations can be identified. Corundum Fe2O3 and Cr2O3 are
predicted to be stable at high and low potential regions, respectively. Corundum oxide solution (Fe,Cr)2O3 is predicted to be stable at medium potentials. For cubic M2O3, oxide solutions
(Ni,Mn)2(Ni,Mn,O)3 and (Co,Fe)2O3 are predicted to be stable at medium and high potentials, respectively (Supplementary Fig. 4). Note that, different from corundum and spinel oxide
solutions, mixing of O with cations is predicted on the sublattice for O in cubic M2O3 oxide solution at medium potentials so that the sum of the molar fractions of Ni and Mn is larger than
40%. The current calculations employing the CALPHAD-type databases only included the thermodynamics of bulk phases. Therefore, it cannot predict the phase stability as altered or modified by
interfaces/surfaces, defects, strain energy, or kinetic processes18. For electrochemical stability under more complex environmental factors (e.g., nanofilms in aqueous solution),
corrections to thermodynamics of equilibrium bulk phases are necessary to account for the effects due to surface energy (or size effects), surface termination, water adsorption, substrate,
etc48. In addition, the metastable phase defined by local free energy minimums will not appear in the calculated diagram since the global minimum of Gibbs energy is searched for each
single-point equilibrium calculations. In the current analysis for Cr22 MPEA, stoichiometric Ni2+ based halite is predicted to be stable while solid solution halite (Ni,Cr)O was observed in
the experiments on Ni-22Cr-6Mo (wt.%) alloy by Yu et al.34. To further understand the reason for the stoichiometry of halite, the solubility of elements in halite phase in equilibrium with
other phases in Ni–Fe–Cr–Mn–Co–O system is plotted as a function of temperature (Supplementary Fig. 5). At 300 K, the equilibrium molar fraction of Mn and Fe are 0.13 % and 0.015 %,
respectively, while those of Co and Cr are zero. Therefore, non-stoichiometric halite is not stable in _E_-pH diagram of Cr22 MPEA at 25 °C due to the fact that other cations do not tend to
mix with Ni (II) on the cation sublattice of NiO halite. EXPERIMENTAL VALIDATION To evaluate the current thermodynamic analysis with an experiment, the atomic emission
spectroelectrochemistry (AESEC)49,50,51,52 was introduced to measure the total quantity of dissolved alloy components in aqueous solution, which was shown to be consistent with the 3D-APT
and XPS analysis36,37,52,53. AESEC measurements of dissolved alloy components were performed in 0.1 M (i.e., mol per liter or molarity) NaCl, pH = 4 solution at applied potentials from 0.00
to 0.34 V vs. SHE. The dissolved elements from a series of potentiostatic experiments were quantified as integration of the dissolution rate (mol s−1) vs. time (s) curve, then divided by the
total volume of electrolyte (cm3), assuming the density of electrolyte as 1.00 g cm−3. Note that the experimentally measured amount of each element is calibrated based on the assumption
that Ni dissolved completely from the MPEA to the solution, which agrees with the current thermodynamic calculations at pH = 4 (Figs. 3d and 5). Considering that the effect of critical ion
concentration on the boundaries of predominant species is usually examined in logarithmic scale3,4,5,6, the comparison between AESEC measurements and thermodynamic calculations is shown with
logarithmic scale in Fig. 9. To quantify the extent of agreements in between, the relative error is defined as ∣log10 _C_AESEC − log10 _C_calc∣/log10 _C_AESEC, with _C_ as the concentration
of ions (in molality). The calculated concentrations for Ni2+ agree well with the AESEC measurements (<0.1% relative error), supporting the assumption of preferential complete Ni2+
dissolution. The disagreements for Fe2+ at 0.00 and 0.14 V vs. SHE are <3.0%, while the deviations are obvious at 0.24 and 0.34 V vs. SHE (i.e., larger than 71 %). Note that large errors
are found around the transition between competing Fe species (i.e., Fe2+ and (Fe,Cr)2O3), and thus is likely to be caused by the insufficient accuracy of the thermodynamic data. Mn2+ showed
a good agreement in that the largest relative error is ~15 %. Compared with Ni2+, Fe2+, and Mn2+, large deviations are observed for Cr3+ and Co2+, with relative error larger than 100%. In
the thermodynamic analysis, the low concentrations of Cr3+ and Co2+ in the aqueous solution are due to the formation of solid oxide solutions, i.e., spinel (Co,Fe)Cr2O4 with ~1.3 at.% Fe and
13.0 at.% Co and corundum (Fe,Cr)2O3 with ~5 at.% Cr at pH = 4. Recently, at pH = 4 and −0.25 V vs. SCE (−0.006 V vs. SHE), solid solution products (i.e., consistent with spinels and
corundum) were reported in the passive film on Cr22 MPEA37. Factors not captured in the _E_-pH prediction apparently prevail in experiments and mostly hydroxides such as Cr(OH)3 and possibly
Cr containing corundum and spinel prevail as indicated by XPS37. Current thermodynamic analysis indicates that Co and Cr are predicted to form mainly CoCr2O4 at pH = 4 from 0.00 to 0.34 V
vs. SHE (Fig. 7). This is not evident in experiments as Co2+ dissolution is kinetically fast in Cl− and does not appear in oxides formed. In AESEC experiments, Cr showed a non-congruent
dissolution (i.e., lower than the proportional alloy composition) over most of the potential domain investigated in this work, indicating that Cr is present in the oxide film37.
Nevertheless, dissolved Cr and Co cations in the solution were ~1 or 2 orders of magnitude higher than thermodynamic prediction as shown in Fig. 9. DISCUSSIONS In some early _E_-pH diagrams
for alloys, the dissolution potentials for the alloying elements were calculated separately assuming unit activities (i.e., standard states) for alloy elements, and upper boundary of the
immunity region was determined by the dissolution potential of the most active elements at low pH7,8,9,10,12. However, this approach cannot predict the change of equilibrium composition of
the dealloyed phase with increasing potentials since the thermodynamics of the actual alloy phase is not considered. In the current work, the thermodynamics of the alloy phase is treated as
a solid solution modeled by CALPHAD18. The composition of the alloy phase and the amount of dissolved metallic species are calculated via the minimization of Gibbs energy. The thermodynamics
of dealloying behavior is shown by variation of the equilibrium composition of the FCC phase and the concentrations of dissolved species with increasing potentials (Supplementary Figs. 3
and 5). By adopting thermodynamics of the alloy phase, the remaining metallic elements in the alloy and the dissolved species sum up to moles of the alloy with nominal composition.
Therefore, the equilibrium composition of dealloyed FCC phase and the dissolved species can be predicted consistently in this way. Due to the mixing of metallic elements on certain
sublattices, the oxide solution phases can be more stable than stoichiometric ones and the composition of the oxides become non-stoichiometric. Moreover, the boundaries in _E_-pH diagram
with non-stoichiometric oxides become less densely spaced (Fig. 4) since boundaries for stoichiometric ones are merged due to the mixing of cations. At low temperatures (25 °C), the role of
mixing free energy (i.e., −_TS_ with _S_ being the mixing entropy) is limited compared with enthalpy, which is determined by the crystalline structure of oxides. Hence, the _E_-pH ranges of
the stable regions of oxide solution phases are determined by their crystalline structures and do not change significantly due to mixing. For an alloy with different composition, the oxide
solutions will form at the same (_E_, pH) conditions as that for Cr22 MPEA as long as the necessary metallic elements are present in the system, although the equilibrium composition of oxide
solid solutions may change inevitably due to the amount of available alloy elements. As temperature increases, the energetic contribution from mixing free energy increases (Fig. 1c) and the
oxide solution phases become more stable at high temperatures. For MPEAs, mixing entropy becomes more significant due to an increased number of principal elements. Therefore, the solid
solution oxides are expected to be more prevalent in the passivation layer of MPEAs at high temperatures. Current tests show clear differences between the predicted amount of ions and that
from AESEC experiments for Co2+ and Cr3+. This could be due to the surface complexation resulted from the formation/dissolution of Cr-based oxide54. Both the depletion and enrichment of Cr
from the oxide have both been observed for an equimolar CrFeCoNiMn MPEA tested in 0.1 M NaCl55 and 0.1 M H2SO456, respectively. It is also reported that Co-based oxide dissolves more rapidly
than other oxides in acidic media57. Based on the thermodynamic analysis and AESEC measurements, we postulate that CoCr2O4 spinel forms first, and then dissolves rapidly in acidic media
following the reaction58: $${\mathrm{CoCr}}_2{\mathrm{O}}_4 + 2{\mathrm{H}}^ + \to {\mathrm{Co}}^{2 + } + {\mathrm{Cr}}_2{\mathrm{O}}_3 + {\mathrm{H}}_2{\mathrm{O}}.$$ (1) Further, Cr2O3
dissolves afterward adding to surface complexation, leading to the phenomenon that Co dissolves congruently while Cr forms oxides, but a large amount of Cr3+ was also detected in the aqueous
solution eventually. Note that the interaction parameters in thermodynamic models are evaluated from the thermal properties of equilibrium bulk phases18. Hence, the effects of surface
adsorption, local curvatures in morphology, defects, interfaces, microstructures, and strain energy cannot be incorporated which will inevitably contribute to the deviations between
thermodynamic calculations and experiments along with kinetic factors. METHODS _E_-PH DIAGRAM CALCULATIONS The thermodynamic descriptions of stoichiometric and non-stoichiometric oxides are
determined by the theoretical models for the free energy, e.g., Gibbs energy for isobaric processes, which is the case for aqueous corrosion under atmospheric conditions. For a
stoichiometric phase _θ_ (i.e., fixed composition), the molar Gibbs energy (\(G_m^\theta\)) within a certain temperature range is only a function of temperature18, $$G_m^\theta - \mathop
{\sum}\limits_i {b_iH_i^{\mathrm{SER}}} = a_0 + a_1T + a_2T{\mathrm{ln}}\left( T \right) + a_3T^2 + a_4T^{ - 1} + a_5T^3 + \ldots$$ (2) where _b__i_ is the molar fraction of _i_-th element
and \(\mathop {\sum}\nolimits_i {b_iH_i^{SER}}\) represents the sum of the enthalpies of the elements in their standard element reference (SER), i.e., the stable state at 298.15 K and 1 bar.
The reference term is needed because there is no absolute value of the enthalpy of a system. The coefficients in Eq. (2) represent the temperature dependence of free energy and are usually
obtained by fitting Eq. (2) to the thermal properties of _θ_ phase from experiments or first-principles calculations. To deal with the solution nature of non-stoichiometric phase _θ_, the
molar Gibbs energy is represented by CEF (or sublattice model)18,45, $$G_m^\theta = \mathop {\sum }\limits_{I_0} P_{I_0}\left( Y \right)G_{I_0}^0 + RT\mathop {\sum }\limits_{s = 1}^n
a_s\mathop {\sum }\limits_{i = 1}^{n_s} y_i^s{\mathrm{ln}}\left( {y_i^s} \right) + \mathop {\sum }\limits_{k \ge 1} \mathop {\sum }\limits_{I_k} P_{I_k}\left( Y \right)L_{I_k} + \ldots$$ (3)
where _I_0 is a constituent array of zeroth-order (i.e., one constituent on each sublattice) specifying one constituent in each sublattice and \(P_{I_0}\left( Y \right)\) is the
corresponding product of the constituent fractions specified by _I_0. \(G_{I_0}^0\) is the compound energy parameter representing the Gibbs energy of formation of the compound _I_0 with SER
as reference states. The factor _a__s_ is the number of sites on sublattice _s_ and \(y_i^s\) denotes the site-fraction of component _i_ on sublattice _s_. \(P_{I_k}\left( Y \right)\) is the
_k_-th order product of the constituent fractions specified by _I__k_ and \(L_{I_k}\) is the corresponding temperature-dependent interaction energies. The three terms on the right-hand-side
of Eq. (3) represent the contributions from the unreacted mixture, ideal mixing entropy, and non-ideal interactions, respectively. The Thermo-Calc software is adopted to analyze the
electrochemical reactions and construct the _E_-pH diagram for heterogeneous interaction system between 10−2 mol of FCC single-phase Cr22 MPEA and 1 kg of water containing 0.6 m NaCl at 25
°C and 1 atm ambient pressure. The thermodynamics of Cr22 MPEA, aqueous solution (and activity of ions), stoichiometric compounds, and oxide solid solutions are described by the TCHEA3,
TCAQ3, SSUB6, and TCOX8 databases59, respectively. The gas phase for _E_-pH predominance outside the region for stable water is suppressed in all calculations to reveal the stability regions
for the predominant reaction products at low and high potentials. The gaseous species dissolved in aqueous solution is excluded with the exception for Supplementary Fig. 2 to study the case
where the aqueous solution is supersaturated with H2 and O2 molecules. The Gibbs energy minimization is performed using POLY-3 module with the maximum number of iterations as 20,000,
required accuracy for convergence as 10−6, smallest possible fraction as 10−20. Additional numerical tests are performed to check whether the equilibrium results are the global minimums, not
local ones, in Gibbs energy surface. Despite some small differences, the diagrams with and without checking for global minimums agree with each other, hence the global minimum check is
disabled to save computing time. In the analysis with oxide solution phases modeled by Eq. (3), a large number of additional DOFs are needed to account for the site fractions of cations on
sublattices, which leads to challenges to achieve numerical convergence at certain conditions. To avoid this issue and manually map the _E_-pH diagram, the equilibrium states under many set
of conditions on the grids of pH and potential axis are computed with the intervals of pH and potential as 0.125 and 0.025 V, which corresponds to a total of 13673 data points on the _E_-pH
diagram. The equilibrium results under these conditions are analyzed and the non-convergent data points are excluded in the analysis. The remaining data are used to map the _E_-pH diagram,
concentrations of ions in aqueous solution, and molar fractions of alloy elements in oxide solution phases. AESEC EXPERIMENT The Cr22 MPEA was produced and characterized indicating a
single-phase FCC structure37 (also see the phase diagram in Supplementary Fig. 1). The sample was degreased with ethanol in an ultrasonic bath for 10 min, rinsed with deionized (DI) water
(18.2 MΩ cm) then dried with flowing Ar. The sample surface was ground with the Si-C paper (P4000) under DI water then again dried with flowing Ar. 0.1 M NaCl electrolyte was prepared with
DI water. The final pH was adjusted to 4.0 by adding 1.0 M HCl solution. Prior to the experiment, the electrolyte was deaerated by flowing Ar for 30 min and maintained during experiments.
The total quantity of dissolved alloy components is obtained by AESEC technique49,50,51,52. This technique measures simultaneously all the dissolved species in the electrolyte by coupling an
Ultima 2C Horiba Jobin-Yvon inductively coupled plasma atomic emission spectrometer (ICP-AES) with a specially designed flow cell. The principle and quantification method are described in
detail elsewhere49. The specimen of interest is in contact with the electrolyte in the electrochemical flow cell where a reference electrode and a counter electrode (Pt foil) are located in
a separated compartment with a porous membrane. An SCE (−241 mV vs. SHE) was used as a reference electrode and then converted to SHE for comparison with the predicted thermodynamic data. A
Gamry Reference 600TM potentiostat was utilized to control the potential during the experiment. A constant potential was applied when the flowing electrolyte was brought to the sample. Prior
to each potentiostatic experiment, a cathodic potential at −1.06 V vs. SHE was applied for 600 s to reduce the pre-existing oxide. The total amount of each alloy component in the
electrolyte was calculated by integrating the dissolution rate vs. time curve. DATA AVAILABILITY The authors declare that the data supporting the findings of this study are available within
the paper and its Supplementary Information files. The simulation output files are available upon reasonable request. They are not publicly available due to the very large file sizes.
Parameters of the input files are described in the computational methods. CODE AVAILABILITY The Thermo-Calc Software is proprietary software available for purchase at
https://www.thermocalc.com/. The input files for Thermo-Calc console mode and the Python scripts used to process output files of Thermo-Calc are available in Data set 1. REFERENCES * Taylor,
C. D., Lu, P., Saal, J., Frankel, G. S. & Scully, J. R. Integrated computational materials engineering of corrosion resistant alloys. _NPJ Mater. Degrad._ 2, 1 (2018). Article Google
Scholar * Hou, B. et al. The cost of corrosion in China. _NPJ Mater. Degrad._ 1, 1 (2017). Article Google Scholar * Pourbaix, M. _ATLAS of Electrochemical Equilibria in Aqueous Solutions_
(Pergamon Press, Oxford, 1966). * Pourbaix, M. _Lectures on Electrochemical Corrosion_ (Springer Science & Business Media, 1973). * Verink, E. D. In _Uhlig’s Corrosion Handbook_ 3rd
edn. (ed Winston Revie, R.) (The Electrochemical Society and Jon Wiley & Sons, New Jersey, 2011). * Thompson W. T., Kaye, M. H., Bale, C. W. & Pelton, A. D. In _Uhlig’s Corrosion
Handbook_ 3rd edn. (ed Winston Revie, R.) (The Electrochemical Society and John Wiley & Sons, New Jersey, 2011). * Cubicciotti, D. Potential-pH diagrams for alloy-water systems under LWR
conditions. _J. Nucl. Mater._ 201, 176 (1993). Article CAS Google Scholar * Cubicciotti, D. Flow-assisted corrosion of steel and the influence of Cr and Cu additions. _J. Nucl. Mater._
152, 259 (1988). Article Google Scholar * Cubicciotti, D. Pourbaix diagrams for mixed metal oxides - chemistry of copper in BWR water. _Corrosion_ 44, 875 (1988). Article CAS Google
Scholar * Cubicciotti, D. Equilibrium chemistry of nitrogen and potential-pH diagrams for the Fe-Cr-H2O system in BWR water. _J. Nucl. Mater._ 167, 241 (1989). Article Google Scholar *
Criss, C. M. & Cobble, J. W. The thermodynamic properties of high temperature aqueous solutions. IV. Entropies of the ions up to 200 and the correspondence principle. _J. Am. Chem. Soc._
86, 5385 (1964). Article CAS Google Scholar * Beverskog, B. & Puigdomenech, I. Pourbaix diagrams for the ternary system of iron-chromium-nickel. _Corrosion_ 55, 1077 (1999). Article
CAS Google Scholar * Helgeson, H. C., Kirkham, D. H. & Flowers, G. C. Theoretical prediction of the thermodynamic behavior of aqueous electrolytes by high pressures and temperatures;
IV, Calculation of activity coefficients, osmotic coefficients, and apparent molal and standard and relative partial molal properties to 600 °C and 5 KB. _Am. J. Sci._ 281, 1249 (1981).
Article CAS Google Scholar * Tanger, J. C. & Helgeson, H. C. Calculation of the thermodynamic and transport properties of aqueous species at high pressures and temperatures: revised
equations of state for the standard partial molal properties of ions and electrolytes. _Am. J. Sci._ 288, 19 (1988). Article CAS Google Scholar * Persson, K. A., Waldwick, B., Lazic, P.
& Ceder, G. Prediction of solid-aqueous equilibria: Scheme to combine first-principles calculations of solids with experimental aqueous states. _Phys. Rev. B_ 85, 235438 (2012). Article
CAS Google Scholar * Huang, L. F., Scully, J. R. & Rondinelli, J. M. Modeling corrosion with first-principles electrochemical phase diagrams. _Annu. Rev. Mater. Res._ 49, 53 (2018).
Article CAS Google Scholar * Yang, K. S., Oses, C. & Curtarolo, S. Modeling off-stoichiometry materials with a high-throughput ab-initio approach. _Chem. Mater._ 28, 6484 (2016).
Article CAS Google Scholar * Lukas, H. L., Fries, S. G. & Sundman, B. _Computational thermodynamics: the CALPHAD method_ (Cambridge University Press, Cambridge, 2007). * Campbell, C.
E., Kattner, U. R. & Liu, Z. K. The development of phase-based property data using the CALPHAD method and infrastructure needs. _Integr. Mater. Manuf. Innov._ 3, 12 (2014). Article
Google Scholar * Andersson, J. O., Helander, T., Höglund, L., Shi, P. & Sundman, B. Thermo-Calc and DICTRA, computational tools for materials science. _CALPHAD_ 26, 273 (2002). Article
CAS Google Scholar * Shi, P. F., Engström, A., Höglund, L., Sundman, B. & Ågren, J. Thermo-Calc and DICTRA enhance materials design and processing. _Mater. Sci. Forum_ 475-479, 3339
(2005). Article CAS Google Scholar * Shi, P. F. et al. Computational thermodynamics and kinetics in materials modelling and simulations. _J. Iron Steel Res. Int._ 14, 210 (2007). Article
Google Scholar * Shi, P. F., Engström, A. & Sundman, B. Thermodynamic investigations on materials corrosion in some industrial and environmental processes. _Int. J. Environ. Sci._ 23,
1 (2011). Google Scholar * Shi, P. F., Engström, A., Sundman, B. & Ågren, J. Thermodynamic calculations and kinetic simulations of some advanced materials. _Mater. Sci. Forum_ 675, 961
(2001). Google Scholar * Kaufman, L. et al. Transformation, stability and Pourbaix diagrams of high performance corrosion resistant (HPCRM) alloys. _CALPHAD_ 33, 89 (2009). Article CAS
Google Scholar * Kaufman, L. Computational materials design. _J. Phase Equilibria Diffus._ 30, 418 (2009). Article CAS Google Scholar * Kaufman, L. _Calculation of Pourbaix Diagrams for
C22 in Various Well Water Chemistries, No. UCRL-JC-150606_ (Lawrence Livermore National Lab, 2002). * Zhang, B., Zhang, Y. & Guo, S. M. A thermodynamic study of corrosion behaviors for
CoCrFeNi-based high-entropy alloys. _J. Mater. Sci._ 53, 14729 (2018). Article CAS Google Scholar * Lu, P. et al. Computational materials design of a corrosion resistant high entropy
alloy for harsh environments. _Scr. Mater._ 153, 19 (2018). Article CAS Google Scholar * Sun, M., Wu, X., Han, E. H. & Rao, J. Microstructural characteristics of oxide scales grown on
stainless steel exposed to supercritical water. _Scr. Mater._ 61, 996 (2009). Article CAS Google Scholar * Kuang, W., Han, E. H., Wu, X. & Rao, J. Microstructural characteristics of
the oxide scale formed on 304 stainless steel in oxygenated high temperature water. _Corros. Sci._ 52, 3654 (2010). Article CAS Google Scholar * Huang, J., Wu, X. & Han, E. H.
Electrochemical properties and growth mechanism of passive films on Alloy 690 in high-temperature alkaline environments. _Corros. Sci._ 52, 3444 (2010). Article CAS Google Scholar *
Huang, J., Liu, X., Han, E. H. & Wu, X. Influence of Zn on oxide films on Alloy 690 in borated and lithiated high temperature water. _Corros. Sci._ 53, 3254 (2011). Article CAS Google
Scholar * Yu, X. X. et al. Nonequilibrium solute capture in passivating oxide films. _Phys. Rev. Lett._ 121, 145701 (2011). Article Google Scholar * Senkov, O. N., Miracle, D. B., Chaput,
K. J. & Couzinie, J. P. Development and exploration of refractory high entropy alloys: a review. _J. Mater. Res._ 33, 3092 (2018). Article CAS Google Scholar * Quiambao, K. F. et al.
Passivation of a corrosion resistant high entropy alloy in non-oxidizing sulfate solutions. _Acta Mater._ 164, 362 (2019). Article CAS Google Scholar * Gerard, A. Y. et al. Aqueous
passivation of high entropy alloy Ni38Fe20Cr22Mn10Co10: Unexpected high Cr enrichment within the passive film. _Acta Mater._ https://doi.org/10.1016/j.actamat.2020.07.024 (2020) * Huang, L.
F., Hutchison, M. J., Santucci, R. J. Jr., Scully, J. R. & Rondinelli, J. M. Improved electrochemical phase diagrams from theory and experiment: the Ni-water system and its complex
compounds. _J. Phys. Chem. C_ 121, 9782 (2017). Article CAS Google Scholar * Lillard, R. S. & Scully, J. R. Electrochemical passivation of ordered NiAl. _J. Electrochem. Soc._ 145,
2024 (1998). Article CAS Google Scholar * Zuili, D., Maurice, V. & Marcus, P. Surface structure of nickel in acid solution studied by in situ scanning tunneling microscopy. _J.
Electrochem. Soc._ 147, 1393 (2000). Article CAS Google Scholar * Abbas, S. A. & Jung, K. D. Preparation of mesoporous microspheres of NiO with high surface area and analysis on their
pseudocapacitive behavior. _Electrochim. Acta_ 193, 145 (2016). Article CAS Google Scholar * Zhong, X., Bali, S. C. & Shoji, T. Effects of dissolved hydrogen and surface condition on
the intergranular stress corrosion cracking initiation and short crack growth behavior of non-sensitized 316 stainless steel in simulated PWR primary water. _Corros. Sci._ 118, 143 (2017).
Article CAS Google Scholar * Zhang, N. Q., Xu, H., Li, B. R., Bai, Y. & Liu, D. Y. Influence of the dissolved oxygen content on corrosion of the ferritic–martensitic steel P92 in
supercritical water. _Corros. Sci._ 56, 123 (2012). Article CAS Google Scholar * Thermo-Calc Software. Materials corrosion applications with thermo-calc software. Stockholm, Sweden.
http://www.thermocalc.com (2013). * Kjellqvist, L., Selleby, M. & Sundman, B. Thermodynamic modelling of the Cr–Fe–Ni–O system. _CALPHAD_ 32, 577 (2008). Article CAS Google Scholar *
Sieradzki, K. et al. The dealloying critical potential. _J. Electrochem. Soc._ 149, B370 (2002). Article CAS Google Scholar * Hayes, J. R., Hodge, A. M., Biener, J., Hamza, A. V. &
Sieradzki, K. Monolithic nanoporous copper by dealloying Mn-Cu. _J. Mater. Res._ 21, 2611 (2006). Article CAS Google Scholar * Huang, L. F., Ha, H. M., Cwalina, K. L., Scully, J. R. &
Rondinelli, J. M. Understanding electrochemical stabilities of Ni-based nanofilms from a comparative theory–experiment approach. _J. Phys. Chem. C_ 123, 28925 (2019). Article CAS Google
Scholar * Ogle, K. Atomic emission spectroelectrochemistry: real-time rate measurements of dissolution. _Corros. Passiv. Corros._ 75, 1398 (2019). Article CAS Google Scholar * Ogle, K.,
Mokaddem, M. & Volovitch, P. Atomic emission spectroelectrochemistry applied to dealloying phenomena II. Selective dissolution of iron and chromium during active-passive cycles of an
austenitic stainless steel. _Electrochim. Acta_ 55, 913–921 (2010). Article CAS Google Scholar * Li, X. & Ogle, K. The passivation of Ni-Cr-Mo alloys: time resolved enrichment and
dissolution of Cr and Mo during passive-active cycles. _J. Electrochem. Soc._ 177, C3179–C3185 (2019). Article CAS Google Scholar * Li, X. et al. Communication—dissolution and passivation
of a Ni-Cr-Fe-Ru-Mo-W high entropy alloy by elementally resolved electrochemistry. _J. Electrochem. Soc._ 167, 061505 (2020). Article CAS Google Scholar * Cwalina, K. L. et al. In
operando analysis of passive film growth on Ni-Cr and Ni-Cr-Mo alloys in chloride solutions. _J. Electrochem. Soc._ 166, C3241 (2019). Article CAS Google Scholar * Reartes, G. B.,
Morando, P. J. & Blesa, M. A. Reactivity of chromium oxide in aqueous solutions. 2. _Acid dissolution. Langmuir._ 11, 2277 (1995). Article CAS Google Scholar * Torbati-Sarraf, H.,
Shabani, M., Jablonski, P. D., Pataky, G. J. & Poursaee, A. The influence of incorporation of Mn on the pitting corrosion performance of CrFeCoNi high entropy alloy at different
temperature. _Mater. Des._ 18, 108170 (2019). Article CAS Google Scholar * Yang, J. et al. Effects of Mn on the electrochemical corrosion and passivation behavior of CoFeNiMnCr
high-entropy alloy system in H2SO4 solution. _J. Alloy. Compd._ 819, 152943 (2020). Article CAS Google Scholar * Yakusheva, E. A., Gorichev, I. G., Atanasyan, T. K. & Lainer, Y. A.
Kinetics of the dissolution of cobalt, nickel, and iron oxide in sulfuric acid. _Metally_ 3, 198 (2012). Google Scholar * Momeni, M., Behazin, M. & Wren, J. C. Mass and charge balance
(MCB) model simulations of current, oxide growth and dissolution during corrosion of Co-Cr alloy stellite-6. _J. Electrochem. Soc._ 163, C94 (2016). Article CAS Google Scholar *
Thermo-Calc Software. Thermodynamic and properties databases. https://www.thermocalc.com/products-services/databases/thermodynamic/ (2020). Download references ACKNOWLEDGEMENTS We are
grateful to Dr. Pin Lu at QuesTek Innovations LLC for the helpful discussions on the role of gaseous species in _E_-pH diagrams. Pin Lu is also acknowledged for the ICME of the Cr22 alloy
under the BES Award #DE-SC0016584. K.W. and B.-C.Z. acknowledge support from the University of Virginia start-up funds. K.W., J.H. A.Y.G., and J.R.S. acknowledge support from the Center for
Performance and Design of Nuclear Waste Forms and Containers, an Energy Frontier Research Center funded by the U.S. Department of Energy, Office of Science, Basic Energy Sciences under Award
#DE-SC0016584. The alloy was provided from OSU, Gerald S. Frankel also supported by BES Award #DE-SC0016584. We acknowledge Advanced Research Computing Services and IT support at the School
of Applied Engineering and Sciences at the University of Virginia for providing computational resources and technical support that have contributed to the results reported within this
paper. AUTHOR INFORMATION AUTHORS AND AFFILIATIONS * Department of Materials Science and Engineering, University of Virginia, Charlottesville, VA, 22904, USA Kang Wang, Junsoo Han, Angela Yu
Gerard, John R. Scully & Bi-Cheng Zhou Authors * Kang Wang View author publications You can also search for this author inPubMed Google Scholar * Junsoo Han View author publications You
can also search for this author inPubMed Google Scholar * Angela Yu Gerard View author publications You can also search for this author inPubMed Google Scholar * John R. Scully View author
publications You can also search for this author inPubMed Google Scholar * Bi-Cheng Zhou View author publications You can also search for this author inPubMed Google Scholar CONTRIBUTIONS
J.R.S. and B.-C.Z. designed the study. K.W. performed the calculations. J.H. and A.Y.G. performed the experiments. All authors analyzed the results and contributed to writing, editing, and
revision of the manuscript. CORRESPONDING AUTHOR Correspondence to Bi-Cheng Zhou. ETHICS DECLARATIONS COMPETING INTERESTS The authors declare no competing interests. ADDITIONAL INFORMATION
PUBLISHER’S NOTE Springer Nature remains neutral with regard to jurisdictional claims in published maps and institutional affiliations. SUPPLEMENTARY INFORMATION SUPPLEMENTARY MATERIALS
DATASET1 RIGHTS AND PERMISSIONS OPEN ACCESS This article is licensed under a Creative Commons Attribution 4.0 International License, which permits use, sharing, adaptation, distribution and
reproduction in any medium or format, as long as you give appropriate credit to the original author(s) and the source, provide a link to the Creative Commons license, and indicate if changes
were made. The images or other third party material in this article are included in the article’s Creative Commons license, unless indicated otherwise in a credit line to the material. If
material is not included in the article’s Creative Commons license and your intended use is not permitted by statutory regulation or exceeds the permitted use, you will need to obtain
permission directly from the copyright holder. To view a copy of this license, visit http://creativecommons.org/licenses/by/4.0/. Reprints and permissions ABOUT THIS ARTICLE CITE THIS
ARTICLE Wang, K., Han, J., Gerard, A.Y. _et al._ Potential-pH diagrams considering complex oxide solution phases for understanding aqueous corrosion of multi-principal element alloys. _npj
Mater Degrad_ 4, 35 (2020). https://doi.org/10.1038/s41529-020-00141-6 Download citation * Received: 31 July 2020 * Accepted: 12 October 2020 * Published: 12 November 2020 * DOI:
https://doi.org/10.1038/s41529-020-00141-6 SHARE THIS ARTICLE Anyone you share the following link with will be able to read this content: Get shareable link Sorry, a shareable link is not
currently available for this article. Copy to clipboard Provided by the Springer Nature SharedIt content-sharing initiative