- Select a language for the TTS:
- UK English Female
- UK English Male
- US English Female
- US English Male
- Australian Female
- Australian Male
- Language selected: (auto detect) - EN
Play all audios:
ABSTRACT A/goose/Guangdong/1/96-like (GsGd) highly pathogenic avian influenza (HPAI) H5 viruses cause severe outbreaks in poultry when introduced. Since emergence in 1996, control measures
in most countries have suppressed local GsGd transmission following introductions, making persistent transmission in domestic birds rare. However, geographical expansion of clade 2.3.4.4
sublineages has raised concern about establishment of endemic circulation, while mechanistic drivers leading to endemicity remain unknown. We reconstructed the evolutionary history of GsGd
sublineage, clade 2.3.4.4c, in Taiwan using a time-heterogeneous rate phylogeographic model. During Taiwan’s initial epidemic wave (January 2015 - August 2016), we inferred that localised
outbreaks had multiple origins from rapid spread between counties/cities nationwide. Subsequently, outbreaks predominantly originated from a single county, Yunlin, where persistent
transmission harbours the trunk viruses of the sublineage. Endemic hotspots determined by phylogeographic reconstruction largely predicted the locations of re-emerging outbreaks in Yunlin.
The transition to endemicity involved a shift to chicken-dominant circulation, following the initial bidirectional spread between chicken and domestic waterfowl. Our results suggest that
following their emergence in Taiwan, source-sink dynamics from a single county have maintained GsGd endemicity up until 2023, pointing to where control efforts should be targeted to
eliminate the disease. SIMILAR CONTENT BEING VIEWED BY OTHERS THE EPISODIC RESURGENCE OF HIGHLY PATHOGENIC AVIAN INFLUENZA H5 VIRUS Article 18 October 2023 TRANSATLANTIC SPREAD OF HIGHLY
PATHOGENIC AVIAN INFLUENZA H5N1 BY WILD BIRDS FROM EUROPE TO NORTH AMERICA IN 2021 Article Open access 11 July 2022 THE GLOBAL H5N1 INFLUENZA PANZOOTIC IN MAMMALS Article 24 September 2024
INTRODUCTION Preventing emerging zoonotic viruses from establishing endemic circulation is essential to public health, considering the great health burden caused by endemic zoonoses
globally1. An example of particular concern is the A/Goose/Guangdong/96-like (GsGd) H5 viruses, a lineage of highly pathogenic avian influenza (HPAI) first identified in southern China. From
2003 to 2006, HPAI GsGd viruses spread globally, infecting poultry in countries across Asia and Europe2. Most countries have subsequently eliminated HPAI GsGd viruses3,4, but since 2010, a
few countries, including Bangladesh, China, India, Indonesia, and Vietnam, have been classified as endemic, due to continued circulation in poultry and sporadic human cases5. Although there
has been extensive characterisation of the genetic origins and the migration routes of HPAI GsGd viruses6,7,8, the mechanisms facilitating persistence and the transition to endemicity remain
unknown. Since emergence, GsGd viruses have undergone diversification by accumulating mutations in their surface protein hemagglutinin (HA), resulting in multiple antigenically distinct
sublineages, termed clades2,3. These genetic changes can alter host preferences, determining the virus’ reservoir, dissemination and persistence9. GsGd viruses of the clade 2.3.4.4,
including clade 2.3.4.4a-2.3.4.4h, are distinguished from previous GsGd viruses by various neuraminidase (NA) subtypes (N2, N5, N6 and N8) besides N1, and have rapidly increased in the
global population since 201410,11. These “H5Nx” viruses have caused poultry and wild animal outbreaks in previously unaffected regions, such as the Americas10,12, and have also demonstrated
unexpected transmission from Europe back to China13. Moreover, the viruses have led to mammal-to-mammal transmission in minks and cows14,15, and at a much larger scale among marine
mammals16. The increasingly sustained circulation in areas previously thought to be sinks raises concerns about expanding the establishment of endemic circulation17. Studying the development
of long-term virus circulation could reveal insights into approaches to eliminate viruses from areas currently affected by GsGd clade 2.3.4.4. The clade 2.3.4.4c virus, one of the H5Nx
sublineages, caused severe outbreaks in Korean poultry farms in early 201410,18. Following migratory bird flyways, the virus spread to Japan, the USA and Taiwan by the end of that
year19,20,21. In 2015, Taiwan experienced a devastating epidemic in domestic birds and culled over 5 million birds to curb localised outbreaks22. This marked the first significant
transmission of HPAI GsGd viruses in the country23,24. While clade 2.3.4.4c viruses were eliminated in other countries before 201711,21, the virus continued to circulate as the H5N2 subtype
in Taiwan until at least 2019 from the original H5N8 subtype21,25. With multiple genotypes generated by reassortment with local low pathogenic avian influenza (LPAI) viruses21,24, Huang et
al. recognised the circulation of the HPAI clade 2.3.4.4c virus in Taiwan as endemic22, and the circulating viruses were all linked to the same introduction event occurring before 201521,22.
How this clade dispersed in Taiwan and the factors underlying its endemic establishment are not understood. In addition, the initial 2015 epidemic wave in Taiwan was characterised by
widespread transmission in domestic waterfowl26. As there is no evidence of HPAI circulating in resident wild birds in Taiwan, the population dynamics of the virus in different poultry
species is unclear. In this study, we quantified the persistence of GsGd outbreaks globally using virus HA genes and identified the source of the endemic clade that was established in Taiwan
within this global context. We then curated the HA genes of the clade 2.3.4.4c virus in Taiwan, isolated from January 2015 to March 2019, representing ~20% of reported outbreaks in poultry
that occurred within the country. Using this data set, we performed time-heterogeneous phylogeographic analyses to reconstruct the geographical and ecological dispersal dynamics of the clade
as it transitioned from emergence to endemicity. Specifically, we elucidate the factors facilitating viral spread among counties/cities in Taiwan following the first epidemic wave in 2015.
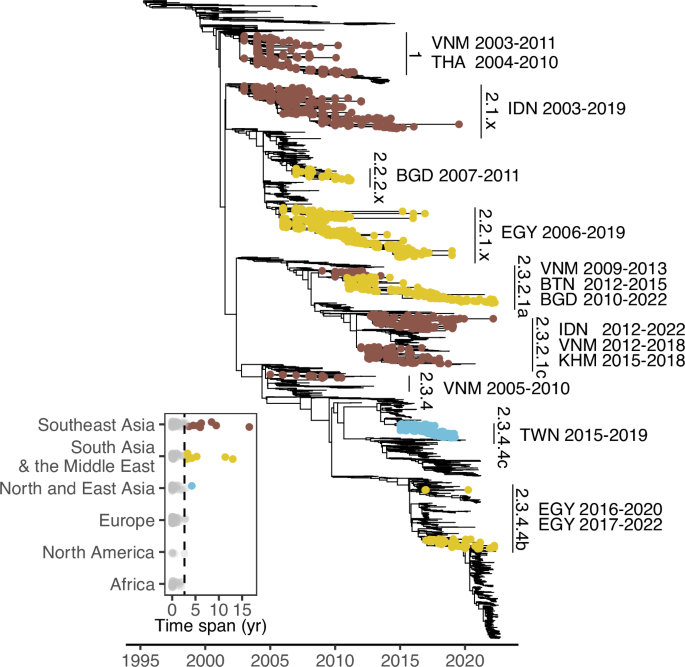
Lastly, we investigated the viral spread between different host groups. RESULTS GLOBAL PERSISTENCE OF GSGD To better understand local epidemics following GsGd introductions on a global
scale, we identified descendent sublineages caused by introductory events (see the “Methods” section). We found about 400 sublineages by reconstructing dispersal history from a uniformly
downsampled dataset using the H5 genes of GsGd viruses up to September 2022 (Fig. 1). These GsGd sublineages circulated across 78 countries, but their circulation was generally short-lived,
with an average duration of 0.6 years based on the date of sample collection. Closer examination of sublineages that persisted for more than three years (based on a 95% quantile of 2.64),
revealed 15 persistent sublineages in Southeast Asia, South Asia and the Middle East, including the clade 2.3.4.4c virus in Taiwan (Fig. 1). Geographical reconstruction informed by outbreak
reports supported this finding that most introductions had limited onward transmission (on average, 0.61 years) and identified the same countries with prolonged viral circulation. THE
EMERGENCE AND SPREAD OF CLADE 2.3.4.4C IN TAIWAN In January 2015, over 600 outbreaks of clade 2.3.4.4c were reported in Taiwan across 10 counties/cities (Fig. 2A). Subsequently, reported
HPAI outbreaks in Taiwan declined and became sporadic in previously affected areas, with only three cases reported during July–August 2016, before transmission resumed in winter 2016–2017
(Fig. 2B). To understand the spread of the clade 2.3.4.4c virus in Taiwan, we curated a genetic data set of viral HA sequences (_n_ = 252), including subtypes of H5N2 (73%), H5N3 (2%) and
H5N8 (25%). The sequences are distributed over time from January 2015 to March 2019, and their sample sizes per county/city correlate well with the number of reported outbreaks (Fig. 2D). To
understand the dispersal dynamics of the 2.3.4.4c clade in Taiwan, we reconstructed the viral spread using continuous phylogeographical approaches, which inferred the spatial locations of
nodes. The Bayesian MCMC sampling process used priors informed by surveillance data to specify the locations of viruses accommodating uncertainty (see the “Methods” section). The results,
stratified by year, indicate that in 2015 there was intensive virus dispersal within and between western counties/cities (CH, YL, CY, and TN), as well as more limited dispersal in southern
counties/cities (KH and PT) (Fig. 3). Long-distance dispersal events mostly originated from the main cluster in the west, and the northward dispersal events did not appear to seed sustained
outbreaks. Since 2016, the number of dispersal events has significantly decreased, and since 2017, Yunlin County (YL) has become the primary source of both short- and long-distance spread
(Fig. 3). The pattern is further illustrated by discretizing the inferred locations, with diffusion within YL dominating in all directions (Supplementary Fig 1). Use of explicit
phylogeographic methods can reduce sampling biases27,28. Here, the locations of samples from slaughterhouses or rendering factories introduced inaccuracies into our inference. This is
because these locations were unlikely to be the origins of viral spread, particularly those from the northern cities (e.g. TP and NTP) where agricultural activity is minimal (Supplementary
Fig. 2). To reconstruct the dispersal history of the virus, we therefore used discrete diffusion methods to reassign the locations of slaughterhouse samples. Specifically, we employed priors
informed by the surveillance data, which represented possible sources of animals transported to slaughterhouses or rendering factories by uncertain discrete state assignment (Supplementary
Fig. 3B). Additionally, we used a heterogeneous rate model to identify changes in dispersal patterns between two epidemiological phases defined from the surveillance data (Fig. 2): from
January 2015 to August 2016 (T1) and from September 2016 onwards (T2). The statistically supported routes that we inferred indicate a shift in dispersal from outbreaks having multiple
sources to predominantly originating from a single source (Fig. 4 and Supplementary Fig. 4A) and are generally consistent with inference from the continuous phylogeographic analyses. During
the emergence phase (T1), substantial transition events were detected between two western counties (YL and CH), in addition to dispersal from YL to nearby counties, with less frequent
transitions identified from CH and PT to neighbouring counties/cities. In contrast, during the transition to endemicity (T2), all supported routes originated from YL, except for a less
frequent path from PT. To account for local transmission, we quantified the maximum time interval assembled by branches with the same inferred state (Fig. 4 and Supplementary Fig. 5A). YL
appears to be the only site where viruses persisted for more than 75% of both time periods (T1 and T2), suggesting its potential as a source of virus spread. Furthermore, when considering
the viruses leading to the most recent isolates, CH harboured the “trunk” of the clade in 2015, but since 2016, YL has consistently been the major site harbouring viruses leading to the most
distant progeny (Supplementary Fig 6A). These results suggest that YL has become the most prominent origin for nationwide dispersal following the initial epidemic wave. In contrast,
circulation in other locations, particularly CH, has been largely suppressed, preventing the spread to other counties/cities. To investigate the impact of sampling, we created two subsampled
data sets by downsampling genetic sequences from county YL, resulting in YL no longer being the most frequently sampled site in each dataset. The subsampled data showed a shift in the
origins of viral diffusion to CH or TN during the emergence phase (T1), but the inferred routes during the endemic phase (T2) were almost identical to those obtained using the full dataset
(Supplementary Fig. 4B and C). Similarly, persistence quantified from subsampling shows that CH replaced YL as the location with the most persistent circulation during the initial epidemic
wave (T1). However, the estimates during the endemic phase (T2) were largely unaffected by the targeted subsampling (Supplementary Fig. 5B and C). To understand how the surveillance data may
have biased our inference, we also performed the same phylogeographic approaches based on the original collection county/city, with unknown samples (sample size; T1:10, T2:1) assigned an
uninformative prior containing all collection locations. This inference, which is independent of outbreak records, reveals a more widespread distribution of dispersal origins during the
initial epidemic wave (T1). In addition to PT, more southern locations (i.e. TN and KH) were also identified as dispersal origins (Supplementary Fig. 4D). During the endemic phase (T2), the
pattern is consistent with the results obtained from considering the outbreak records. Notable differences were found in routes involving locations where samples were mainly from
slaughterhouses or rendering factories (i.e. NTP and TP, Supplementary Fig. 4D). Estimates of persistence based on record-independent priors (Supplementary Fig 5D) and all trunk probability
conditions tested (Supplementary Fig. 6B–D) indicate similar results to the full data set. Taken together, these findings suggest that our observation of nationwide geographical spread is
robust to both sampling and state assignment. LOCATION-SPECIFIC FACTORS DRIVE THE RISK OF VIRAL DISPERSAL To identify the risk factors that facilitated the spread of clade 2.3.4.4c in
Taiwan, we implemented a Generalised Linear Model (GLM) model accommodated by the time-heterogeneous discrete phylogeographic method. This allowed for estimates of predictor effect size and
inclusion probability by time period. The results show that sample size is positively and significantly correlated with diffusion during the initial epidemic wave (T1, Fig. 5A, RandEffect-).
The number of poultry farms has a prominent inclusion probability during the endemic phase (T2), but this was not statistically significant. To account for location-specific factors, the
GLM model was adjusted by adding random effects for each site, in addition to the existing predictors. The new model reduced the effects of sample size, and no further predictors were
identified (Fig. 5A, RandEffect+). Interestingly, the result shows that dispersal routes to high-incidence counties/cities (CH, YL, CY and TN), and the direction from YL, have significant
positive effects (Fig. 5B). To avoid overparameterization, we conducted GLM estimations with only one of the predictors that had higher inclusion probabilities and sample size. Consistent
with the full model, the reduced models that include predictors for either poultry farm, road distance, or cropland show no significant effects for these factors (Supplementary Fig. 7).
Furthermore, the random effects that specify directions to YL, CY, or TN are significant in all three reduced models, while the effect of the direction from YL is significant in one reduced
model. The results remained consistent when the full model was examined in a time-homogeneous manner (Supplementary Fig. 8). These findings suggest that location-specific factors are more
likely to explain the spatial spread of the virus in Taiwan than shared agricultural risk factors. MOST YL OUTBREAKS RE-EMERGE FROM ENDEMIC HOTSPOTS The phylogeographic results suggest a
pivotal role of YL county in driving outbreaks across the country. However, the determinants that distinguish YL country from other locations remain unclear. To investigate this, we
evaluated re-emerging HPAI outbreaks in the persistent foci during the endemic phase (T2). Based on the practice of establishing surveillance zones after case identification22,29, hotspots
were defined by overlapping buffer areas within 1 km of node locations inferred by the continuous phylogeographic methods, or within the same distance of the node plus outbreak locations
(Fig. 6A). When mapping new outbreaks in YL from 2019 to 2022, over 50% of these occurred within the phylogenetically-defined hotspots. Moreover, over 70% of the outbreaks were found in the
hotspots defined by the phylogenies supplemented with contemporary outbreak sites (Fig. 6B). The areas defined by both methods account for <20% of the area of YL (Supplementary Fig. 9).
When the buffer radius was set to 0.5 km, over 30% and 60% of the new outbreaks were still identified within the hotspots defined by the two methods, accounting for less than 10% of the
county’s area (Supplementary Fig. 9). When the approach is applied to four other high-incidence areas in Taiwan (Fig. 2B), YL shows significantly higher percentages of recurrence in the
hotspots defined by the two buffer distances (Fig. 6C). These findings suggest that the inability to interrupt transmission within the county has led to the development of an endemic focus
of persistent viral circulation in YL. Note that the re-emerging outbreaks here may include HPAI of different H5 lineages, such as clade 2.3.4.4c reassortants, without available genomic data
for further investigation. DEVELOPMENT OF CHICKEN-DOMINANT CIRCULATION The initial 2015 widespread transmission in domestic waterfowl corresponded to a higher proportion of outbreaks and
viral samples attributed to ducks or geese compared to chickens in 2015 (Fig. 7B and Supplementary Fig. 3A). To assess transmission between poultry species, we applied similar
phylogeographic methods to the same genetic data, classified into Anseriformes (duck and goose) or Galliformes (chicken, turkey and quail) species. The inferred diffusion indicates that
transmission between the two host groups was bidirectional during the initial epidemic wave (T1), with 80% of transmission attributed to spread from waterfowl, while both routes were
statistically supported (Fig. 7A). During the endemic phase (T2), the transmission shifted to gallinaceous birds, while the transmission route from waterfowl was not supported (Fig. 7A).
This finding was further confirmed by an NA data set containing cognate N2 genes of Taiwan clade 2.3.4.4c viruses (Supplementary Fig. 10). The trunk analyses show that the terrestrial
poultry has maintained the gene source of the lineage since its introduction (Fig. 7C). These results suggest that terrestrial poultry, mainly chickens, served as reservoir for the clade
2.3.4.4c virus during the endemic phase (T2), following the first epidemic wave during which inter-host group transmission dominated and more likely originated from domestic waterfowl. By
detecting signals of positive selection, we assessed the evidence for host adaptation. The dN/dS (w) estimate of HA (H5) genes in Taiwan clade 2.3.4.4c viruses is similar to that of HA genes
in a North American H5N2 lineage introduced to the Taiwanese chicken population as early as 200321,30, while the estimate of NA (N2) genes in the clade 2.3.4.4c viruses is higher than that
of the North American lineage (Supplementary Table 1). In addition, there are less than five positively selected sites detected in both HA and NA of clade 2.3.4.4c in Taiwan, which is
comparable to the results found in the North American H5N2 lineage. Note that all of the substitutions occurring at these sites were not fixed in the samples collected in 2019 (Supplementary
Table 1). North American H5N2 has been strictly isolated in terrestrial poultry before 200021,30, illustrating long-term circulation in Galliformes hosts. These results thus do not support
selection pressure from host adaptation during the transition to endemicity and establishment of chicken-dominant circulation. DISCUSSION The circulation of clade 2.3.4.4c in Taiwan presents
an opportunity to study how the GsGd lineage established endemic transmission following its emergence. By comprehensively characterising the dynamics of clade 2.3.4.4c in Taiwan, this study
focuses on viral dispersal and mechanisms driving endemic transmission after the initial epidemic wave. While the introduction and the genetic origins of the virus have been reported
previously21,24, the dispersal dynamics and mechanisms driving persistence were previously unknown. Our time-heterogeneous phylogeographic analyses show that nearly all viral diffusion after
mid-2016 originated from a single county, in contrast to the interconnected and multi-origin diffusion between counties/cities during emergence in 2015 (Figs. 3 and 4). These endemic
hotspots in Taiwan, where the disease was persistent, continued to seed outbreaks in other agricultural areas, while new outbreaks were mostly under control. Therefore, our geographical
reconstruction provides insights into strategic control measures to eliminate GsGd viruses in Taiwan, emphasising the need to focus on the endemic hotspots. Note that the clade 2.3.4.4c
virus was still being identified in 202325, although viral genetic data isolated after 2019 was unavailable. Release of new clade 2.3.4.4c sequences would allow further investigation.
Previous studies using phylogenetic GLMs have identified the poultry trade31, geographic distance32 and the wild bird migration network13 as predictors of GsGd viral dispersal. These studies
have investigated transmission patterns globally as well as single epidemic waves, but have not examined the risk of establishment of endemic transmission. Our GLMs did not identify any
significant agricultural predictors for GsGd viruses in Taiwan. Instead, our analyses highlighted location-specific factors that were not explained by the tested predictors. These results
indirectly support the nationwide spread from a specific endemic county, with other risk factors playing only a minor role. The ongoing HPAI outbreaks occurring during 2023-2024 in Taiwan
were mostly from Yunlin (dashboard in ref. 25, accessed 10 September 2024), supporting the proposed transmission pattern. It is possible that overparameterization due to sample size could
not be excluded, although different models were extensively explored (Supplementary Figs. 7 and 8). Of all the predictors tested in the GLMs, the number of poultry farms had the highest
inclusion probability (Fig. 5 and Supplementary Figs. 7 and 8), a finding corroborated by a spatial case-control study focusing on clustering of H5 viruses in Taiwan from 2015 to 201729.
Lineage-specific host preferences can be targeted to prevent viral spread33. Control measures for HPAI have targeted domestic waterfowl due to their biological similarity to wild waterfowl,
which are capable of long-distance dissemination8,34. In addition, infected waterfowl exhibit mild clinical manifestations compared with Galliformes species like chickens, increasing the
risk of silent transmission and co-infection with multiple strains2. Our diffusion analyses indicate that GsGd transmission in Taiwan shifted from bidirectionality, with mixing between
domestic waterfowl (Anseriformes species) and terrestrial species (Galliformes species), to a predominantly chicken-origin circulation (Fig. 7). The greater transitions from waterfowl to
terrestrial species during the first epidemic wave, aligned with devastating outbreaks in geese22,26, that did not lead to sustained descendant lineages (Fig. 7C). Based on the selection
analyses of the surface proteins, it is unlikely that the change in dispersal patterns between these epidemiological phases reflects virus adaptation from waterfowl to terrestrial birds
(Supplementary Table 1). In addition, there were no notable molecular signatures of adaptation detected in the GsGd viruses in Taiwan, compared with the North American H5N2 viruses in
Taiwan, where N2 genes have 20 amino acid deletions indicating adaptation to terrestrial poultry30. Instead, assuming sampling strategies did not change dramatically during 2015-2019, the
results suggest that unknown factors in the chicken farming networks supported endemic circulation of GsGd in Taiwan, while viral lineages circulating in goose and duck populations were
mostly eliminated. During the transition to endemicity, more than half of the Anseriformes samples were either isolated or inferred to be from Yunlin county (Supplementary Fig. 3),
indicating that the diffusion pattern in host ecology was not confounded by the spatial pattern described earlier. Although these data have provided invaluable information on H5 HPAI
circulation in Taiwan, it is unlikely that the surveillance data from the Taiwanese agricultural authorities identified all of the GsGd or clade 2.3.4.4c outbreaks. This limitation is
implied by the results of the discrete diffusion analysis that relied solely on genetic sequences without outbreak records (Supplementary Fig. 4D). The analysis exclusively identified
statistically supported transmission routes originating from locations in southern Taiwan, particularly city KH, during the first epidemic phase. It was also noted that some viral samples do
not precisely correspond to inferred locations (Fig. 2B and see the “Methods” section). Our reconstruction schemes demonstrate that state assignment strategies have little effect on all
tested characteristics during the endemic phase, T2 (Supplementary Figs. 4–6). There may also be an issue with the lack of explicit viral classification for each entry in the surveillance
data, leading to inaccurate priors for the locations of the 2.3.4.4c virus. However, there is no evidence of the continued circulation of other GsGd lineages, including clade 2.3.4.4b, in
Taiwan during 2015–2019, according to available sequences (see the “Methods” section) and outbreak reporting25. Most of the historical reconstruction in this study was inferred with HA;
however, the effect of NA and other internal genes on virus transmissibility and host adaptation was unclear. The lack of samples from resident wild birds also limits our understanding of
the potential role these birds play in the nationwide spread of the virus. Our findings indicate that in Taiwan, HPAI control should prioritise the source region, specifically by
strengthening measures to interrupt transmission and improve biosecurity in poultry farms in Yunlin county. Meanwhile, epidemics in other regions could be readily suppressed. On a global
scale, attention should be paid to countries newly affected by GsGd viruses after 202012,17, as well as countries where viruses were previously seeded (Fig. 1). Effective interventions can
be implemented through continued local and global surveillance efforts to discern dispersal patterns supported by genomic data. METHODS SEQUENCE DATA PREPARATION H5 hemagglutinin (HA)
sequences of avian influenza A viruses were downloaded from NCBI (Influenza Virus Resource, https://www.ncbi.nlm.nih.gov/genomes/FLU/)35 and GISAID (EpiFlu, https://www.gisaid.org)36 on 17
October, 2022. N2 neuraminidase (NA) sequences of part of the associated H5 viruses in Taiwan were also downloaded from the same databases. The sequences in Taiwan were obtained through
various sampling sources, primarily from cloacal/oropharyngeal swabs and tissues/droppings of suspected sick poultry in the farms21,22,24, while some were taken from dead poultry in farms or
rendering plants22,26. Short sequences (<1500 for HA and <1200 for NA) or sequences containing notable (_n_ = 100) ambiguous nucleotides were removed from the download. Filtered
genetic data were then aligned using Nextalign v2.3.037 or MAFFT v7.49038 and trimmed to coding regions. Multiple basic amino acids at the H5 cleavage site were also removed. Sequences of
Taiwan GsGd clade 2.3.4.4c viruses analysed in this study have all been described previously21,22,24,26,39,40. QUANTIFYING THE PERSISTENCE OF GSGD LINEAGES GLOBALLY The above GsGd H5
sequences (_n_ = 15,576) were first subjected to location-focused downsampling. That is, for each country where genetic data were isolated, five sequences were randomly sampled on different
dates within a monthly interval. When countries had samples with incomplete temporal information, up to 50 sequences were allowed to be randomly included per year. The downsampled data set
(_n_ = 5817) was then used to reconstruct a time-scaled tree using Treetime v0.11.141 and a maximum likelihood (ML) tree inferred by IQ-TREE v2.2.042, justified by a strong temporal signal
(_R_2 = 0.95). The _mugration_ function in Treetime was performed to infer the country as ancestral states for each node. Post-introduction sublineages were defined by first identifying
internal branches representing state transition and all the descending taxa of those branches. For each of these sublineages, nested transition branches were removed, resulting in a lineage
each comprising taxa isolated in the same country and sharing a most common ancestor linked to viral movement. Duration of lineage persistence was defined by the maximum time interval of
collection dates among the virus isolates assigned in a lineage. Considering the variation in sequencing effort across countries, an ancestral reconstruction based on transition rates
informed by frequencies of HPAI H5 outbreaks during 2000–202243 was also performed using the _weights_ function in Treetime. PHYLOGENETIC ANALYSES AND DATA SET DESIGN A ML tree was inferred
for the HA alignment using IQ-TREE. Major H5 viral lineages, including clades 2.3.4.4b and c, were classified according to the GsGd H5N1 nomenclature proposed by the World Health
Organization3,11. All available H5 viruses isolated in Taiwan were identified on the tree. A total of 292 HA sequences isolated in Taiwan were classified as clade 2.3.4.4c, accounting for
nearly all the available GsGd isolates in the country (292/295). The main working dataset was generated by removing duplicated sequences and viruses isolated in apparently the same outbreak
(_n_ = 252). H5N2 accounts for 62%, 59%, 75%, 100%, and 100% of the dataset from 2015 to 2019, whereas H5N8 accounts for 33%, 41%, 25%, 0%, and 0%. To verify results in the discrete
phylogeographic analyses, more evenly distributed datasets were prepared by downsampling the sequences from Yunlin county (YL). The downsampled datasets, which include no more than six
samples per year in YL, contain comparable sample sizes as the other locations where the disease was prevalent (sample size in county YL, 26; CH, 27; CY, 24; PT, 26). In addition, to verify
patterns in host diffusion, the N2 genes corresponding to the curated H5 datasets were collected (_n_ = 183); N2 is the predominant subtype among clade 2.3.4.4c viruses in Taiwan
(Supplementary Fig 3). Temporal signal in each data set was examined by TempEst v1.5.344, taking an ML tree inferred by IQ-TREE and times of sample collection as input. All phylogenetic
trees in this study were visualised with the ggtree package45. EPIDEMIOLOGICAL AND SPATIAL INFORMATION OF HPAI H5 VIRUSES IN TAIWAN The Taiwanese government has been actively conducting
virological surveillance of HPAI H5 viruses in poultry farms and abandoned dead poultry prior to 201526,40. Information on the collection date, host species and subtypes of each
identification report with different sampling sources, including active surveillance or notification by owners/the public, can be found on a publicly available website25. The sampling sites’
geographical coordinates for the reported events were obtained by parsing an interactive map embedded on the same website using the RSelenium package46. Metadata for the genetic data,
including subtype, time, location at the county/city level and host, were acquired along with the sequences. Information on the sampling environment types, i.e., farms or slaughterhouses,
was obtained from a recent publication by the Taiwanese government22. CONTINUOUS PHYLOGEOGRAPHIC ANALYSES We adopted a recently developed method to account for uncertainty in the sampling
location for evolutionary reconstructions in continuous space47,48. Specifically, for each sequence, a prior describing multiple polygons and their corresponding probabilities were defined
in a Keyhole Markup Language (KML) file and thereby incorporated into the Bayesian Markov chain Monte Carlo (MCMC) process performed by BEAST49. To construct the priors in this study,
candidate locations for each genetic sequence were defined based on the sampling sites of the surveillance data. The candidate locations were gathered by matching the sequence’s metadata,
i.e. host, subtype, and county/city, to the reported events, along with a dynamic time-interval starting with (1) the collection date; if no hit was found with compatible information and in
the time-interval, (2) the collection date ±7 was used. After conducting two searches, the centroids of all subdivisions in the county/city (i.e. town or area) of the sample were assigned to
each unmatched sequence. The probabilities of a prior were uniform for sequences that were compatible with events in the surveillance data. However, for sequences that we were unable to
link to reported events, the probabilities were assigned proportionally to the incidence of H5 HPAI during 2015–2019 in subdivisions. Each site with geographical coordinates was expanded to
a minimum area of latitude ±0.0003 and longitude ±0.0005 to fit the polygon format in the original approach47. A sample collected in a slaughterhouse or rendering factory was assigned to the
location of one arbitrarily selected slaughterhouse for each county/city based on the registry data (www.baphiq.gov.tw, accessed 22 March 2023). Continuous phylogeographic analyses were
performed with the Cauchy relaxed random walk (RRW) model implemented in BEAST v1.10.427,50. A general time reversible (GTR) substitution model, a gamma-distributed rate, and an uncorrelated
lognormal relaxed molecular clock51 were employed in the Bayesian analyses, along with the Skygrid demographic model52. The MCMC was run for 550 million steps, with samples taken every
10,000 steps after removing 50 million steps as burn-in. Parallel runs were conducted to confirm the observed pattern. A starting tree generated from a simple BEAST calibration (identical
clock parameters without traits) was added to each run to facilitate the sampling of tree topologies. The results of continuous phylogeographic analyses were visualised with the SERAPHIM
package53. DISCRETE PHYLOGEOGRAPHIC ANALYSES WITH AN EPOCH MODEL To evaluate differences in spatial dispersal patterns throughout different epidemiological phases, from the introduction to
the development of endemicity, we employed a time-heterogeneous transition rate model with the discrete phylogeographic method54. The method enables the Bayesian discrete state inference to
accommodate multiple rate matrices, each of which is specified by one time interval (epoch). Therefore, transition frequencies and statistically supported directions in different intervals
can be simultaneously estimated on the same phylogeny. We defined two time intervals, T1 and T2, divided by the date 1 September, 2016, based on sample sizes of the sequence data and the
epidemiological trajectory (Fig. 2). Transition parameters were estimated using an asymmetric substitution model with Bayesian stochastic search variable selection (BSSVS)55. To better
approximate the locations of the original farms, uncertain discrete state assignment was applied to the samples collected in slaughterhouses or rendering factories56. Similar to the strategy
we used for the analyses in continuous space, we informed the priors of the uncertain discrete locations with surveillance data. We gathered candidate locations at the county/city level by
matching the sequence’s metadata to the reports within a 15-day interval (collection date ±7). If no matched events were found, we extended the interval to 90 days. The probabilities linked
to the locations were proportional to the corresponding events in different counties and cities. The dispersal between hosts was also assessed by classifying sequences into the order of
Anseriformes or Galliformes. Additionally, we used a generalised linear model (GLM) incorporated into the discrete phylogenetic framework to investigate the potential predictors’
contribution to the transition between locations57. The predictors included (1) road distance, (2) shared border, (3) number of poultry farms, (4) poultry population, (5) poultry
heterogeneity, (6) area of cropland and (7) number of viral sequences. Poultry heterogeneity was calculated as Simpson’s Index of Diversity58. Specifically, the value was calculated as
1−Σ(_p__i_)2, _p__i_ = proportion of the species (i.e. chicken, duck, goose or turkey) in the total poultry population. We combined the populations of chicken and duck as a single predictor
because the two are highly correlated. Poultry farm, poultry heterogeneity and cropland area were added to the model as covariates for both origin and destination. Poultry farm, poultry
population, poultry heterogeneity and sample size were treated as time-heterogeneous by averaging the annual values in the two intervals (2015–2016 and 2016–2019) (Supplementary Fig 2),
while all predictors were log-transformed and standardised before inclusion in the matrices. The GLM model was adapted using previously described methods to assume temporally heterogeneous
effect sizes and inclusion probabilities13,59. To account for unexplained variability, models that included time-homogeneous random effect variables specifying the effects as both origin and
destination of each location were also implemented60,61. To validate the results, we performed reduced GLM models with no more than two predictors and a time-homogeneous GLM model including
all the aforementioned predictors. BEAST v1.10.5 (pre-released v0.1.2) was used to implement time-heterogeneous rate models with MCMC chains of 110 million steps49. Performance of the GLM
estimations was improved by applying a set of empirical trees (_n_ = 1000) subsampled from a simple discrete-state BEAST run using LogCombiner49. All BEAST runs were facilitated by the
BEAGLE library62. Convergence was examined using Tracer v1.7.263, ensuring that effective sampling sizes (ESS) were >200 for all continuous parameters. Posterior analyses. The number of
transitions between the two states was quantified by Markov jumps64. Bayes factors (BF) were calculated based on the indicators of transition rates resulting from BSSVS to determine
statistically supported diffusion routes. Routes with BF > 20 were considered supported and were classified into two categories: 20–150 and >150, which are typically referred to as
‘strong’ and ‘very strong'65. The duration of viral persistence was evaluated using maximised time intervals that were unified by branch lengths, where both nodes were inferred to be in
the same location. Trunk probabilities over time were summarised by PACT v0.9.4 (https://github.com/trvrb/PACT). Trunks were defined as ancestral branches shared by sequences isolated in
2019. Persistence and trunk probability were calculated using 1000 MCMC trees sampled from the posterior phylogeny distributions. PROBING THE SPATIAL DISTRIBUTION OF RE-EMERGENT OUTBREAKS
Buffers representing disease hotspots on the map were created by parsing geographical coordinates inferred at the nodes of the posterior trees in the continuous phylogeographic calibrations,
including tips and internal nodes. A buffer was defined as the area within 1 km of the inferred point location. The buffers created by the phylogenetic inference were merged with or without
the buffers created by the sampling sites of contemporary outbreak events reported in the surveillance data for each tree. Only nodes estimated no earlier than 1 September 2016 (i.e. during
the endemic phase, T2) and the outbreaks during the same period were taken as central points to create buffers. The nodes and the outbreaks were stratified by county/city before being
transformed from points to polygons. Coverage (“captured”) was determined by the sites of new outbreaks covered by the merged buffer areas. New outbreaks were defined as outbreaks occurring
after the latest genetic sample, during 2019–2022. The captured outbreaks were summarised as proportions with 1000 posterior trees, whose node numbers were also used to generate randomly
distributed null models. To evaluate the coverage performance, sensitivity analyses were conducted on buffer size considering multiple radius distances, including 0.5, 1 and 2 km. The
spatial data manipulation was performed using the _sf_ package66. The map data (shp files) were obtained from the government open data platform (data.gov.tw). DATA SOURCES OF POTENTIAL
PREDICTORS Road distances between counties and cities in Taiwan were measured with Google Maps. Data on agricultural statistics, including the number of poultry farms, poultry population and
cropland area during 2015–2019 were obtained from the Agricultural Statistics Database of the Ministry of Agriculture (https://agrstat.moa.gov.tw/sdweb). SELECTION ANALYSES SLAC67 and
MEME68 in the Datamonkey platform69 were used to detect pervasive and episodic positive selection sites, respectively, with a default statistical significance level of _p_ < 0.1. HyPhy
v.2.3.1470 was used to calculate non-synonymous/synonymous rate ratio, d_N_/d_S_ (_ω_) estimates. The results of the surface proteins in the clade 2.3.4.4c viruses were compared with those
in an enzootic, non-GsGd H5N2 lineage previously described in Taiwan21,30. REPORTING SUMMARY Further information on research design is available in the Nature Portfolio Reporting Summary
linked to this article. DATA AVAILABILITY The accession numbers of the Taiwan sequences analysed in our study are listed in Supplementary Table 2. The analysis results used to generate
figures can be found in the project depository71. CODE AVAILABILITY The custom code used in the analyses and the XML files required for BEAST can be found at
https://github.com/yaotli/endemic71. REFERENCES * Karesh, W. B. et al. Ecology of zoonoses: natural and unnatural histories. _Lancet_ 380, 1936–1945 (2012). Article PubMed PubMed Central
Google Scholar * Guan, Y. & Smith, G. J. D. The emergence and diversification of panzootic H5N1 influenza viruses. _Virus Res._ 178, 35–43 (2013). Article CAS PubMed Google Scholar
* Smith, G. J. D., Donis, R. O. & World Health Organization/World. Organisation for Animal Health/Food and Agriculture Organization (WHO/OIE/FAO) H5 Evolution Working Group. Nomenclature
updates resulting from the evolution of avian influenza A(H5) virus clades 2.1.3.2a, 2.2.1, and 2.3.4 during 2013–2014. _Influenza Other Respir. Viruses_ 9, 271–276 (2015). Article PubMed
PubMed Central Google Scholar * Li, Y.-T., Su, Y. C. F. & Smith, G. J. D. H5Nx viruses emerged during the suppression of H5N1 virus populations in poultry. _Microbiol. Spectr._ 9,
e01309–e01321 (2021). Article CAS PubMed PubMed Central Google Scholar * FAO. Approaches to controlling, preventing and eliminating H5N1 Highly Pathogenic Avian Influenza in endemic
countries. _Animal Production and Health Paper. No. 171, Rome_ (2011). * Vijaykrishna, D. et al. Evolutionary dynamics and emergence of panzootic H5N1 influenza viruses. _PLOS Pathog._ 4,
e1000161 (2008). Article PubMed PubMed Central Google Scholar * Tian, H. et al. Avian influenza H5N1 viral and bird migration networks in Asia. _Proc. Natl Acad. Sci. USA_ 112, 172–177
(2015). Article ADS CAS PubMed Google Scholar * Trovão, N. S., Suchard, M. A., Baele, G., Gilbert, M. & Lemey, P. Bayesian Inference reveals host-specific contributions to the
epidemic expansion of influenza A H5N1. _Mol. Biol. Evol._ 32, 3264–3275 (2015). PubMed PubMed Central Google Scholar * Medina, R. A. & García-Sastre, A. Influenza A viruses: new
research developments. _Nat. Rev. Microbiol._ 9, 590–603 (2011). Article CAS PubMed PubMed Central Google Scholar * Saito, T. et al. Intracontinental and intercontinental dissemination
of Asian H5 highly pathogenic avian influenza virus (clade 2.3.4.4) in the winter of 2014–2015. _Rev. Med. Virol._ 25, 388–405 (2015). Article CAS PubMed Google Scholar * WHO. _Antigenic
and Genetic Characteristics Of Zoonotic Influenza A Viruses and Development of Candidate Vaccine Viruses for Pandemic Preparedness_ (WHO, 2020). * Cruz, C. D. et al. Highly pathogenic avian
influenza A (H5N1) from wild birds, poultry, and mammals, Peru. _Emerg. Infect. Dis._ 29, 2572–2576 (2023). Article CAS PubMed PubMed Central Google Scholar * Zhang, G. et al.
Bidirectional movement of emerging H5N8 avian influenza viruses between Europe and Asia via migratory birds since early 2020. _Mol. Biol. Evol._ 40, msad019 (2023). Article CAS PubMed
PubMed Central Google Scholar * Agüero, M. et al. Highly pathogenic avian influenza A(H5N1) virus infection in farmed minks, Spain, October 2022. _Eurosurveillance_ 28, 2300001 (2023). *
Nguyen, T.-Q. et al. Emergence and interstate spread of highly pathogenic avian influenza A(H5N1) in dairy cattle. Preprint at https://doi.org/10.1101/2024.05.01.591751 (2024). * Leguia, M.
et al. Highly pathogenic avian influenza A (H5N1) in marine mammals and seabirds in Peru. _Nat. Commun._ 14, 5489 (2023). Article ADS CAS PubMed PubMed Central Google Scholar *
Pohlmann, A. et al. Has epizootic become enzootic? Evidence for a fundamental change in the infection dynamics of highly pathogenic avian influenza in Europe, 2021. _mBio_ 13, e00609–e00622
(2022). Article PubMed PubMed Central Google Scholar * Lee, Y.-J. et al. Novel reassortant influenza A(H5N8) viruses, South Korea, 2014. _Emerg. Infect. Dis._ 20, 1087–1089 (2014).
Article PubMed PubMed Central Google Scholar * Ip, H. S. et al. Novel Eurasian highly pathogenic avian influenza A H5 viruses in wild birds, Washington, USA, 2014. _Emerg. Infect. Dis._
21, 886–890 (2015). Article CAS PubMed PubMed Central Google Scholar * Kanehira, K. et al. Characterization of an H5N8 influenza A virus isolated from chickens during an outbreak of
severe avian influenza in Japan in April 2014. _Arch. Virol._ 160, 1629–1643 (2015). Article CAS PubMed Google Scholar * Li, Y.-T., Chen, C.-C., Chang, A.-M., Chao, D.-Y. & Smith, G.
J. D. Co-circulation of both low and highly pathogenic avian influenza H5 viruses in current poultry epidemics in Taiwan. _Virus Evol._ 6, veaa037 (2020). Article PubMed PubMed Central
Google Scholar * Huang, C.-W. et al. Evolutionary history of H5 highly pathogenic avian influenza viruses (clade 2.3.4.4c) circulating in Taiwan during 2015–2018. _Infect. Genet. Evol._ 92,
104885 (2021). Article CAS PubMed Google Scholar * Chang, C.-F. et al. Lessons from the largest epidemic of avian influenza viruses in Taiwan, 2015. _Avian Dis._ 60, 156–171 (2016).
Article PubMed Google Scholar * Huang, P.-Y. et al. Genetic characterization of highly pathogenic H5 influenza viruses from poultry in Taiwan, 2015. _Infect. Genet. Evol._ 38, 96–100
(2016). Article CAS PubMed Google Scholar * BAPHIQ. _Epidemic Situation of Avian Influenza_ (BAPHIQ, 2023). * Lee, M.-S. et al. Highly pathogenic avian influenza viruses H5N2, H5N3, and
H5N8 in Taiwan in 2015. _Vet. Microbiol._ 187, 50–57 (2016). Article PubMed Google Scholar * Lemey, P., Rambaut, A., Welch, J. J. & Suchard, M. A. Phylogeography takes a relaxed
random walk in continuous space and time. _Mol. Biol. Evol._ 27, 1877–1885 (2010). Article CAS PubMed PubMed Central Google Scholar * Dellicour, S. et al. Relax, keep walking—a
practical guide to continuous phylogeographic inference with BEAST. _Mol. Biol. Evol._ 38, 3486–3493 (2021). Article CAS PubMed PubMed Central Google Scholar * Liang, W.-S. et al.
Ecological factors associated with persistent circulation of multiple highly pathogenic avian influenza viruses among poultry farms in Taiwan during 2015–17. _PLoS ONE_ 15, e0236581 (2020).
Article CAS PubMed PubMed Central Google Scholar * Lee, C.-C. D. et al. Emergence and evolution of avian H5N2 influenza viruses in chickens in Taiwan. _J. Virol._ 88, 5677–5686 (2014).
Article PubMed PubMed Central Google Scholar * Yang, Q. et al. Assessing the role of live poultry trade in community-structured transmission of avian influenza in China. _Proc. Natl
Acad. Sci. USA_ 117, 5949–5954 (2020). Article ADS CAS PubMed PubMed Central Google Scholar * Hicks, J. T. et al. Agricultural and geographic factors shaped the North American 2015
highly pathogenic avian influenza H5N2 outbreak. _PLoS Pathog._ 16, e1007857 (2020). Article PubMed PubMed Central Google Scholar * Haydon, D. T., Cleaveland, S., Taylor, L. H. &
Laurenson, M. K. Identifying reservoirs of infection: a conceptual and practical challenge. _Emerg. Infect. Dis._ 8, 1468–1473 (2002). Article PubMed Google Scholar * Bahl, J. et al.
Ecosystem interactions underlie the spread of avian influenza A viruses with pandemic potential. _PLoS Pathog._ 12, e1005620 (2016). Article PubMed PubMed Central Google Scholar * Bao,
Y. et al. The influenza virus resource at the National Center for Biotechnology Information. _J. Virol._ 82, 596–601 (2008). Article CAS PubMed Google Scholar * Shu, Y. & McCauley,
J. GISAID: global initiative on sharing all influenza data—from vision to reality. _Eurosurveillance_ 22, 30494 (2017). Article PubMed PubMed Central Google Scholar * Aksamentov, I.,
Roemer, C., Hodcroft, E. B. & Neher, R. A. Nextclade: clade assignment, mutation calling and quality control for viral genomes. _J. Open Source Softw._ 6, 3773 (2021). Article ADS
Google Scholar * Kuraku, S., Zmasek, C. M., Nishimura, O. & Katoh, K. aLeaves facilitates on-demand exploration of metazoan gene family trees on MAFFT sequence alignment server with
enhanced interactivity. _Nucleic Acids Res._ 41, W22–W28 (2013). Article PubMed PubMed Central Google Scholar * The Global Consortium for H5N8 and Related Influenza Viruses. Role for
migratory wild birds in the global spread of avian influenza H5N8. _Science_ 354, 213–217 (2016). Article PubMed Central Google Scholar * Chen, L.-H. et al. Molecular epidemiology in H5Nx
subtypes of avian influenza virus in Taiwan in 2015. _Exp. Rep. Natl Inst. Anim. Health_ 51, 53–68 (2017). Google Scholar * Sagulenko, P., Puller, V. & Neher, R. A. TreeTime:
maximum-likelihood phylodynamic analysis. _Virus Evol._ 4, vex042 (2018). Article PubMed PubMed Central Google Scholar * Minh, B. Q. et al. IQ-TREE 2: new models and efficient methods
for phylogenetic inference in the genomic era. _Mol. Biol. Evol._ 37, 1530–1534 (2020). Article CAS PubMed PubMed Central Google Scholar * FAO. _Empres-i_ (FAO, 2023). * Rambaut, A.,
Lam, T. T., Max Carvalho, L. & Pybus, O. G. Exploring the temporal structure of heterochronous sequences using TempEst (formerly Path-O-Gen). _Virus Evol._ 2, vew007 (2016). Article
PubMed PubMed Central Google Scholar * Yu, G., Smith, D. K., Zhu, H., Guan, Y. & Lam, T. T.-Y. ggtree: an r package for visualization and annotation of phylogenetic trees with their
covariates and other associated data. _Methods Ecol. Evol._ 8, 28–36 (2017). Article Google Scholar * Harrison, J., Kim, J. Y. & Völkle, J. _RSelenium: R Bindings for ‘Selenium
WebDriver’_. R package version 1.7.9 (2024). https://docs.ropensci.org/RSelenium/. * Dellicour, S. et al. Incorporating heterogeneous sampling probabilities in continuous phylogeographic
inference—application to H5N1 spread in the Mekong region. _Bioinformatics_ 36, 2098–2104 (2020). Article CAS PubMed Google Scholar * Dellicour, S., Lemey, P., Suchard, M. A., Gilbert,
M. & Baele, G. Accommodating sampling location uncertainty in continuous phylogeography. _Virus Evol._ 8, veac041 (2022). Article PubMed PubMed Central Google Scholar * Suchard, M.
A. et al. Bayesian phylogenetic and phylodynamic data integration using BEAST 1.10. _Virus Evol._ 4, vey016 (2018). * Pybus, O. G. et al. Unifying the spatial epidemiology and molecular
evolution of emerging epidemics. _Proc. Natl Acad. Sci. USA_ 109, 15066–15071 (2012). Article ADS CAS PubMed PubMed Central Google Scholar * Drummond, A. J., Ho, S. Y. W., Phillips, M.
J. & Rambaut, A. Relaxed phylogenetics and dating with confidence. _PLOoS Biol._ 4, e88 (2006). Article Google Scholar * Gill, M. S. et al. Improving Bayesian population dynamics
inference: a coalescent-based model for multiple loci. _Mol. Biol. Evol._ 30, 713–724 (2013). Article CAS PubMed Google Scholar * Dellicour, S., Rose, R., Faria, N. R., Lemey, P. &
Pybus, O. G. SERAPHIM: studying environmental rasters and phylogenetically informed movements. _Bioinformatics_ 32, 3204–3206 (2016). Article CAS PubMed Google Scholar * Bielejec, F.,
Lemey, P., Baele, G., Rambaut, A. & Suchard, M. A. Inferring heterogeneous evolutionary processes through time: from sequence substitution to phylogeography. _Syst. Biol._ 63, 493–504
(2014). Article PubMed PubMed Central Google Scholar * Lemey, P., Rambaut, A., Drummond, A. J. & Suchard, M. A. Bayesian phylogeography finds its roots. _PLoS Comput. Biol._ 5,
e1000520 (2009). Article ADS MathSciNet PubMed PubMed Central Google Scholar * Scotch, M. et al. Incorporating sampling uncertainty in the geospatial assignment of taxa for virus
phylogeography. _Virus Evol._ 5, vey043 (2019). * Lemey, P. et al. Unifying viral genetics and human transportation data to predict the global transmission dynamics of human influenza H3N2.
_PLoS Pathog._ 10, e1003932 (2014). Article PubMed PubMed Central Google Scholar * Simpson, E. H. Measurement of diversity. _Nature_ 163, 688–688 (1949). Article ADS Google Scholar *
Lemey, P. et al. Untangling introductions and persistence in COVID-19 resurgence in Europe. _Nature_ 595, 713–717 (2021). Article ADS CAS PubMed PubMed Central Google Scholar * Dudas,
G. et al. Virus genomes reveal factors that spread and sustained the Ebola epidemic. _Nature_ 544, 309–315 (2017). Article ADS CAS PubMed PubMed Central Google Scholar * Hong, S. L. et
al. In search of covariates of HIV-1 subtype B spread in the United States—a cautionary tale of large-scale Bayesian phylogeography. _Viruses_ 12, 182 (2020). Article PubMed PubMed
Central Google Scholar * Ayres, D. L. et al. BEAGLE 3: improved performance, scaling, and usability for a high-performance computing library for statistical phylogenetics. _Syst. Biol._
68, 1052–1061 (2019). Article PubMed PubMed Central Google Scholar * Rambaut, A., Drummond, A. J., Xie, D., Baele, G. & Suchard, M. A. Posterior summarization in Bayesian
phylogenetics using tracer 1.7. _Syst. Biol._ 67, 901–904 (2018). Article CAS PubMed PubMed Central Google Scholar * Minin, V. N. & Suchard, M. A. Counting labeled transitions in
continuous-time Markov models of evolution. _J. Math. Biol._ 56, 391–412 (2008). Article MathSciNet PubMed Google Scholar * Kass, R. E. & Raftery, A. E. Bayes factors. _J. Am. Stat.
Assoc._ 90, 773–795 (1995). Article MathSciNet Google Scholar * Pebesma, E. Simple features for R: standardized support for spatial vector. _Data. R. J._ 10, 439–446 (2018). Google
Scholar * Kosakovsky Pond, S. L. & Frost, S. D. W. Not so different after all: a comparison of methods for detecting amino acid sites under selection. _Mol. Biol. Evol._ 22, 1208–1222
(2005). Article PubMed Google Scholar * Murrell, B. et al. Detecting individual sites subject to episodic diversifying selection. _PLoS Genet._ 8, e1002764 (2012). Article CAS PubMed
PubMed Central Google Scholar * Weaver, S. et al. Datamonkey 2.0: a modern web application for characterizing selective and other evolutionary processes. _Mol. Biol. Evol._ 35, 773–777
(2018). Article CAS PubMed PubMed Central Google Scholar * Pond, S. L. K., Frost, S. D. W. & Muse, S. V. HyPhy: hypothesis testing using phylogenies. _Bioinformatics_ 21, 676–679
(2005). Article CAS PubMed Google Scholar * Li, Y. et al. From emergence to endemicity of highly pathogenic H5 avian influenza viruses in Taiwan. _Zenodo_
https://doi.org/10.5281/ZENODO.13933139 (2024). Download references ACKNOWLEDGEMENTS The work was supported by the UK Research and Innovation Global effort on COVID-19 (MR/V035444/1),
Wellcome (207569/Z/17/Z, 224520/Z/21/Z), the UK Medical Research Council New Investigator Research Grant (MR/X002047/1) and a University of Glasgow Lord Kelvin/Adam Smith Fellowship to K.B.
We are grateful for the continued surveillance efforts of the Animal and Plant Health Inspection Agency, MOA, Taiwan. We acknowledge the authors, originating laboratories, and submitting
entities responsible for providing the sequences obtained from GISAID. AUTHOR INFORMATION AUTHORS AND AFFILIATIONS * School of Biodiversity, One Health & Veterinary Medicine, University
of Glasgow, Glasgow, UK Yao-Tsun Li, Katie Hampson & Kirstyn Brunker * Institute of Biomedical Sciences, Academia Sinica, Taipei, Taiwan Hui-Ying Ko & Yi-Ling Lin * MRC-University of
Glasgow Centre for Virus Research, Glasgow, UK Joseph Hughes & Kirstyn Brunker * Center for Diagnostics and Vaccine Development, Centers for Disease Control, Ministry of Health and
Welfare, Taipei, Taiwan Ming-Tsan Liu * Biomedical Translation Research Center, Academia Sinica, Taipei, Taiwan Yi-Ling Lin Authors * Yao-Tsun Li View author publications You can also search
for this author inPubMed Google Scholar * Hui-Ying Ko View author publications You can also search for this author inPubMed Google Scholar * Joseph Hughes View author publications You can
also search for this author inPubMed Google Scholar * Ming-Tsan Liu View author publications You can also search for this author inPubMed Google Scholar * Yi-Ling Lin View author
publications You can also search for this author inPubMed Google Scholar * Katie Hampson View author publications You can also search for this author inPubMed Google Scholar * Kirstyn
Brunker View author publications You can also search for this author inPubMed Google Scholar CONTRIBUTIONS Conceptualisation: Y.-T.L., H.-Y.K. Formal analysis: Y.-T.L. Methodology: Y.-T.L.,
J.H. Resources: H.-Y.K., Y.-L.L. Writing—original draft preparation: Y.-T.L. Writing—review & editing: Y.-T.L., H.-Y.K., J.H., M.-T.L., Y.-L.L., K.H., K.B. Supervision: J.H., K.H., K.B.
Funding: K.H., K.B. CORRESPONDING AUTHORS Correspondence to Yao-Tsun Li or Kirstyn Brunker. ETHICS DECLARATIONS COMPETING INTERESTS The authors declare no competing interests. PEER REVIEW
PEER REVIEW INFORMATION _Nature Communications_ thanks the anonymous reviewer(s) for their contribution to the peer review of this work. A peer review file is available. ADDITIONAL
INFORMATION PUBLISHER’S NOTE Springer Nature remains neutral with regard to jurisdictional claims in published maps and institutional affiliations. SUPPLEMENTARY INFORMATION SUPPLEMENTARY
INFORMATION REPORTING SUMMARY TRANSPARENT PEER REVIEW FILE RIGHTS AND PERMISSIONS OPEN ACCESS This article is licensed under a Creative Commons Attribution 4.0 International License, which
permits use, sharing, adaptation, distribution and reproduction in any medium or format, as long as you give appropriate credit to the original author(s) and the source, provide a link to
the Creative Commons licence, and indicate if changes were made. The images or other third party material in this article are included in the article’s Creative Commons licence, unless
indicated otherwise in a credit line to the material. If material is not included in the article’s Creative Commons licence and your intended use is not permitted by statutory regulation or
exceeds the permitted use, you will need to obtain permission directly from the copyright holder. To view a copy of this licence, visit http://creativecommons.org/licenses/by/4.0/. Reprints
and permissions ABOUT THIS ARTICLE CITE THIS ARTICLE Li, YT., Ko, HY., Hughes, J. _et al._ From emergence to endemicity of highly pathogenic H5 avian influenza viruses in Taiwan. _Nat
Commun_ 15, 9348 (2024). https://doi.org/10.1038/s41467-024-53816-y Download citation * Received: 24 June 2024 * Accepted: 22 October 2024 * Published: 29 October 2024 * DOI:
https://doi.org/10.1038/s41467-024-53816-y SHARE THIS ARTICLE Anyone you share the following link with will be able to read this content: Get shareable link Sorry, a shareable link is not
currently available for this article. Copy to clipboard Provided by the Springer Nature SharedIt content-sharing initiative