- Select a language for the TTS:
- UK English Female
- UK English Male
- US English Female
- US English Male
- Australian Female
- Australian Male
- Language selected: (auto detect) - EN
Play all audios:
ABSTRACT Carbon capture and utilization (CCU) technologies present a promising solution for converting CO2 emissions into valuable products. Here we show how amines, such as monoethanolamine
(MEA) and 2-amino-2-methyl-1-propanol (AMP), influence the electrochemical CO2 reduction process in an integrated CCU system. Using in situ spectroscopic techniques, we identify the key
roles of carbamate bond strength, proton shuttling, and amine structure in dictating reaction pathways on copper (Cu) and lead (Pb) electrodes. Our findings demonstrate that on Cu
electrodes, surface blockage by ammonium species impedes CO₂ reduction, whereas on Pb electrodes, proton shuttling enhances the production of hydrocarbon products. This study provides
additional insights into optimizing CCU systems by tailoring the choice of amines and electrode materials, advancing the selective conversion of CO₂ into valuable chemicals. SIMILAR CONTENT
BEING VIEWED BY OTHERS TOWARD ECONOMICAL APPLICATION OF CARBON CAPTURE AND UTILIZATION TECHNOLOGY WITH NEAR-ZERO CARBON EMISSION Article Open access 05 December 2022 REACTIVE CAPTURE OF CO2
VIA AMINO ACID Article Open access 08 September 2024 ELECTROCHEMICAL UPGRADE OF CO2 FROM AMINE CAPTURE SOLUTION Article 07 December 2020 INTRODUCTION Carbon Capture and Utilization (CCU)
technologies are a viable strategy for bridging fossil-generated CO2 and useful carbon building blocks and thus mitigating the increase in the concentrations of CO2 present in the
atmosphere1. Amine-based solvents have been intensively studied in integrated electrochemical CO2 capture and conversion systems due to their moderate interaction with carbon dioxide
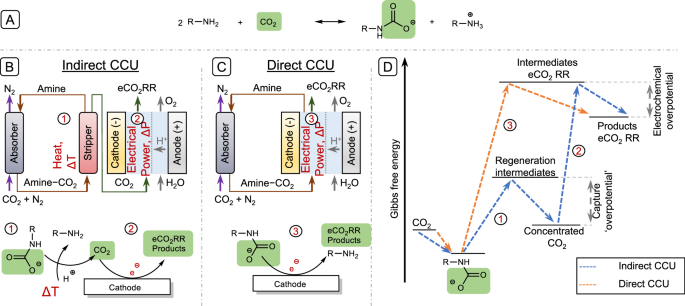
molecule (CO2)2,3,4. CO2 can be chemisorbed on amines (amine−CO2) via a nucleophilic reaction to yield the corresponding carbamates (R−COO−) and ammonium species (R−H+) (Fig. 1A)5. Amines
are interesting because their molecular structure can be altered, allowing a fine-tuning of their CO2-capturing abilities6. CCU processes comprise three important steps: CO2 separation from
the gas mixture, its release and capture material regeneration, and electrochemical conversion (Fig. 1B). Electrochemical methods are gaining favor over traditional temperature or pressure
modulation for their energy efficiency7,8. These methods usually function as separate units, providing flexibility but requiring multiple systems. Recent studies indicate that integrating
the capture and conversion processes may improve energy efficiency and potentially reduce costs (Fig. 1C, D). For example, using captured CO2 directly in electrolysis circumvents the
energy-intensive desorption step, leading to cost savings on CO2 compression and equipment. Energy analyses indicate potential energy savings of up to 44% for integrated systems over
traditional ones9. The integration processes, however, introduce complex physicochemical and engineering considerations, necessitating a reevaluation of existing knowledge and exploration of
new scientific frontiers. One key aspect of this integrated approach is the pH-dependent behavior of CO2 capture using aqueous amines, which notably influences both the capture efficiency
and the subsequent electrochemical conversion process. For instance, studies by Morales-Guio et al.10, and Gallant et al.11 delved into the pH dependence on the interaction between amines
and CO2, which leads to the formation of species like carbamates and bicarbonates, whose equilibrium is highly sensitive to the solution pH. The pH can influence the competitive adsorption
of different species at the electrode interface, affecting electron transfer to the desired carbamate active species and ultimately the efficiency of CO2 reduction. Their results suggest
that the molecular design of amines, including their pKa, provides a means to tailor the capture-conversion process by affecting the initial reaction rate with CO2, the strength of bonding
with CO2, and the pH of the solution. Amines with different pKa values can be used to optimize the capture solution pH to balance the demands for efficient CO2 capture and favorable
conditions for electrochemical conversion. A significant pH drop during capture can also promote the hydrolysis of the carbamate to bicarbonate, complicating the determination of carbamate
involvement in aqueous conditions12. Depending on the electrolyte medium, electrochemically reactive capture can produce a variety of products frequently with high selectivity12, including
CO7,11,13,14,15, formic acid7,13,16, and solid alkali carbonates17. These findings are vital for refining integrated CCU systems and enhancing their efficiency and selectivity for various
products such as CO, formic acid, and alkali carbonates12,18,19,20,21,22. The application of carbamates for direct electrochemical CO2 reduction is an area of increasing interest. The
influence of critical parameters, such as amine type, solvent system, and electrocatalyst selection, along with rate-limiting factors like reactant concentration and reactor conditions, is
not understood. This hampers the systematic design of optimized direct capture-electrolysis reactors12,18,19,21. For example, due to the multi-ionic nature of amine-based electrolytes,
ammonium cations can compete with carbamate species for adsorption sites at the electrode interface, thereby hindering electron transfer to the carbamate11,23,24. Thus, the carbamate
structure is important, as sterically hindered amines may hamper the surface interactions with the cathode. Once the carbamates are adsorbed at the electrode interface, the ability to
facilitate N–C bond breakage will be governed by the amine as well as by the electronic structure of the electrode surface itself. However, the relation of both amine steric/structure and
electrode surface is largely unexplored. Addressing this problem, we study here the combined mechanism of the CO2-captured amine reduction reaction. We do this by incorporating factors that
may affect this process, such as interaction with various electrocatalysts and amine properties, such as steric hindrance, carbamate bond strength, and capacity to increase local proton
concentration via the ammonium species. We designed the experimental setting such that the materials under investigation are substantially different, to maximize the amount of data
generated. We prepared amine−CO2 adducts as the sole CO2 donor in the electrolyte solution using model amines (Fig. 2A)25, specifically monoethanolamine (MEA; no steric hindrance, strong CO2
bond)26 and 2-amino-2-methyl-1-propanol (AMP; sterically hindered, weak CO2 bond)27. These were tested with two solid electrocatalysts (Fig. 2B)28: Cu (inner-sphere electrode, i.e.,
electron transfer with chemical-bond formation or rearrangement at the electrode surface)29,30 and Pb (outer-sphere electrode, i.e., the electrons transfer by tunneling between the electrode
and the substrate through a solvent layer)31. The organic solvent sulfolane12 was used to solubilize amine and carbamate/ammonium (R–COO−/–H+) species, thus preventing the formation of
insoluble carbonate ions (CO22−) and bicarbonate, which are promoted by the presence of water12. This approach avoids the complexities introduced by water acting as a proton shuttle and
allows us to focus on the role of carbamate species as the sole CO2 donor. By combining cyclic voltammetry (CV), in situ Fourier Transform Infra-Red (FTIR) spectroscopy, and bulk
electrolysis, we could pinpoint the distinct behaviors exhibited by amine−CO2 adducts in comparison to dissolved CO2. On the Cu electrode, the ammonium species formed during the CO2
collection step take precedence over the CO2 reduction process. We hypothesized that MEA–H+ prevents surface interaction with released CO2, whereas AMP–H+ allows for some CO2 reduction
thanks to steric hindrance. Conversely, Pb electrode lacks surface interactions, leading to a more dynamic surface environment. The presence of extra protons from ammonium species promotes
the production of protonated products of electrochemical CO2 reduction reaction (eCO2RR). Comparing MEA and AMP, MEA–H+ shows stronger proton shuttling capabilities, resulting in higher
proton content in C2 products. This suggests that MEA–H+ is less constrained by steric hindrance. This study highlights the crucial role of the cathode when paired with the CO2 capture agent
and expands fundamental knowledge on the functioning of a fully integrated CCU system. RESULTS AND DISCUSSION CYCLIC VOLTAMMETRY We studied the differences in kinetics between freely
dissolved and bounded (to our two model amines—MEA and AMP) CO2 using cyclic voltammetry (CV). In a typical experiment, CO2 is captured by the amines by saturating the electrolyte containing
1.0 M of the amine with CO2. Then, the solution is purged with N2 to eliminate all the dissolved CO2 (Fig. S2) This process yields the amine–CO2 adducts of MEA or AMP (MEA–CO2 or AMP–CO2,
respectively) consisting of ammonium (MEA–H+ or AMP–H+, respectively) and a carbamate (MEA–COO– or AMP–COO–, respectively). species. As a result, the carbamate is the eCO2RR’s sole carbon
source. We chose Cu as working electrode due to its good molecule adsorption properties, primarily driven by its strong affinity for C and H atoms30. This choice is driven by our hypothesis
that Cu would enhance interactions with carbamates, leading to improved electron transfer. Figure 3A compares the CV profiles for free CO2, MEA, AMP, and the two CO2-bound amines MEA–CO2 and
AMP–CO2. The CO2 saturated solution (green line) shows a small increase in current density at −1.57 V vs. Ag/AgCl for eCO2RR32. The lack of reductive waves in the experiments with the free
amines (dashed red and blue curves for MEA and AMP, respectively) indicate their electrochemical stability within the potential window. On the Cu electrode, the CV profiles reveal that the
amines’ ability to capture CO2 has a considerable impact on their reduction potential, unlike the free amines. While free CO2 only shows modest activity, MEA–CO2 and AMP–CO2 both show a
large increase in current density at a lower potential at −1.35 and −1.51 V vs. Ag/AgCl (solid red and blue curves, respectively). The enhanced activity indicates either a different
mechanism of the eCO2RR via the carbamates or the presence of a different reduction reaction. MEA–CO2 reduces more easily than AMP–CO2, showing that one of the two species of the MEA–CO2
couple (R–COO–/–H+) has a higher affinity to the Cu surface. This implies that, in the case of MEA–CO2, the reduced steric hindrance increases the amount of substrate available at the
surface, and that surface interaction has a greater role. Conversely, on the Pb electrode (Fig. 3B), which is more inert due to weaker binding of C and H atoms33, the free CO2 reduction
takes place at −1.98 vs. Ag/AgCl. A pronounced peak at −2.25 V vs. Ag/AgCl aligns with the diffusion-limited behavior of CO2, in agreement with previous studies34. This confirms that Pb
surface follows the outer-sphere electron transfer pathway instead of surface substrate absorption. Our findings also show that CO2 adduction by the amines has a significant impact on the
applied potential required to initiate a reduction reaction. While the free amines barely show reductive waves, MEA–CO2 and AMP–CO2 show an increase of activity at −2.06 and −2.13 vs.
Ag/AgCl, respectively. In contrast to Cu electrode, on the Pb electrode the free eCO2RR is more active than that of the amine–CO2 species. Furthermore, MEA–CO2 and AMP–CO2 show accelerated
current density at similar applied potentials on Pb. This contrasts with Cu electrode, where MEA–CO2 shows an earlier onset than AMP–CO2. The Pb electrode is less dependent on the carbamate
steric hindrance and C–N bond strength (cf. the similar carbamate reduction potentials and current density). The variance in onset potentials is attributable to the different potentials of
zero charge (PZC), which dictates the adsorption preference for anions when the applied potential is higher than the zero-charge potential, and vice versa for cations. For Cu and Pb, the
PZCs are +90 mV and −620 mV vs. NHE, respectively35. The higher value for of Cu suggests its enhanced ability to attract cations at less negative potentials compared to Pb. This affects the
electrochemical reaction kinetics and dictates the location of the reduction wave on the electrode surface. As a result, cationic species, such as protons and MEA/AMP-H+, preferentially
accumulate at Cu, influencing the electrocatalytic activity and surface processes. IN SITU FTIR SPECTROSCOPY To gain further insight into the reaction mechanism at the electrode surface, we
ran in situ FTIR spectroscopy during the electrochemical sweep. In this way, we can evaluate the N–C bond strength between amines and electrode surface. Figure 4 shows the results (the inset
shows the reference spectra of the electrolyte, amines and amine−CO2 adducts). The hydrogen stretching region is where amines and the electrolyte molecules that undergo C–H, N–H, and O–H
stretching also absorb36. These various contributions are hard to separate, and the water peak predominates. As a result, the wavenumber range between 3000 and 4000 cm−1 has no useful
data37. Reference spectra of the electrolyte, amine, amine−CO2 adducts and proposed products are shown in Fig. S3 and Table S1. Figure 4A–C shows the spectra for the Cu electrode. A summary
of the most significant bands and their changes is given in Tables S2 and S3, along with the full spectra of the experiments conducted with and without CO2 in Fig. S4. Spectra obtained under
free CO2 in the electrolyte (Fig. 4A) reveals a clear immediate consumption/accumulation of CO2 as a positive band at 2345 cm−1 (O = C = O, asymmetric stretch)30, and the appearance of two
negative bands in the region of carboxylic acids (C = O stretch, at 1675 cm−1) and carboxylates (COO− asymmetric stretch, at 1607 cm−1)38 from −1.5 V vs. Ag/AgCl, which is likely to be the
eCO2RR product formic acid39. When CO2 is captured in AMP (Fig. 4C), an immediate response is observed but show a small increase in intensity after −1.5 V vs. Ag/AgCl in accordance with our
cyclic voltammogram results (Fig. 3A). Two positive consumption bands of AMP–CO2, represented with an ammonium species (NH3+, asymmetric bend, at 1641 cm−1) and a carboxylate ((_N−)_COO−,
asymmetric stretch, at 1573 cm−1)37,40, with a combined negative formation band representing an amine (N–H bending, at 1604 cm−1)40 are observed, the latter indicating regeneration of the
free amine. A CO2 consumption band is also visible, with a stronger increase after −1.5 V vs. Ag/AgCl (2336 cm−1). The formation of a band of carboxylic acid (C = O stretch, negative band at
1695 cm−1) is observed, which could pertain to an eCO2RR product. Unfortunately, due to the amine interaction, no other indication of product formation is visible. With CO2 captured in MEA,
however, we do not see the regeneration of the free amine (N–H bending, at 1596 cm−1, SI Table S1)41. Instead, only some removal of MEA–CO2 (NH3+, positive asymmetric bend and, (_N−_)COO−,
asymmetric stretch, visible as a shoulder at 1638 cm−1 and 1577 cm−1, respectively)37,40, from the surface is apparent at lower applied potentials. The band of (_N−)_COO−, however, increased
more strongly after −1.3 V vs. Ag/AgCl, in agreement with our CV results. We conclude that MEA–CO2− is consumed or removed from the surface, whereas MEA–H+ is retained due to electrostatic
interactions17. This, plus the absence of a CO2 band at ~ 2333 cm−1 suggest that MEA–H+ was blocking the surface from MEA–CO2− due to strong surface interactions with Cu, preventing CO2
release and reduction (see Fig. 4H). It could also mean that the N–C bond in MEA–CO2− is simply too strong to break42. In contrast, AMP–H+, leaves sufficient space for CO2 reduction due to
its steric hindrance (see Fig. 4I) and weaker N–C bonding27. Figure 4D–F shows the in situ FTIR spectra for Pb electrode in the potential range of −1.6 V to −2.5 V vs. Ag/AgCl (the complete
spectra with and without CO2 are given in Fig. S5 along with a summary of the most important bands and their changes in Tables S4 and S5). In the free CO2 solution (Fig. 4D), we see a clear
CO2 consumption as a positive band at 2336 cm−1 arises (O = C = O, asymmetric stretch)30, as well as the development of three negative bands at in the region of carboxylic acids and
carboxylates (C = O and COO− stretches at 1692, 1641 and 1607 cm−1)30,39,43. These bands intensify rapidly at −1.7 V vs. Ag/AgCl in accordance with our CV experiments, suggesting that one or
more eCO2RR products are forming39. Interestingly, in both MEA and AMP–CO2 captured solution, we observe positive consumption bands of both CO2 (2336 and 2338 cm−1) and an ammonium (NH3+,
asymmetric bend, at 1641 and 1643 cm−1, respectively) and a carboxylate ((_N−)_COO−, asymmetric stretch, at 1550 and 1560 cm−1, respectively)37,40. This, along with a negative formation band
representing the free amines (N–H bend, at 1607 and 1607 cm−1)40,41 shows that the eCO2RR occurs via the carbamate. The bands are intensified at potential around −1.9 V vs. Ag/AgCl in
agreement with our CV experiments. Both instances show a band of carboxylic acid formation (C = O stretch, negative band at ~1695 cm−1) that could be an eCO2RR product, although there is
also a consumption band at 1725 cm−1 (C = O stretch) in the same region regarding the MEA system. Again, due to the amine interaction no other indication of product formation is visible. The
similarity between the MEA and AMP solutions suggest that steric hindrance and bond strength plays less a role. Unlike for Cu electrode, CO2 is released and immediately consumed near the
surface in both amine solutions, implying that the strength of the N–C bond played no role. The outer electron transfer and the absence of a strong electrode−amine interaction at the Pb
surface created a more dynamic surface system, allowing for space for CO2 reduction and is represented in Fig. 4H–I. Surprisingly, even though the amine regeneration clearly indicates CO2
release, there is no CO2 formation band. However, spontaneous CO2 release is present in all systems (see below). This implies that eCO2RR is mediated by the carbamate. The carbamate
transfers the CO2 molecule to the electrode, causing the eCO2RR to occur instantaneously at the given potential14. BULK ELECTROLYSIS Chronoamperometric measurements on Cu and Pb electrodes
were performed at −1.8 V and −2.5 V vs. Ag/AgCl, respectively, for 2 h. The Faradaic Efficiency (FE) of liquid and gas products from CO2 reduction reaction (free and captured) are depicted
in Fig. 5 and Table 1. Average current density (mA cm−2) and (released) CO2 present in the outlet are also shown in Table 1. The FEs of possible eCO2RR products and amount of CO2 release
every 15 min are shown in Fig. S6 and Table S6, while the FEs of blank experiments (without CO2) are shown in Table S7 whereas the corresponding chronoamperometric measurements are shown in
Fig. S7. In contrast to electrochemical CO2 reduction in aqueous solvent on Cu electrode, where substantial amounts of C2+ is formed, in sulfolane solvent, Cu electrode (Fig. 5A) and free
CO2 (Table 1, entry 1) produced mainly formic acid (72%), H2 (26%), and CO (7%)32. However, in the case of MEA (Table 1, entry 2), only H2 (42%) is observed although an average of 7300 ppm
of CO2 was found in the gas outlet, indicating that CO2 is released from MEA–CO2. This adds to the notion that MEA–H+ is limiting electron transport to the desired carbamate active species
and that this species is only present at the surface (represented in Fig. 5B, left)15,23. As a result, rather than CO2 reduction, the proton reduction initiated by MEA–H+ is the sole cause
of the decrease in onset potential and increase in current density observed in the Fig. 3A. This indicates that MEA–H+ is an efficient proton shuttle24,44 that raises the local proton
concentration as seen elsewhere with homogeneous eCO2RR electrocatalysts45. We attribute the higher current density of 3.9 mA cm−2 to the proton from this species (–NH3+) being easier to
reduce and more abundant than trace water in the system23. We see no other products, although solvent and/or amine decomposition are likely. The absence of eCO2RR products on Cu electrode in
MEA-CO2 is supported by the in situ FTIR results (Fig. 4B), which shows no bands related to CO2 reduction nor to carbamate consumption. When using CO2 captured in AMP (Table 1, entry 3), a
small amount of formic acid (4%) is detected next to H2 (42%), indicating that CO2 reduction was possible. The steric hindrance of the AMP-moiety likely enables the proximity of the AMP
carbamate to the surface, facilitating the release CO2, as depicted in Fig. 5B (right)12. Like with MEA, we attribute the enhancement in current density and decrease in onset potential in
cyclic voltammetry (Fig. 3A) to proton reduction by AMP–H+. However, due to the smaller likelihood of two protons being in proximity within the sterically hindered AMP, the onset potential
is more negative, and the current density is lower compared to MEA. A remaining percentage of FE remains unaccounted for in both MEA and AMP systems. The surplus electrons may be involved in
the breakdown reactions of solvents or amines (vide infra). In agreement with the in situ FTIR spectra (Fig. 4), the Pb electrode shows a different product distribution during bulk
electrolysis (Fig. 5C). In free CO2 solution (Table 1, entry 3, and trace amounts of water, formic acid (81%) are identified as the main product from eCO2RR, followed by oxalic acid (15%),
CO (10%), and a minor amount of H2 (4%)7. Since oxalic acid is a dimerization product of two CO2•− radicals, its presence indicates an outer-sphere electron transfer31. A considerable amount
of H2 (32%) is found in the CO2 captured in MEA (Table 1, entry 5), indicating that MEA–H+ is still supplying high amount of protons to the surface leading to an increase in current density
(−5.3 mA cm−2). Next to formic acid (20%) and CO (4%), C2 hydrocarbons are also observed, with C2H6 (2%) being slightly more abundant than C2H4 (1%), while oxalic acid is absent. The latter
showed that the initial CO2 reduction product is stabilized by MEA, enabling additional protonation and activating the CO2 by removing its linearity46. AMP (Table 1, entry 6) gives a
slightly lower average current density of −1.3 mA cm–2, while more formic acid (80%) is detected. Interestingly, the H2 (8%) generation decreases considerably, and similar amounts of CO (4%)
are observed. Surprisingly, glycolic acid (4%), which is one reduction step further then oxalic acid, is detected, even though oxalic acid itself is not observed. This indicates that AMP
stabilizes and protonates the initial CO2•− less then MEA, allowing for dimerization of the radical. C2 hydrocarbons are also detected, albeit at very low FE (Table 1). As compared to MEA,
the C2 products generated from CO2 captured by AMP contained fewer protons and less H2 is produced overall, indicating that fewer protons are accessible at the surface47. The proton shortage
is most likely caused by AMP’s steric hindrance, that reduced the space available for AMP–H+ species to approach the surface, making MEA–H+ a better proton shuttle (see Fig. 5D). These
results contrast to previous publications on CO2RR in aqueous solvent, where a high amount of C2+ hydrocarbons is produced29,48. The mechanism to C2 products can either follow a C1 pathway,
where *COH is the key intermediate, leading to both methane and C2 products, or it can follow a C2 pathway in which C-C coupling occurs via dimerization of two adsorbed *CO29,48,49 leading
to the formation of only C2+ products. Our results suggest that dimerization follows the C2 pathway because methane was not identified as a product under any of our experimental conditions
(Table 1). However, the FE of C2+ is very low because a certain concentration of protons must be available for the hydrogenation of *CO intermediate to C2+ hydrocarbons. Similar results were
obtained previously by our group on a Cu electrode in acetonitrile solvent in the presence of different concentrations of water. Ethylene, for instance, was detected only when the
concentration of water was higher than 500 mM 32,50. In addition, the solubility of CO, the key intermediate, is lower in organic solvent than in aqueous medium, hindering the accessibility
of such species to the electrode surface. Interestingly, the amounts of CO2 in the gas stream are consistent across all bulk electrolysis with CO2 captured in amines even if no products that
reduce CO2 are found. Due to the weaker R–CO2 bond, we anticipated that AMP would release more CO2 or that there would be a direct correlation between the current density and CO2 release.
We ran control experiments to determine whether the electrochemical experiment or the acid counter electrode compartment was responsible for the CO2 release. The results (shown in Fig. S10)
show that the CO2 release is spontaneous. The (positive) effect of the amines on eCO2RR is larger on Pb than on Cu electrodes, although both amines release similar CO2 amounts. The
superiority of Cu as a hydrogen evolution electrocatalyst and the reputation of Pb as a poor proton reduction electrocatalyst are likely related51. A further factor is how the AMP–COO−/–H+
couple interacts with the surface52. Using Cu as an electrocatalyst might be counterproductive when using CO2-shuttling molecules because of the good interactions with –C and –H atoms in the
organic compounds29. Pb is less electrocatalytically active, tending to form free radicals via outer-sphere electron transfer28,53. If these radicals are stabilized, this electron transfer
may help the CO2 molecule react towards longer and protonated products. Another possibility is capability of the carbamates to place the CO2 molecules near the electrode surface and removing
the linearity of the CO2 molecule. This facilitates an interaction of Pb with the oxygen atoms, causing the reaction to occur more smoothly54. Figure S11 illustrates a hypothesized
mechanism for the influence of amines on the Cu and Pb WE. As we expected, our findings with sulfolane solvent differ from those reported in aqueous solutions on Ag electrode10,11,12,15.
While we found an amine dependence, the studies in aqueous solvents show a weak amine dependence, although the proton shuttling effect of the formed ammonium species is clear10,11. The
likely explanation for this difference is the prevention of bicarbonate formation, which is favored in presence of water. However, the significance of pH-dependent H-bonds through water55
should not be overlooked. The steric structure of amines, exemplified by the α-methyl groups in AMP, creates hindrance that affects the penetration and solvation of trace water molecules56.
These structural differences lead to stronger hydrogen bonding of water with the AMP nitrogen atom compared to MEA. Consequently, the reactivity with CO2 is influenced, with a
temperature-dependent shift in AMP’s favor that facilitates carbamate formation. Essentially, the methyl groups in AMP modulate the hydrogen bond network, impacting both solvation dynamics
and interaction with CO2 in the presence of trace water57. The remaining FE in Fig. 5 suggests that not all of the electrons added to the electrochemical reduction of amine–CO2 resulted into
identifiable products, particularly with MEA as the CO2 captor on Cu electrodes, in which electrolysis of pure sulfolane and sulfolane-amine (in the absence of CO2) showed a small current
density (Fig. S7), suggesting a reduction or degradation of the solvent is taking place (Table S7 and Fig. S7), though no product was detected by either GC and HPLC (Table S7 and Figs. S8
and S9). However, in situ FTIR analysis of the pure solvent and solvent amine for both Cu and Pb electrodes characteristic bands at 3250–2750 cm−1, assigned to C−H stretching of butane58, or
tetrahydrothiophene59 which corresponds to sulfolane decomposition (cf. Figs. S4 and S5)60,61. This suggests that solvent degradation, particularly prevalent on copper-based systems (Fig.
S4), is responsible for the FE losses observed in Fig. 5. In Figs. S7–S9, we discuss the possible reactions which may take place involving solvent degradation. In addition, we performed 1H
and 13C nuclear magnetic resonance (NMR) spectroscopy. Our results depicted in Fig. S16 suggest that solvent decomposition indeed plays a role in the reduced FE observed in the absence of
CO2 (Fig. 5). The presence of CO2 shifts the system toward CO2 reduction products like formic acid, thereby improving the FE. However, the overlapping NMR signals preclude the identification
of all degradation products (Fig. S17). In summary, this study addresses the role of amines in conjunction with the cathode material in the direct electrocatalytic CO2RR for carbon capture
and utilization. Our results contribute to understanding the role and mechanism of amines in direct electrocatalytic CO2 reduction in carbon capture and utilization. Amines play an active
part in surface mechanisms. We show that various factors influence this process, such as steric hindrance, carbamate bond strength, induced local proton concentration, and electrocatalytic
electron transfer. Cu (inner-sphere electron transfer) and Pb (outer-sphere electron transfer) were compared as CO2 reduction electrocatalysts. Two model amines, MEA (no steric hindrance,
strong CO2 bond) and AMP (steric hindrance, weak CO2 bond) were used to study the effects of amines. We demonstrate that the ammonium species created during the CO2 collection step dominate
the free CO2 reduction process on Cu electrodes. MEA–CO2 reduces more readily than AMP–CO2, indicating that one of the two species in the MEA–CO2 couple, (R–COO–/–H+), has a stronger
affinity for the Cu surface. FTIR experiments confirm that the AMP–CO2 is converted to free AMP and that CO2 reduction occurs, which is absent in the case of MEA. We theorize that MEA–H+
prevents interaction with the Cu surface with released CO2, whereas AMP–H+ permits some CO2 reduction due to steric hindrance, which enables the CO2 to reach the surface. As a result, rather
than CO2 reduction, the proton reduction initiated by the ammonium species is the sole cause of the decrease in onset potential and increase in current density observed in the CV. This is
supported by bulk electrolysis on Cu electrodes showing that MEA–CO2 only produces H2 as the reduction product, whereas AMP–CO2 also produces small amounts of acid to complement our FTIR
results. This suggests that employing inner-sphere electrodes—such as Cu—while utilizing CO2-shuttling compounds may not be beneficial since these cathodes enhance interaction with organic
molecules because of their strong bonds with atoms of the –C and –H. Conversely, when Pb electrodes are used, the free eCO2RR is more active than amines–CO2 adducts. Compared to Cu, the
applied potential difference between MEA–CO2 and AMP–CO2 where the current density is accelerated, is significantly less. The conversion of MEA–CO2 and AMP–CO2 to free MEA and AMP as well as
the reduction of CO2 are both confirmed in both cases by FTIR. By showing that the variation in steric hindrance and C−N bond strength of the carbamates has less of an effect on the Pb
electrode, we conclude that there are fewer surface interactions, resulting in a more dynamic surface environment. This supports our hypotheses that outer-sphere electrodes, such as Pb, are
more suitable for direct carbamate reduction and that substrate absorption on the surface is not beneficial. Indeed, bulk electrolysis on Pb showed eCO2RR products when MEA–CO2 and AMP–CO2
are used as a CO2 donor. Interestingly, the amines–CO2 adducts yield more protonated products. The presence of extra protons from ammonium species in bulk electrolysis promotes the
production of protonated eCO2RR products. Comparing MEA and AMP, we see that MEA–H+ has superior proton shuttling capabilities, resulting in higher proton content in C2 products. This
implies that MEA–H+ is less hampered by steric hindrance. The amount of CO2 in the gas stream remained consistent across all bulk electrolysis with CO2 captured in amines, even though no CO2
reduction products were discovered. Surprisingly, no CO2 forming band is visible in FTIR even though the amine regeneration clearly indicates CO2 release. We hypothesize that the carbamate
functions as a mediator, causing the CO2 molecule to be activated and transferred to the electrode, making the eCO2RR instant at the specified potential. Overall, our results open new
opportunities for designing combined electrochemical/chemical absorption setups for effective carbon capture and utilization. Unraveling the complex mechanisms of amine-based CO2 reduction
could encourage the development of template amines that dictate the product composition in CO2 reduction outcomes. METHODS Additional details on the experiments performed in this study are
found in the SI. CHEMICALS AND ELECTRODES All reagents and solvents were used without purification unless noted otherwise. Fresh solutions were prepared for each experiment, and all
electrochemical reactions were performed under atmospheric condition and at room temperature unless otherwise noted. All water was purified using a Milli-Q Millipore system (Merck Milli-Q IQ
7000 Ultrapure Lab Water System, Millipak 0.22-µm Filter) with a total organic carbon content <3 ppb and a resistivity higher than 18 MΩ·cm at room temperature. All glassware was
previously cleaned using a standard acidic permanganate cleaning procedure. All glassware and tools, including three-electrode glass cells and PEEK bulk electrolysis cells, were soaked in a
solution of 1 g L⁻¹ KMnO₄ and 0.5 M H₂SO₄ in Milli-Q water. After decanting the excess solution for reuse, the glassware was rinsed three times with Milli-Q water, then soaked for at least
30 min in a freshly prepared piranha solution (approximately 10 mL H2SO4 and 3 mL H2O2 per liter of Milli-Q). This step oxidized organic materials and reduced MnO2 and residual MnO₄⁻. The
glassware was then rinsed three times with Milli-Q water and boiled three times to remove the remaining ions. Finally, the glassware was stored submerged in Milli-Q water and further dried
at 130 °C before use (for more details, see details in the SI, Section S3). During measurement, solutions were purged with nitrogen gas (N2, 99.999%, Linde) or carbon dioxide gas (CO2,
99.5%, Linde). The amines used in this study are monoethanolamine (MEA, >99.0%, TCI Europe N.V.) and 2-amino-2-methyl-1-propanol (AMP, >93.0% TCI Europe N.V) and a standard electrolyte
of a saturated solution of tetraethylammonium chloride (≥98.0%, TEACl, VWR International B.V.) in tetrahydrothiophene 1,1-dioxide (sulfolane, ≥99.0%, Sigma-Aldrich) was used. The average
water content of the electrolyte was >1000 ppm, determined by measuring 0.2 mL on a Metrohm 831 Karl-Fischer Coulometer. The following chemicals were used in cleaning and polishing: KMnO4
(VWR International B.V., GPR RECTAPUR), H2SO4 (95−98%, Sigma-Aldrich), H2O2 (30%, Sigma-Aldrich), and H3PO4 (85%, VWR International B.V.). The following electrodes were used for CV and in
situ FTIR experiments: a Pb disk (99.99 + %, MaTecK, Ø = 5 mm, Ageo = 0.196 cm2) or a Cu disk (99.99 + %, MaTecK, Ø = 5 mm, Ageo = 0.196 cm2) working electrodes (WE), a Pt wire (0.5 mm, 99.9
%, MatecK) counter electrode (CE) and a Ag/AgCl reference electrode (RE, 3.0 M KCl leakless Ag/AgCl,). For bulk electrolysis, the following electrodes were used: Pb wire (Advent, 99.999%, Ø
= 2 mm of Ageo = 2.76 cm2) or Cu wire (99.99 + %, MaTecK, Ø = 1 mm, Ageo = 9.40 cm2) as WE, a Pt mesh CE (2.0 cm × 2.0 cm, 0.1 mm wire diameter, 99.9%, Sigma-Aldrich) and Ag/AgCl RE (3.0 M
KCl miniature leakless Ag/AgCl). The Pb and Cu WE used in this study were treated by (electro-)polishing before each measurement. The Pb WE was mechanically polished using a diamond
polishing paste (Buehler, MetaDiTM, 1 µm) on a small rectangular felt polishing pad (MicroCloth, PSA backing, Buehler) following a figure-8 hand movement, or it was polished with a Kleenex
wipe until shiny. After that, the Pb electrode was electropolished in an aqueous 0.5 M H2SO4 solution using Pt as the RE and CE at −2.5 V vs. Pt for 500 s4. Prior to usage, the Cu electrode
was electropolished using another Cu as the RE and CE in an aqueous solution of 66% (v/v%) H3PO4 for 3 × 10 s at 3.0 V vs. Cu. The Pt CE was flame annealed, and the Ag/AgCl RE was washed
with the electrolyte solution before use. The calibration of Ag/AgCl was done by measuring the ferrocene/ferrocenium+ redox couple in the sat. TEACl in sulfolane electrolyte. CV measurements
were performed using a three-electrode configuration at ambient temperature with a glassy carbon (GC) (Tarek Equilabrium, Ø = 6 mm, Ageo = 0.28274 cm2) WE, a flame annealed Pt CE, and a
normal or miniature leakless Ag/AgCl reference electrode (Ø = 5 mm ET069, eDAQ or Ø = 2 mm ET072 eDAQ, respectively). The GC WE was hand polished following a figure 8 hand movement of the WE
with a diamond polishing paste (Buehler, MetaDiTM, 1 µm) on a small rectangular piece of felt polishing pad (MicroCloth, PSA backing, Buehler). The solution containing the
ferrocene/ferrocenium+ redox couple was magnetically stirred during degassing and between each measurement. Measurements were taken starting from 0.25 to 0.67 V vs. Ag/AgCl and back with a
scan rate of 100 mV s−1 and three scans were taken. The obtained result is shown in Fig. S2D. In this study, all potentials are refereed to Ag/AgCl scale, for comparison it corresponds to
the 0.197 V vs. NHE. PROCEDURE FOR PREPARING MEA−CO 2 AND AMP−CO 2 A 1.0 M amine solution in (sat. TEACl in sulfolane) was saturated with CO2 (10 mL min−1) for 15 min to fully convert the
amine to the ammonium and carbamate species. The solution was then purged for 15 min with N2 gas (10 mL min−1) to remove any remaining dissolved CO2, generating the carbamate as the only CO2
source, after which CV was performed. Control experiments were carried out by additionally purging the solution for 15 min with N2 gas (10 mL min−1) and gave identical results, confirming
the full removal of CO2 (for details, see SI, Section S4.2 and the resulting data as shown in Figs. 2B, C and S12A, B). PROCEDURE FOR CYCLIC VOLTAMMETRY EXPERIMENTS Cyclic voltammetry (CV)
measurements were performed using a three-electrode configuration in an undivided four-necked heart-shaped cell (Fig. S1A) at ambient temperature and pressure, filled with 5 mL of solution.
Pb disk or Cu disk were used as WE, and Pt wire and Ag/AgCl as CE and RE, respectively. The WE, CE, and RE were prepared as previously explained. All CVs were recorded with a Metrohm Multi
Autolab potentiostat (M204, serial number MAC90609) controlled by Nova 2.1 software. The obtained data is exported as txt file and later processed using either Excel or origin software. The
resistance of the solution was determined prior to each measurement using the _i_-interrupt program and the potential was corrected for the _i_R drop by applying a correction of 85% of the
solution resistance. The iR compensation was automatically applied by the potentiostat with average resistance (_N_ = 8) 667±263 Ω and 530±197 Ω for Pb and Cu, respectively. Figures without
_i_R compensation are shown in Fig. S18. The standard electrolyte consisted of a saturated solution of TEACl in sulfolane (5 mL). Freshly prepared solutions were magnetically stirred during
(de-)gassing and between each measurement. Measurements were taken from the more positive to the more negative potential and back with −1.0 V to −2.5 V vs. Ag/AgCl (Pb) or with −1.0 V to
−1.8 V vs. Ag/AgCl (Cu) with a scan rate of 10 mV s−1 and three scans were taken (for details on the experimental setup see SI, section S4). ELECTROCHEMICAL IN SITU FOURIER TRANSFORM
INFRARED SPECTROSCOPY In situ Fourier-Transform infrared (FTIR) spectroscopy was performed to study possible intermediates and products during the electrochemical experiment. The spectra
were measured on a Bruker Vertex 80-V IR spectrometer equipped with a liquid nitrogen-cooled MCT detector. A Veemax III (PIKE Technologies) was positioned in the spectrometer, wherein a
homemade three-electrode spectroelectrochemical cell (Fig. S1B) with a CaF2 prism attached to the bottom was placed62. The cell was filled with the electrolyte with(-out) amine (~20 mL).
Either Cu or Pb disk electrodes were used as the WE, whereas a Pt wire and Ag/AgCl were used as counter and reference electrodes, respectively (for electrode preparation details, see SI,
section S2). The WE was pressed against the CaF2 prism to obtain a thin film configuration62. The thin film was refreshed after a full experimental set. FTIR spectra were collected in a
range of 4000–900 cm−1 at a resolution of 8 cm−1 with averaging 128 scans. We removed data from the range 1250–900 cm−1 due to the interference of strong solvent bands. All chronoamperometry
experiments were performed with a Metrohm Autolab potentiostat controlled by Nova 2.1 software. The obtained data is exported as txt file and later processed using either excel or origin
software. Spectra were collected over a potential range in 0.1 V decrements from −1.0 V to −1.8 V vs. Ag/AgCl (Cu) or from −1.6 V to −2.5 V vs. Ag/AgCl (Pb). The applied potential was not
compensated for _i_R drop. A baseline was subtracted using the spectra obtained at −1.0 V (Cu) or –1.6 V (Pb) vs. Ag/AgCl. Spectra are presented as reflectance, according to A = −log (R/R0),
where R and R0 are the correspond to the single beam spectra obtained at the sample and reference potentials, respectively. Positive bands (pointing up) in reflectance spectra correspond to
species that were present on or near the electrode surface at the reference potential and are “consumed or removed from the surface” at the sample potential. Negative bands (pointing down)
represent the “formation or accumulation of products or species on the surface” at the sample potential (for details about the cell, see SI, section S5). ELECTROCHEMICAL BULK ELECTROLYSIS
Bulk electrolysis was performed in a PEEK two-compartment (divided) cell designed for online gas chromatography (GC) analysis during the experiment (the cell design is shown in Fig. S1C).
The cell was operated by an IVIUM Vertex.s potentiostat/galvanostat controlled by IviumSoft 4.1113 software. The obtained data is exported as txt file and later processed using either excel
or origin software. The potential was corrected for the _iR_ drop by applying a correction of 85% of the resistance, determined at the start of the experiment by Electrochemical Impedance
Spectroscopy (EIS), the default setting in IviumSoft and is automatically applied by the potentiostat. iR Average resistance (_N_ = 8) 8±7 Ω and 43±46 Ω for Pb and Cu, respectively. The
anodic (counter electrode compartment, CEC) and cathodic (working electrode compartment, WEC) compartments were separated by a pre-treated Nafion−117 membrane (thickness = 170 microns, 5 × 5
cm) that was patted dry with tissue paper and then placed between the two compartments. Before its use, Nafion−117 membranes were cleaned by heating in Milli-Q water at 80 °C for 60 min,
followed by three cycles in 3 wt% H₂O₂ solution, and then in 1.0 M H2SO4 solution, each heated to 80 °C for 60 min and rinsed with Milli-Q water. This process was repeated three times, and
the membranes were stored in fresh Milli-Q water until needed63,64. The WEC was made up of a Cu or Pb WE and a miniature leakless Ag/AgCl RE immersed in a sat. TEACl in sulfolane solution (8
mL) with or without 1.0 M amine. The CEC held a Pt mesh CE in a 0.5 M H2SO4 aqueous solution (8 mL). A gas flow of either N2 or CO2 was controlled by a Brooks Mass Flow Controller (Model
O254). For CO₂ electroreduction with gaseous products, the CO2 flow rate was measured using the same mass flow controller to maintain a consistent flow rate of 5 mL/min throughout the
experiment, ensuring accurate and controlled delivery of CO₂ to the electrochemical cell. Gas samples were analyzed every 5 min by gas chromatography (Agilent 990 Micro GC). Samples were
taken from 15 min before the start and until the end of the electrolysis. Chronoamperometric experiments were performed for 2-h at −2.5 V and −1.8 V vs. Ag/AgCl for the Pb and Cu WE,
respectively. The bulk electrolysis method is further discussed in SI, Section S6. Qualitative and quantitative liquid and gas product analysis were done with high-performance liquid
chromatography (HPLC) and gas chromatography (GC). For the GC analysis, it was used a gas chromatograph (Agilent 990 Micro GC) with two thermal conductivity detectors (TCD). Gas samples were
automatically taken every 5 min and analyzed on a Molsieve column (MS5A SS 10 m × 0.25 mm × 30 µm, Agilent) for H₂, O₂, N₂, CH₄, CO, and on a CP-PoraPLOT U column (10 m × 0.25 mm × 8 µm,
Agilent) for CO₂, ethene, ethane, propene, and H₂O. Molsieve column parameters: Ar carrier gas, 110 °C injection temperature, 50 ms injection time, 14 s backflush, 80 °C column temperature,
200 kPa initial pressure, 120-second run time. PoraPLOT column parameters: He carrier gas, 110 °C injection temperature, 50 ms injection time, no backflush, 80 °C column temperature, 200 kPa
initial pressure, 120-second run time. Calibration curves for all gases, using Nippon calibration gas with specific concentrations, are shown in Fig. S12. The Faradaic efficiency for every
measured time was calculated according to Equation S1. HPLC analyses were carried out in high-performance liquid chromatography (HPLC, Agilent 1260, Infinity II). Samples (50 µL) were
diluted with 1000 µL of Milli-Q water and analyzed on an ion exclusion column (Bio-Rad Aminex HPX-87H) for small, polar products from CO₂ reduction (formic acid, glycolic acid, oxalic acid).
The column was coupled with a variable wavelength detector (VWD, G7114A) and a refractive index detector (RID, G7162A). Analysis was performed at 50 °C with a 5 mM H2SO4 aqueous mobile
phase, a flow rate of 0.5 mL min⁻¹, an injection volume of 20 µL, and a 35-min cycle. Product concentrations were determined by normalizing the product peak area to the peak of sulfolane
(internal standard) and applying a conversion factor from calibration curves (Fig. S13). The Faradaic efficiency was calculated according to Equation S4. (For more details on the HPLC and GC
procedure, see SI, section S7−8). DATA AVAILABILITY The Data Source generated in this study have been deposited in the Figshare database (https://doi.org/10.6084/m9.figshare.27037306). The
processed data are available at Figshare. The data generated in this study are provided in the Supplementary Information/Source Data file (https://figshare.com/s/5ee9d0a8ae1f301f29c8).
Source data are provided with this paper. REFERENCES * Al‐Mamoori, A., Krishnamurthy, A., Rownaghi, A. A. & Rezaei, F. Carbon capture and utilization update. _Energy Technol._ 5, 834–849
(2017). Article Google Scholar * Gregory, L. B. & Scharmann, W. G. Carbon dioxide scrubbing by amine solutions. _Ind. Eng. Chem._ 29, 514–519 (1937). Article CAS Google Scholar *
Meng, F. et al. Research progress of aqueous amine solution for CO2 capture: a review. _Renew. Sustain. Energy Rev._ 168, 112902 (2022). Article CAS Google Scholar * Rochelle, G. T. Amine
scrubbing for CO 2 capture. _Science_ 325, 1652–1654 (2009). Article ADS CAS PubMed Google Scholar * Said, R. Ben, Kolle, J. M., Essalah, K., Tangour, B. & Sayari, A. A unified
approach to CO 2 –amine reaction mechanisms. _ACS Omega_ 5, 26125–26133 (2020). Article CAS PubMed PubMed Central Google Scholar * Yamada, H. Amine-based capture of CO2 for utilization
and storage. _Polym. J._ 53, 93–102 (2021). Article Google Scholar * Pérez-Gallent, E., Vankani, C., Sánchez-Martínez, C., Anastasopol, A. & Goetheer, E. Integrating CO2 capture with
electrochemical conversion using amine-based capture solvents as electrolytes. _Ind. Eng. Chem. Res_ 60, 4269–4278 (2021). Article Google Scholar * Liu, G. et al. Integrated CO2 capture
and utilisation: a promising step contributing to carbon neutrality. _Carbon Capture Sci. Technol._ 7, 100116 (2023). Article CAS Google Scholar * Li, M., Irtem, E., Iglesias van
Montfort, H.-P. P., Abdinejad, M. & Burdyny, T. Energy comparison of sequential and integrated CO2 capture and electrochemical conversion. _Nat. Commun._ 13, 5398 (2022). Article ADS
CAS PubMed PubMed Central Google Scholar * Shen, K. et al. On the origin of carbon sources in the electrochemical upgrade of CO2 from carbon capture solutions. _Joule_ 7, 1260–1276
(2023). Article CAS Google Scholar * Leverick, G. et al. Uncovering the active species in amine-mediated CO2 reduction to CO on Ag. _ACS Catal._ 13, 12322–12337 (2023). Article CAS
Google Scholar * Jerng, S. E. & Gallant, B. M. Electrochemical reduction of CO2 in the captured state using aqueous or nonaqueous amines. _iScience_ 25, 104558 (2022). Article ADS CAS
PubMed PubMed Central Google Scholar * Chen, L. et al. Electrochemical reduction of carbon dioxide in a monoethanolamine capture medium. _ChemSusChem_ 10, 4109–4118 (2017). Article CAS
PubMed Google Scholar * Abdinejad, M., Mirza, Z., Zhang, X. & Kraatz, H.-B. Enhanced electrocatalytic activity of primary amines for CO2 reduction using copper electrodes in aqueous
solution. _ACS Sustain Chem. Eng._ 8, 1715–1720 (2020). Article CAS Google Scholar * Lee, G. et al. Electrochemical upgrade of CO2 from amine capture solution. _Nat. Energy_ 6, 46–53
(2020). Article ADS Google Scholar * Bhattacharya, M., Sebghati, S., Vercella, Y. M. & Saouma, C. T. Electrochemical reduction of carbamates and carbamic acids: implications for
combined carbon capture and electrochemical CO2 recycling. _J. Electrochem Soc._ 167, 086507 (2020). Article ADS CAS Google Scholar * Khurram, A., Yan, L., Yin, Y., Zhao, L. &
Gallant, B. M. Promoting amine-activated electrochemical CO2 conversion with alkali salts. _J. Phys. Chem. C._ 123, 18222–18231 (2019). Article CAS Google Scholar * Sullivan, I. et al.
Coupling electrochemical CO2 conversion with CO2 capture. _Nat. Catal._ 4, 952–958 (2021). Article CAS Google Scholar * Siegel, R. E., Pattanayak, S. & Berben, L. A. Reactive capture
of CO2: opportunities and challenges. _ACS Catal._ 13, 766–784 (2023). Article CAS Google Scholar * Kar, S., Goeppert, A. & Prakash, G. K. S. Integrated CO2 capture and conversion to
formate and methanol: connecting two threads. _Acc. Chem. Res_ 52, 2892–2903 (2019). Article CAS PubMed Google Scholar * Massen-Hane, M., Diederichsen, K. M. & Hatton, T. A.
Engineering redox-active electrochemically mediated carbon dioxide capture systems. _Nat. Chem. Eng._ 1, 35–44 (2024). Article Google Scholar * Xia, Q. et al. Integration of CO2 capture
and electrochemical conversion. _ACS Energy Lett._ 8, 2840–2857 (2023). Article CAS Google Scholar * Safipour, J., Weber, A. Z. & Bell, A. T. Detrimental effects of monoethanolamine
and other amine-based capture agents on the electrochemical reduction of CO2. _ACS Energy Lett_. 8, 5012–5017 (2023). * Yang, L. et al. Promoting CO2 electroreduction to acetate by an
amine-terminal, dendrimer-functionalized Cu catalyst. _ACS Cent. Sci._ 9, 1905–1912 (2023). Article CAS PubMed PubMed Central Google Scholar * Muchan, P. et al. Effect of number of
hydroxyl group in sterically hindered alkanolamine on CO2 capture activity. _Energy Procedia_ 114, 1966–1972 (2017). Article CAS Google Scholar * Yin, L., Li, X., Zhang, L. & Li, J.
Characteristics of carbon dioxide desorption from MEA-based organic solvent absorbents. _Int. J. Greenh. Gas. Control_ 104, 103224 (2021). Article CAS Google Scholar * Yoon, B., Calabro,
D. C., Baugh, L. S., Raman, S. & Hwang, G. S. Probing strong steric hindrance effects in aqueous alkanolamines for CO2 capture from first principles. _J. Environ. Chem. Eng._ 10, 108987
(2022). Article CAS Google Scholar * Boettcher, S. W. & Surendranath, Y. Heterogeneous electrocatalysis goes chemical. _Nat. Catal._ 4, 4–5 (2021). Article CAS Google Scholar *
Nitopi, S. et al. Progress and perspectives of electrochemical CO2 reduction on copper in aqueous electrolyte. _Chem. Rev._ 119, 7610–7672 (2019). Article CAS PubMed Google Scholar *
Figueiredo, M. C., Ledezma-Yanez, I. & Koper, M. T. M. In situ spectroscopic study of CO2 electroreduction at copper electrodes in acetonitrile. _ACS Catal._ 6, 2382–2392 (2016). Article
CAS Google Scholar * Eneau-Innocent, B., Pasquier, D., Ropital, F., Léger, J. M. & Kokoh, K. B. Electroreduction of carbon dioxide at a lead electrode in propylene carbonate: a
spectroscopic study. _Appl Catal. B_ 98, 65–71 (2010). Article CAS Google Scholar * Deacon-Price, C., da Silva, A. H. M., Santana, C. S., Koper, M. T. M. & Garcia, A. C. Solvent
effect on electrochemical CO2 reduction reaction on nanostructured copper electrodes. _J. Phys. Chem. C._ 127, 14518–14527 (2023). Article CAS Google Scholar * Yang, Z., Oropeza, F. E.
& Zhang, K. H. L. P-block metal-based (Sn, In, Bi, Pb) electrocatalysts for selective reduction of CO2 to formate. _APL Mater._ 8, 060901 (2020). * Lv, W., Zhang, R., Gao, P., Gong, C.
& Lei, L. Electrochemical reduction of carbon dioxide with lead cathode and zinc anode in dry acetonitrile solution. _J. Solid State Electrochem._ 17, 2789–2794 (2013). Article CAS
Google Scholar * Trasatti, S. Work function, electronegativity, and electrochemical behaviour of metals. _J. Electroanal. Chem. Interfacial Electrochem._ 33, 351–378 (1971). Article CAS
Google Scholar * Christensen, P. A., Hamnett, A., Muir, A. V. G. & Freeman, N. A. CO2 reduction at platinum, gold and glassy carbon electrodes in acetonitrile. _J. Electroanal. Chem.
Interfacial Electrochem._ 288, 197–215 (1990). Article CAS Google Scholar * Richner, G. & Puxty, G. Assessing the chemical speciation during CO2 absorption by aqueous amines using in
situ FTIR. _Ind. Eng. Chem. Res._ 51, 14317–14324 (2012). Article CAS Google Scholar * Taccone, M. I. et al. Infrared action spectroscopy of the deprotonated formic acid trimer, trapped
in helium nanodroplets. _Phys. Chem. Chem. Phys._ 25, 10907–10916 (2023). Article CAS PubMed Google Scholar * Gomes, J. F. et al. Influence of silver on the glycerol electro-oxidation
over AuAg/C catalysts in alkaline medium: a cyclic voltammetry and in situ FTIR spectroscopy study. _Electrochim. Acta_ 144, 361–368 (2014). Article CAS Google Scholar * Zanone, A.,
Tavares, D. T. &de Paiva, J. L. An FTIR spectroscopic study and quantification of 2-amino-2-methyl-1-propanol, piperazine and absorbed carbon dioxide in concentrated aqueous
solutions._Vib. Spectrosc._ 99, 156–161 (2018). Article CAS Google Scholar * Sun, C. & Dutta, P. K. Infrared spectroscopic study of reaction of carbon dioxide with aqueous
monoethanolamine solutions. _Ind. Eng. Chem. Res._ 55, 6276–6283 (2016). Article CAS Google Scholar * Buvik, V., Vevelstad, S. J., Brakstad, O. G. & Knuutila, H. K. Stability of
structurally varied aqueous amines for CO2 capture. _Ind. Eng. Chem. Res._ 60, 5627–5638 (2021). Article CAS Google Scholar * Zhu, S., Li, T., Cai, W.-B. & Shao, M. CO2
electrochemical reduction as probed through infrared spectroscopy. _ACS Energy Lett._ 4, 682–689 (2019). Article CAS Google Scholar * Coskun, O. K. et al. Tailoring electrochemical CO2
reduction on copper by reactive ionic liquid and native hydrogen bond donors. _Angew. Chem. Int. Ed._ https://doi.org/10.1002/anie.202312163 (2023). * Jakobsen, J. B., Rønne, M. H.,
Daasbjerg, K. & Skrydstrup, T. Are amines the holy grail for facilitating CO2 reduction? _Angew. Chem. Int. Ed._ 60, 9174–9179 (2021). Article CAS Google Scholar * Gao, G. et al. New
insights into the structure-activity relationship for CO2 capture by tertiary amines from the experimental and quantum chemical calculation perspectives. _Chem. Eng. J._ 473, 145277 (2023).
Article CAS Google Scholar * Savéant, J. Proton relays in molecular catalysis of electrochemical reactions: origin and limitations of the boosting effect. _Angew. Chem. Int. Ed._ 58,
2125–2128 (2019). Article Google Scholar * Kortlever, R., Shen, J., Schouten, K. J. P., Calle-Vallejo, F. & Koper, M. T. M. Catalysts and reaction pathways for the electrochemical
reduction of carbon dioxide. _J. Phys. Chem. Lett._ 6, 4073–4082 (2015). Article CAS PubMed Google Scholar * Calle‐Vallejo, F. & Koper, M. T. M. Theoretical considerations on the
electroreduction of CO to C2 species on Cu(100) electrodes. _Angew. Chem. Int. Ed._ 52, 7282–7285 (2013). Article Google Scholar * Todorova, T. K., Schreiber, M. W. & Fontecave, M.
Mechanistic understanding of CO2 reduction reaction (CO2RR) toward multicarbon products by heterogeneous copper-based catalysts. _ACS Catal._ 10, 1754–1768 (2020). Article CAS Google
Scholar * Gütz, C. et al. Leaded bronze: an innovative lead substitute for cathodic electrosynthesis. _ChemElectroChem_ 5, 247–252 (2018). Article Google Scholar * Nam, D. H. et al.
Molecular enhancement of heterogeneous CO2 reduction. _Nat. Mater._ 19, 266–276 (2020). Article ADS CAS PubMed Google Scholar * Ali, T. et al. Electro‐synthesis of organic compounds
with heterogeneous catalysis. _Adv. Sci._ 10, 2205077 (2023). Article CAS Google Scholar * Lei, Y. et al. Recent advances on electrocatalytic CO2 reduction to resources: target products,
reaction pathways and typical catalysts. _Chem. Eng. J._ 453, 139663 (2023). Article ADS CAS Google Scholar * Bagger, A., Arnarson, L., Hansen, M. H., Spohr, E. & Rossmeisl, J.
Electrochemical CO reduction: a property of the electrochemical interface. _J. Am. Chem. Soc._ 141, 1506–1514 (2019). Article CAS PubMed Google Scholar * Martins-Costa, M. T. C. &
Ruiz-López, M. F. Reactivity of monoethanolamine at the air–water interface and implications for CO2 capture. _J. Phys. Chem. B_ 128, 1289–1297 (2024). Article CAS PubMed Google Scholar
* Snuffin, L. L., Whaley, L. W. & Yu, L. Catalytic electrochemical reduction of CO2 in ionic liquid EMIMBF3Cl. _J. Electrochem Soc._ 158, F155 (2011). Article CAS Google Scholar *
Pele, L., Šebek, J., Potma, E. O. & Benny Gerber, R. Raman and IR spectra of butane: anharmonic calculations and interpretation of room temperature spectra. _Chem. Phys. Lett._ 515, 7–12
(2011). Article ADS CAS Google Scholar * Bezverkhyy, I., Bouguessa, K., Geantet, C. & Vrinat, M. Adsorption of tetrahydrothiophene on faujasite type zeolites: breakthrough curves
and FTIR spectroscopy study. _Appl Catal. B_ 62, 299–305 (2006). Article CAS Google Scholar * Ugata, Y. et al. Understanding the reductive decomposition of highly concentrated Li
salt/sulfolane electrolytes during Li deposition and dissolution. _ACS Appl. Energy Mater._ 4, 1851–1859 (2021). Article CAS Google Scholar * Yu, L., Khan, M. F. & Achari, G. A review
on physiochemical treatment of sulfolane in aqueous media. _J. Environ. Chem. Eng._ 9, 105691 (2021). Article CAS Google Scholar * García, G., Rodríguez, P., Rosca, V. & Koper, M. T.
M. Fourier transform infrared spectroscopy study of CO electro-oxidation on Pt(111) in alkaline media. _Langmuir_ 25, 13661–13666 (2009). Article PubMed Google Scholar * Jiang, B. et al.
Insights into the impact of the nafion membrane pretreatment process on vanadium flow battery performance. _ACS Appl. Mater. Interfaces_ 8, 12228–12238 (2016). Article CAS PubMed Google
Scholar * Kuwertz, R., Kirstein, C., Turek, T. & Kunz, U. Influence of acid pretreatment on ionic conductivity of Nafion® membranes. _J. Memb. Sci._ 500, 225–235 (2016). Article CAS
Google Scholar Download references ACKNOWLEDGEMENTS D.F.B. and A.C.G. gratefully acknowledge the Dutch Research Council (NWO) for providing financial support for project number
ECCM.TT.MVITU.005 which are carried out in the framework of the Electrochemical Conversion and Materials (ECCM) program. AUTHOR INFORMATION AUTHORS AND AFFILIATIONS * Van’t Hoff Institute
for Molecular Sciences, University of Amsterdam, Science Park 904, Amsterdam, The Netherlands D. F. Bruggeman, G. Rothenberg & A. C. Garcia Authors * D. F. Bruggeman View author
publications You can also search for this author inPubMed Google Scholar * G. Rothenberg View author publications You can also search for this author inPubMed Google Scholar * A. C. Garcia
View author publications You can also search for this author inPubMed Google Scholar CONTRIBUTIONS D.F.B. contributed to all experimental works, data analysis, manuscript preparation and
conceived of the presented idea. G.R. contributed to manuscript preparation. A.C.G. contributed to FTIR measurements, manuscript preparation, conceived the project and supervision and
discussion of the project. CORRESPONDING AUTHOR Correspondence to A. C. Garcia. ETHICS DECLARATIONS COMPETING INTERESTS The authors declare no competing interests. PEER REVIEW PEER REVIEW
INFORMATION _Nature Communications_ thanks Meng Lin, and the other, anonymous, reviewer(s) for their contribution to the peer review of this work. A peer review file is available. ADDITIONAL
INFORMATION PUBLISHER’S NOTE Springer Nature remains neutral with regard to jurisdictional claims in published maps and institutional affiliations. SUPPLEMENTARY INFORMATION SUPPLEMENTARY
INFORMATION TRANSPARENT PEER REVIEW FILE SOURCE DATA SOURCE DATA RIGHTS AND PERMISSIONS OPEN ACCESS This article is licensed under a Creative Commons Attribution-NonCommercial-NoDerivatives
4.0 International License, which permits any non-commercial use, sharing, distribution and reproduction in any medium or format, as long as you give appropriate credit to the original
author(s) and the source, provide a link to the Creative Commons licence, and indicate if you modified the licensed material. You do not have permission under this licence to share adapted
material derived from this article or parts of it. The images or other third party material in this article are included in the article’s Creative Commons licence, unless indicated otherwise
in a credit line to the material. If material is not included in the article’s Creative Commons licence and your intended use is not permitted by statutory regulation or exceeds the
permitted use, you will need to obtain permission directly from the copyright holder. To view a copy of this licence, visit http://creativecommons.org/licenses/by-nc-nd/4.0/. Reprints and
permissions ABOUT THIS ARTICLE CITE THIS ARTICLE Bruggeman, D.F., Rothenberg, G. & Garcia, A.C. Investigating proton shuttling and electrochemical mechanisms of amines in integrated CO2
capture and utilization. _Nat Commun_ 15, 9207 (2024). https://doi.org/10.1038/s41467-024-53543-4 Download citation * Received: 05 December 2023 * Accepted: 08 October 2024 * Published: 24
October 2024 * DOI: https://doi.org/10.1038/s41467-024-53543-4 SHARE THIS ARTICLE Anyone you share the following link with will be able to read this content: Get shareable link Sorry, a
shareable link is not currently available for this article. Copy to clipboard Provided by the Springer Nature SharedIt content-sharing initiative