- Select a language for the TTS:
- UK English Female
- UK English Male
- US English Female
- US English Male
- Australian Female
- Australian Male
- Language selected: (auto detect) - EN
Play all audios:
ABSTRACT Inactivating mutations in _SMARCB1_ confer an oncogenic dependency on EZH2 in atypical teratoid rhabdoid tumors (ATRTs), but the underlying mechanism has not been fully elucidated.
We found that the sensitivity of ATRTs to EZH2 inhibition (EZH2i) is associated with the viral mimicry response. Unlike other epigenetic therapies targeting transcriptional repressors,
EZH2i-induced viral mimicry is not triggered by cryptic transcription of endogenous retroelements, but rather mediated by increased expression of genes enriched for intronic inverted-repeat
Alu (IR-Alu) elements. Interestingly, interferon-stimulated genes (ISGs) are highly enriched for dsRNA-forming intronic IR-Alu elements, suggesting a feedforward loop whereby these activated
ISGs may reinforce dsRNA formation and viral mimicry. EZH2i also upregulates the expression of full-length LINE-1s, leading to genomic instability and cGAS/STING signaling in a process
dependent on reverse transcriptase activity. Co-depletion of dsRNA sensing and cytoplasmic DNA sensing completely rescues the viral mimicry response to EZH2i in SMARCB1-deficient tumors.
SIMILAR CONTENT BEING VIEWED BY OTHERS SMARCB1 DELETION IN ATYPICAL TERATOID RHABDOID TUMORS RESULTS IN HUMAN ENDOGENOUS RETROVIRUS K (HML-2) EXPRESSION Article Open access 18 June 2021
THERAPEUTIC TARGETING THE ONCOGENIC DRIVER EWSR1::FLI1 IN EWING SARCOMA THROUGH INHIBITION OF THE FACT COMPLEX Article 10 November 2022 HUMAN _SNF5_ ARMING OF DOUBLE-DELETED VACCINIA VIRUS
SHOWS ONCOLYTIC AND CYTOSTATIC ACTIVITY AGAINST CENTRAL NERVOUS SYSTEM ATYPICAL TERATOID/RHABDOID TUMOR CELLS Article 17 July 2020 INTRODUCTION The SWI/SNF chromatin remodeling complexes are
important tumor suppressors with multiple subunits of SWI/SNF chromatin remodeling complexes inactivated by mutations in 20% of all cancers1. Specifically, almost all malignant rhabdoid
tumors (MRTs) and ATRTs, which are highly aggressive childhood cancers without effective therapy, contain biallelic inactivating mutations in the SMARCB1 (SNF5, INI1, BAF47) subunit2,3. The
loss of SMARCB1 results in aberrant nucleosomal positioning by the SWI/SNF complex and elevated expression of EZH24,5. EZH2 is the catalytic subunit of the Polycomb repressive complex 2
(PRC2), a complex that maintains gene repression by depositing the epigenetic silencing mark histone 3 lysine 27 trimethylation (H3K27me3) on chromatin6. Extensive studies have revealed that
EZH2 is overexpressed in various malignancies7,8,9,10,11 and acquires gain-of-function mutations in subtypes of lymphomas12,13,14, highlighting an oncogenic role for EZH2 in cancer
progression. Targeting EZH2 in cancers with activating EZH2 mutations or overexpression of EZH2 diminishes tumor growth, shown in preclinical studies15,16,17. Of note, many studies have
uncovered a shared dependency of cancers with mutant SWI/SNF subunits on EZH2 activity4,5,18,19,20. Since almost all ATRTs are characterized by biallelic mutations of _SMARCB1_, these tumors
may develop dependency on EZH2 that can be targeted pharmacologically through a synthetic lethality approach17,21. Clinical trials assessing EZH2i for the treatment of malignancies
including ATRTs and MRTs are currently underway, with early signs of therapeutic benefits22,23,24. Therefore, understanding the mechanisms underlying the biological effects of EZH2i on
SMARCB1-deficient tumors is crucial to developing therapeutic strategies that employ EZH2i. More recently, the anti-tumor effects of EZH2i have been implicated in activating retroelements
and viral mimicry, a cellular state characterized by loss of cancer cell fitness and the induction of innate and adaptive immune response, as well as interferon signaling25,26,27. However,
the molecular mechanisms underlying how EZH2i initiates viral mimicry in ATRTs remains elusive. Here we profile the transcriptomic and epigenomic changes induced by EZH2i and identify that a
major mechanism underlying the vulnerability of ATRT cells to EZH2i is the delayed activation of viral mimicry. Mechanistically, EZH2i induces the expression of genes enriched for intronic
or 3′UTR IR-Alu elements, which triggers dsRNA formation and the MAVS-mediated dsRNA sensing pathway. Importantly, we identify a potential feedforward loop wherein many EZH2i-induced ISGs
contain active IR-Alu elements, which may reinforce the viral mimicry response. Additionally, we demonstrate that EZH2i induces cytoplasmic ssDNA genome instability and micronuclei formation
via LINE-1-mediated reverse transcription, thereby activating the cytosolic DNA sensing pathway. Thus, we found a unique vulnerability in genetically defined, SMARCB1-deficient tumors that
is dependent on EZH2i-stimulated viral mimicry mediated by both cytosolic RNA and DNA sensing pathways. RESULTS EZH2I INDUCES DELAYED ACTIVATION OF INTERFERON SIGNALING IN ATRT CELLS To
investigate the vulnerability of ATRT cells to EZH2i, we used UNC1999, an orally bioavailable chemical probe that inhibits the methyltransferase activity of EZH228. A close chemical analog
of UNC1999 is UNC2400, with the difference being that UNC2400 is unable to inhibit EZH2. Thus, UNC2400 was used as a negative control for any potential off-target effects of UNC1999
treatment28. As expected, UNC1999 treatment led to complete depletion of H3K27me3 levels without affecting the protein levels of EZH2 in four ATRT cell lines (BT12, BT16, CHLA02, and CHLA05)
(Supplementary Fig. 1a). In contrast, UNC2400 treatment did not result in a significant reduction in either EZH2 or H3K27me3 levels. We next examined the growth potential of the four ATRT
cell lines in response to UNC1999 treatment. We found that UNC1999 greatly inhibited the growth of all four ATRT cell lines in comparison to UNC2400 or DMSO, where DMSO was used as the
vehicle control (Supplementary Fig. 1b). Next, we applied the CellTrace Violet (CTV) cell proliferation assay to examine the effects of UNC1999 on ATRT cell proliferation. Our analysis
showed a minor decline in cell proliferation at day 3 post UNC1999 treatment in BT12 cells, while a greater reduction was observed at day 7 (Supplementary Fig. 1c). Furthermore, we found
that the anti-proliferative effect of UNC1999 was dose-dependent and consistent across all ATRT cell lines tested. Our data together demonstrate that EZH2i leads to a time- and
dose-dependent reduction in ATRT cell proliferation. To assess the impact of EZH2i on cell viability in ATRT cells, we conducted Annexin V and propidium iodide (PI) labeling, followed by
flow cytometry. Analysis of apoptosis in CHLA02 cells revealed a dose-dependent increase in apoptotic fractions (Annexin V-positive) following UNC1999 treatment, concomitant with a decrease
in the percentage of viable cells (Annexin V and PI-negative) (Supplementary Fig. 1d–f). Moreover, this effect on cell death induction by UNC1999 was consistently observed across all tested
ATRT cell lines (Supplementary Fig. 1e, f). In summary, our analyses of cell proliferation and apoptosis collectively suggest that impaired cell proliferation and increased cell death
contribute to the growth inhibitory effects of EZH2 inhibition in ATRT cells. To understand the mechanisms underlying the high sensitivity of ATRT cells to UNC1999 treatment, we performed
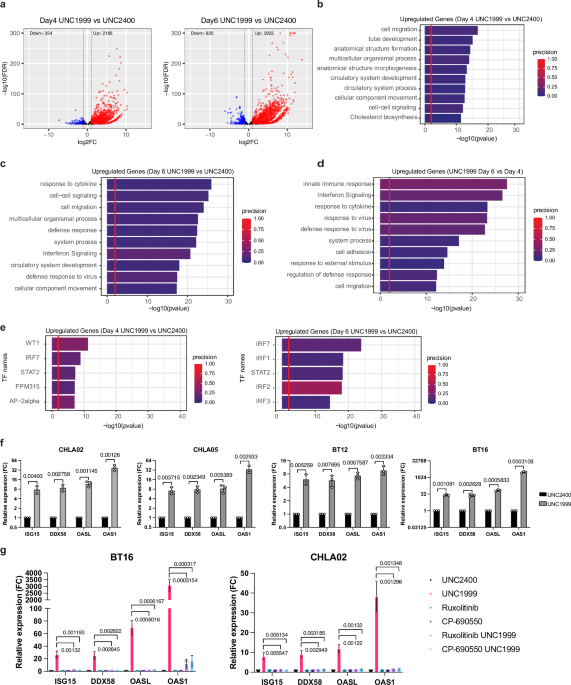
RNA-sequencing (RNA-seq) on BT16 cells treated with UNC1999 or UNC2400 at day 4 and day 6. Differential expression analysis revealed that at both timepoints, UNC1999 treatment resulted in a
greater number of upregulated genes than downregulated genes compared to UNC2400 treated controls (Fig. 1a). We performed pathway analysis on the upregulated genes following UNC1999
treatment at both timepoints. At day 4, we observed that pathways related to cell migration and differentiation were significantly enriched (Fig. 1b). Intriguingly, at day 6, the most
enriched pathways were associated with cytokine response and interferon signaling, indicating the activation of a viral mimicry state29 (Fig. 1c). We also found a higher number of
upregulated genes at day 6 versus day 4 following UNC1999 treatment (Supplementary Fig. 2a). Notably, the top two significantly enriched pathways in UNC1999-treated cells at day 6 were the
innate immune response and interferon signaling (Fig. 1d). These findings together suggest that interferon signaling pathway is activated as a delayed response following UNC1999 treatment.
Based on the increased expression of their target genes, we predicted the transcription factors (TFs) involved in the upregulated genes induced by UNC1999. We observed an enrichment of the
target genes of multiple interferon regulatory factors (IRFs) and STAT2, key TFs in the interferon signaling pathway, in cells treated with UNC1999 at day 6 (Fig. 1e and Supplementary Fig.
2b). These data also suggest a delayed and predominant activation of interferon signaling triggered by EZH2i. To validate that EZH2i induces interferon signaling in ATRT cells, we examined
the expression of interferon-stimulated genes (ISGs) via real-time qPCR following UNC1999 treatment. We found that in all four tested ATRT cell lines, the gene expression of four selected
ISGs (_ISG15, DDX58, OASL_, and _OAS1_) was significantly upregulated in the UNC1999-treated samples compared to the UNC2400 controls (Fig. 1f). We then treated BT16 cells with lower doses
of UNC1999 (1 μM or 2.5 μM) for 18 days and assessed ISG expression every 6 days. We observed a significant dose-dependent increase in ISG expression at day 6, with a more pronounced
induction at day 12 and persisting until day 18 (Supplementary Fig. 2j). We also tested the effect of GSK34330, another selective inhibitor of EZH2, on ISG activation. We observed that
GSK343 induced ISG expression to similar levels compared to UNC1999 (Supplementary Fig. 2c). We also examined the effects of EZH2i on the expression of multiple interferon (IFN) genes. Our
analysis revealed that treatment with either UNC1999 or GSK343 significantly upregulated the expression of the type I IFN gene IFNB1, as well as the type III IFN genes IFNL1 and IFNL3
(Supplementary Fig. 2d). We then extended our investigation to include two additional clinically relevant inhibitors: Valemetostat (DS-3201, an EZH1/2 inhibitor) and Tazemetostat (EPZ6438,
an EZH2 inhibitor). Notably, both inhibitors demonstrated a significant induction of ISGs at both day 6 and day 12 following treatment (Supplementary Fig. 2e, f). Furthermore, we conducted
EZH2 knockout experiments in BT16 and found that EZH2 deficiency induced significant growth inhibition and ISG activation (Supplementary Fig. 2g–i). Collectively, these data from both
pharmacological and genetic inhibition approaches demonstrate that EZH2 inhibition triggers viral mimicry in ATRT cancer cells. Finally, to examine whether the ISG activation is mediated
through the JAK/STAT pathway, cells were treated with UNC1999 in the presence or absence of Ruxolitinib (JAK1/JAK2 inhibitor)31 or CP-690550 (JAK1/JAK2/JAK3 inhibitor)32. Both Ruxolitinib
and CP-690550 abolished the activation of ISGs in ATRT cells following UNC1999 treatment (Fig. 1g), demonstrating that the induction of ISGs is JAK-dependent. Together, our data illustrate
that EZH2i induces delayed activation of interferon signaling in ATRT cells, and the expression of ISGs is mediated by the JAK/STAT pathway. EZH2I TRIGGERS RNA SENSING PATHWAY THROUGH
DEREPRESSING IR-ALU ELEMENTS Next, we investigated whether EZH2i triggers interferon signaling by activating the dsRNA sensing pathway and inducing viral mimicry. The recognition of
cytosolic dsRNA by pattern recognition receptors RIG-I/MDA5 initiates viral mimicry responses, including the upregulation of IFNs and downstream ISGs33. To test if UNC1999 induces interferon
signaling through the dsRNA sensing pathway, we performed immunostaining with a monoclonal antibody against dsRNA to detect the expression of dsRNA34. Our analysis revealed a significant
increase in dsRNA in ATRT cells following UNC1999 treatment (Fig. 2a, b). Upon dsRNA expression, the RIG-I/MDA5 receptors detect its presence and bind to the mitochondrial protein MAVS. This
binding triggers signal transduction that subsequently activates downstream IRFs, resulting in the induction of IFN expression33. Importantly, the functional activation of MAVS is dependent
on the formation of large MAVS prion-like aggregates35. To investigate whether UNC1999 treatment activates interferon signaling through MAVS, we isolated the mitochondrial fraction of ATRT
cells treated with UNC1999 or UNC2400. Then, we employed semi-denaturing detergent agarose gel electrophoresis (SDD-AGE) to detect MAVS aggregates. We identified a smear of SDS-resistant
high molecular weight MAVS aggregates in BT16 and CHLA02 cells treated with UNC1999, but not in the UNC2400 controls (Fig. 2c). This indicates the functional activation of MAVS by UNC1999
treatment. To further investigate whether the MAVS-mediated RNA sensing pathway activates interferon signaling, we inactivated MAVS in BT16 cells via CRISPR-Cas9. MAVS-deficient cells
exhibited a significant reduction in ISG induction upon UNC1999 treatment compared to the MAVS-wildtype cell line (Fig. 2d). These results suggest that the viral mimicry induced by EZH2i is
partially dependent on the MAVS-mediated RNA sensing pathway. Next, we sought to identify the retroelements that could be the sources of immunogenic dsRNA following EZH2i. Differential
analysis of repeat expression from RNA-seq data revealed that a large number of retroelements gained expression at day 4 and day 6 following UNC1999 treatment (Supplementary Fig. 3a). We
further examined whether any repeat classes were over-represented among the upregulated repeats and found that SINE elements were enriched as the most significantly upregulated repeats at
both timepoints (Fig. 2e). In addition, we examined the changes in the expression of major repeat families following UNC1999 treatment. Alu retroelements, the largest repeat family among the
upregulated repeats, were significantly enriched at both day 4 and day 6 following UNC1999 treatment (Supplementary Fig. 3b, c). Our findings are consistent with a prior study identifying
IR-Alu elements as the primary source of drug-induced immunogenic dsRNA36. IR-Alu elements can form dsRNA stem-loops via intramolecular pairing36. Therefore, we examined the expression
dynamics of all annotated IR-Alu elements upon EZH2i. At both day 4 and day 6, a higher number of IR-Alu repeats exhibited increased expression levels following UNC1999 treatment, as
compared to the UNC2400 control (Fig. 2f). We then examined the changes in expression of each of the two repeats within the IR-Alu pairs, as active transcription of both repeats is required
for dsRNA formation. Following the UNC1999 treatment, 532 and 1094 IR pairs exhibited increased expression in both repeats at day 4 and day 6, respectively (Fig. 2g). We identified these
IR-Alu pairs upregulated in both repeats as UNC1999-induced IRs, which can potentially make dsRNA. Notably, some of these IR-Alu pairs have been experimentally validated as immunogenic given
their capacity to produce dsRNA that activates MDA536 (Fig. 2g). Moreover, these experimentally validated IRs were statistically overrepresented in the upregulated annotated IR pairs
following UNC1999 treatment (Fig. 2g). We immunoprecipitated dsRNA from total RNA in BT16 cells using the J2 antibody and examined the enrichment of Alu elements in dsRNA. qRT-PCR analysis
targeting Alu consensus sequences revealed significantly higher Alu enrichment in the dsRNA of UNC1999-treated cells (Supplementary Fig. 3d). Additionally, using primers designed for
experimentally validated immunogenic IR-Alus upregulated upon EZH2 inhibition, we observed higher enrichment in dsRNA from UNC1999-treated cells compared to UNC2400 (Fig. 2h). Similar
results were obtained with primers targeting representative upregulated annotated IR-Alu pairs (Fig. 2i). These findings collectively suggest that IR-Alus induced by EZH2 inhibition can form
dsRNA, potentially activating the dsRNA sensing pathway. To investigate whether EZH2 directly targets the UNC1999-induced IR pairs, we conducted genome-wide CUT&RUN (cleavage under
targets and release using nuclease) analysis37. As expected, we observed a global depletion of the H3K27me3 signal in cells treated with UNC1999 at both day 4 and day 6 (Supplementary Fig.
3e). Specifically, our analysis showed a robust deposition of H3K27me3 at upstream regions of these IRs in the UNC2400 control, which was depleted upon UNC1999 treatment (Supplementary Fig.
3f). In addition, the H3K27me3 depletion was accompanied by an increase in the transcription levels of both the IR pairs and the regions surrounding IRs (Supplementary Fig. 3g). Together,
these findings suggest that EZH2 directly targets the UNC1999-induced IR pairs. EZH2I UPREGULATES INTRONIC TRANSCRIPTION THAT EXPRESSES IR-ALU ELEMENTS Next, we investigated the mechanism by
which UNC1999 induces the expression of IR-Alu elements. The majority of UNC1999-induced IR-Alu elements originated from introns (65.8% at day 4 and 72.9% at day 6), followed by intergenic
regions (18.3% at day 4 and 15.7% at day 6), and 3′ UTR (13.3% at day 4 and 8.57% at day 6) (Fig. 3a). We observed a significant enrichment of intronic and 3′ UTR IR-Alu elements, while
intergenic IR-Alu repeats were under-represented in the upregulated IR-Alu repeats at both day 4 and day 6 following UNC1999 treatment, as compared to the expected genomic distribution (Fig.
3a). This can be explained by the H3K27me3 distribution analysis, indicating a larger fraction of baseline H3K27me3 peaks overlapping with intronic regions in the UNC2400-treated conditions
(Supplementary Fig. 3h). Out of the 617 UNC1999-induced IR-Alu elements at day 4, 298 (48%) of them continued to be upregulated at day 6 (Supplementary Fig. 4a). In addition, we found that
962 (76%) annotated IR-Alu elements were induced only at day 6 following UNC1999 treatment. We further examined the transcription direction (i.e., sense vs. anti-sense) of UNC1999-induced
intronic and 3′ UTR IRs relative to their associated genes. Our analysis revealed that most IRs were transcribed in sense with their overlapping genes (Fig. 3b and Supplementary Fig. 4b).
These findings suggest a strong correlation between the transcription of UNC1999-induced IR-Alu elements and the activation of their associated genes. We hypothesized that EZH2i triggers
excessive transcription of the IR-Alu-associated genes, which ultimately leads to the intronic transcription of IR-Alu elements. To test this hypothesis, we examined the expression dynamics
and H3K27me3 signals of genes overlapping with upregulated intronic IRs, as well as the changes in the expression of introns within these genes following UNC1999 treatment. H3K27me3
depletion was detected at the promoters and gene bodies of the genes overlapping with upregulated intronic IRs following UNC1999 treatment, accompanied by an increase in transcription levels
at both day 4 and day 6 (Fig. 3c and Supplementary Fig. 4c). In addition, we identified a negative correlation between changes in H3K27me3 signal and alterations in both gene expression and
H3K4me3 signal at promoters of genes containing upregulated IR-Alu pairs (Supplementary Fig. 4d). Additionally, we observed a positive association between the dynamics of H3K4me3 signal at
promoters and the expression change in these genes (Supplementary Fig. 4d). These data demonstrate that EZH2i induces upregulation of the genes associated with UNC1999-induced intronic IRs.
Notably, a significant increase in RNA-seq signal was found in the introns of genes containing the upregulated intronic IRs (Fig. 3d). Moreover, we observed a strong positive correlation in
the expression changes between genes and their overlapping intragenic IR pairs following UNC1999 treatment (Fig. 3e). Together, these results indicate that EZH2i depletes H3K27me3 deposition
at the promoters and gene bodies of IR-Alu associated genes, resulting in the accumulation of H3K4me3 at promoters and the transcriptional upregulation of these genes, as well as their
intronic or 3′ UTR IR-Alu elements (Fig. 3h). We further characterized the genes associated with UNC1999-induced intronic and 3′ UTR IRs. Analysis of these genes indicated that 62 were
shared between the two timepoints, 46 were exclusively observed at day 4, and 145 were solely detected at day 6 (Supplementary Fig. 4a). Notably, we found that many genes associated with
induced IRs were upregulated at both day 4 and day 6 following UNC1999 treatment (Supplementary Fig. 4e). The upregulated differentially expressed genes (DEGs) with induced IRs were also
overrepresented among the total upregulated DEGs at day 4 and day 6 (Supplementary Fig. 4e). Pathway analysis of the upregulated genes associated with UNC1999-induced IRs uncovered that at
day 4, the most enriched pathways were involved in metabolism or biosynthesis processes (Supplementary Fig. 4f). In contrast, at day 6, the most enriched pathways included viral defense
response, interferon signaling, and innate immune response (Fig. 3f and Supplementary Fig. 4g). Additionally, intersecting genes co-induced with IR-Alus at day 4 and day 6 with the combined
set of ISGs and IFN pathway genes revealed a notable and statistically significant overrepresentation at day 6 (Supplementary Fig. 4h), providing additional evidence that the upregulated
genes associated with UNC1999-induced IR-Alus are enriched for ISGs. These findings suggest that certain ISGs associated with viral mimicry contain IR-Alu elements in their introns or 3′
UTRs. These intragenic IR-Alu elements can themselves be a source of dsRNA, which in turn reinforces the viral mimicry response, thus forming a positive feedback loop (Fig. 3g, Supplementary
Fig. 4i, j, k). Multiple genes, including DDX58, HERC6, and GBP4, were found to have active intronic or 3′ UTR IR-Alu elements and exhibited increased transcription and chromatin
remodeling, including depletion of H3K27me3 and accumulation of H3K4me3 at promoters (Fig. 3g and Supplementary Fig. 4i, j). For instance, _DDX58_, an ISG with multiple IR-Alu elements
located in its introns, showed increased gene expression and IR-Alu expression at day 6 following UNC1999 treatment (Fig. 3g), which can potentially reinforce dsRNA expression and enhance
dsRNA-induced viral mimicry. Next, we extended our investigation to include an RNA-seq dataset comprising primary brain tumors, covering both SMARCB1-wildtype brain tumors and
SMARCB1-deficient ATRTs. Despite a low tumor mutational burden, rhabdoid tumors including ATRTs demonstrate significant immune infiltration38. The heightened immunogenicity observed in
rhabdoid tumors implies a potential elevation in the baseline expression of retroelements, which may prime these tumors for viral mimicry induction. Indeed, differential expression analysis
revealed that ATRTs exhibit higher expression of retroelements, particularly Alu elements, compared to SMARCB1-wildtype brain tumors (Supplementary Fig. 5a, b). Further scrutiny of annotated
IR-Alu elements known to form dsRNA36, revealed a significantly greater number of these repeats with increased expression in ATRTs (Supplementary Fig. 5c, d). A significant proportion of
these repeats exhibited upregulation on both strands (Supplementary Fig. 5e), suggesting potential dsRNA formation. Additionally, the total expression of IR-Alu repeats was computed,
demonstrating an overall increased expression in ATRTs compared to SMARCB1-wildtype brain tumors (Supplementary Fig. 5f). To strengthen our findings, we re-analyzed published RNA-seq data in
a rhabdoid tumors cell line (I2A) with inducible SMARCB1 re-expression38. Analysis of annotated IR-Alu repeats revealed increased transcription of these elements in the SMARCB1-deficient
condition (Supplementary Fig. 5g–j). These findings suggest a baseline activation of viral mimicry by expressed IR-Alu pairs in the SMARCB1-deficient condition. Notably, the ISG score,
computed using the mean expression levels of the 38 ISGs defined by Liu et al.39, showed a significant increase in ISG expression in the SMARCB1-deficient condition (Supplementary Fig. 5k).
Collectively, our findings from both the primary brain tumor cohort and the I2A cell line suggest that the SMARCB1 deficiency may prime ATRTs for the induction of viral mimicry, a response
that can be further enhanced upon EZH2 inhibition. EZH2I ACTIVATES THE CGAS-STING DNA SENSING PATHWAY The partial rescue of ISG induction in MAVS-deficient cells (Fig. 2d) suggests that the
activation of the interferon signaling is not solely mediated by the MAVS-mediated RNA sensing pathway. Other pathways, such as the cytosolic DNA-sensing cGAS-STING pathway, may also
contribute to the induction of viral mimicry and interferon signaling40. Previous studies have demonstrated the DNA sensing pathway as a mechanistic link between DNA damage and immune
responses41,42,43. Since EZH2i has been associated with increased genome instability44,45,46,47,48, we hypothesized that UNC1999 could induce DNA damage and trigger the DNA sensing pathway.
To examine if EZH2i induces DNA damage in ATRT cells, we measured the nuclear foci of γH2A.X, a biomarker of cellular response to DNA double-strand breaks (DSB). The number of γH2A.X foci
per cell was found to be higher in cells treated with UNC1999 compared to the UNC2400 control (Fig. 4a, b). In addition, we performed western blot and found that UNC1999 treatment increased
the protein level of γH2A.X (Fig. 4e). These results suggest that EZH2i triggers DNA damage in ATRT cells. We further assessed micronuclei using confocal microscopy and found that their
formation was elevated in cells treated with UNC1999 (Fig. 4a, c). This suggests that EZH2i leads to the increased micronuclei formation, which could arise from DNA damage42. Micronuclei are
susceptible to nuclear envelope collapse, which exposes genomic dsDNA to cytosolic DNA sensor cGAS, initiating a cGAS–STING-dependent immune response through the production of the second
messenger cGAMP49. In line with this, in UNC1999-treated cells, micronuclei with γH2A.X staining were often cGAS-positive (Fig. 4a). Furthermore, we observed a higher fraction of
cGAS-positive micronuclei formation in UNC1999-treated cells (Fig. 4d). We also found that cGAS-positive micronuclei were often co-localized with cytoplasmic dsDNA staining (Supplementary
Fig. 6a), which is consistent with previous studies42,43. The protein levels of cGAS, IRF7, and phosphorylated-STAT1 (pSTAT1) increased in UNC1999-treated cells (Fig. 4e), suggesting that
EZH2i activates the cGAS–STING-dependent DNA sensing pathway. To further assess the dependency of viral mimicry induction on cGAS–STING pathway, we treated BT16 cells with UNC1999 in the
presence or absence of H-151, a STING inhibitor50. We first established the efficacy of H-151 in BT16 cells by confirming the suppression of phosphorylated-STING (p-STING) and downstream
effectors upon cGAMP transfection (Supplementary Fig. 6b). We then observed that the presence of H-151 significantly rescued the effect of UNC1999 on ISG induction (Fig. 4f), suggesting that
STING activation is crucial to ISG induction. To further validate this, we knocked out cGAS via CRISPR-Cas9 and found that it effectively rescued the effect of UNC1999 on ISG induction
(Fig. 4g and Supplementary Fig. 6c). Notably, the double knockout of cGAS and MAVS abolished the ISG induction by UNC1999 treatment (Fig. 4g). Thus, the viral mimicry response activated by
EZH2i is dependent on both the MAVS-mediated RNA sensing pathway and the cGAS-mediated DNA sensing pathway (Fig. 4h). EZH2I INDUCES GENOME INSTABILITY THROUGH L1-MEDIATED REVERSE
TRANSCRIPTION Next, we sought to investigate the mechanism underlying the genome instability induced by EZH2i. Retrotransposition mediated by long interspersed element-1 (LINE-1 or L1) and
Alu elements has been implicated in the generation of insertional mutations and post-insertion-based structural rearrangements51,52,53,54. The ORF2 of L1 retrotransposons encodes enzymatic
machinery including endonuclease and reverse transcriptase, which mediates the reverse transcriptionof both autonomous and non-autonomous elements55. Our RNA-seq analysis of repeat
expression revealed that 62 full-length L1s (at least 6 kb in length) with increased transcription were significantly enriched among the total upregulated L1s at day 4 post UNC1999 treatment
(Supplementary Fig. 7a, b). Of these, 42 L1s remained upregulated at day 6. These upregulated full-length L1s, annotated as the L1p family, showed a broad increase in transcription level
from the 5′UTR to the 3′UTR (Supplementary Fig. 7c, d). In addition, we observed that the increased expression of L1s was accompanied by an increase in H3K4me3 and a depletion of H3K27me3
(Supplementary Fig. 7d, e). Specifically, a subset of upregulated full-length L1s exhibited H3K4me3 enrichment at their promoter regions, indicating active transcription following UNC1999
treatment (Supplementary Fig. 7f). Furthermore, both western blotting and immunostaining revealed an upregulation in the expression of L1 ORF1p under UNC1999-treated conditions
(Supplementary Fig. 7g, h). Notably, UNC1999 treatment led to a depletion of H3K27me3 staining in nearly all cells, with the majority displaying increased expression of both STING and L1
ORF1p (Fig. 5a, b). These results collectively confirm that a specific subset of derepressed full-length L1s, triggered by EZH2 inhibition, undergo active expression. This subset may
potentially serve as a crucial source of enzymatic machinery for L1-mediated reverse transcription and activate the DNA sensing pathway. To investigate further, we examined the levels of
single-stranded DNA (ssDNA) using an ssDNA-specific antibody following UNC1999 treatment. We found that UNC1999-treated cells exhibited a significantly higher number of ssDNA puncta per cell
than those treated with UNC2400 (Fig. 5d). To investigate whether the ssDNA contain L1 elements, we extracted ssDNA species as previously desbribed56, revealing a significant enrichment of
L1 sequences in the UNC1999-induced ssDNA (Fig. 5c). We further assessed the dependence of ssDNA induction on LINE-1 activity by generating LINE-1-deficient cells using sgRNAs targeting the
5′UTR or ORF1 of L1. A detailed bioinformatics analysis of the specific L1 loci targeted by gRNAs suggested that the gRNA sequences are conserved across multiple L1 families, including L1H,
L1PA2, and L1PA3, with a higher specificity for L1H (Supplementary Fig. 8a, b). We then demonstrated a significant decrease in LINE1 transcription and ORF1p protein levels following
CRISPR-mediated genome editing (Supplementary Fig. 8c–e). We found a significant attenuation in the induction of ssDNA species in the LINE-1-deficient cells upon EZH2 inhibition (Fig. 5d).
Consequently, we found that the activation of ISGs following EZH2 inhibition was significantly abolished with the inactivation of the LINE-1 elements (Fig. 5e). We next examined whether
increased levels of ssDNA arise due to L1-mediated reverse transcription through employing reverse-transcriptase (RT) inhibitors known to inhibit L1 reverse transcription57,58. The addition
of RT inhibitors attenuated the increase of ssDNA levels induced by UNC1999 treatment (Fig. 6a, b), indicating the formation of cytoplasmic ssDNA is dependent on L1-mediated reverse
transcription. We then performed γH2A.X immunostaining and western blot to measure DNA damage in the presence or absence of RT inhibitors. We found that RT inhibitors significantly rescued
the effect of UNC1999 on DNA damage (Fig. 6c, d, g). In addition, we observed that the higher fraction of micronuclei-positive cells and the cGAS-positive micronuclei cells induced by
UNC1999 treatment were abolished with the addition of RT inhibitors (Fig. 6c, e, f). Finally, the presence of reverse-transcriptase inhibitors attenuated the activation of key components of
the cGAS-mediated DNA sensing pathway including cGAS, IRF7, and pSTAT1 upon UNC1999 treatment (Fig. 6g). Consequently, we found that the induction of ISG by UNC1999 was significantly reduced
with the addition of RT inhibitors (Fig. 6h). In conclusion, our findings reveal that EZH2i upregulates the expression of full-length LINE-1 elements, which induces ssDNA formation, genome
instability, and cytosolic DNA sensing pathway in a process dependent on reverse transcriptase activity. DISCUSSION Pharmacological inhibitors targeting EZH2 in SMARCB1-deficient tumors have
demonstrated promising outcomes in both preclinical and clinical studies17,18,22,23,24. Tazemetostat, a specific EZH2 inhibitor, has been granted accelerated approval by the US FDA for the
treatment of SMARCB1-deficient cancers. Dissecting the mechanisms of action of EZH2i in SMARCB1-deficient tumors is crucial for optimizing treatment plans and achieving better outcomes. Our
findings indicate that a major mechanism underlying the anti-tumor effects of EZH2i in ATRTs is the induction of viral mimicry response, which holds potential implications for the clinical
activity of targeting EZH2 in ATRT patients. A recent report has shown high levels of T cell and myeloid cell infiltration in rhabdoid tumors, despite their low mutation burden38. Our
results suggest that SMARCB1 deficiency may predispose these tumors to viral mimicry, a state that can be enhanced with EZH2 inhibition. This could provide the scientific rationale for
evaluating the combination of EZH2i and immunotherapy for the treatment of these tumors. Further studies are necessary to investigate the effects of EZH2 inhibitors on the tumor
microenvironment and their ability to enhance immunotherapy including immune checkpoint blockade in SMARCB1-deficient tumors. Our data suggest that intronic and 3′ UTR IR-Alu elements are
the major sources of dsRNA that stimulates viral mimicry triggered by EZH2i. Of note, transcriptomic and epigenomic analyses indicate that IR-Alu expression is driven by the excessive
transcription of the genes associated with these elements, which become derepressed upon the removal of repressive H3K27me3 marks. These results contrast a previously discovered mechanism,
showing that DNA demethylating agents triggers the cryptic transcription of a subset of intronic and intergenic IR-Alu elements36. These IR-Alu elements are usually located downstream of
orphan CGIs and become derepressed upon DNA demethylation. These findings together indicate that DNA methylation and H3K27me3 preferentially target different IR-Alu elements in the human
genome. The mutual exclusivity between DNA methylation and H3K27me3 in silencing IR-Alu elements could be explained by the antagonistic activity of DNA methylation in PRC2 recruitment. The
interplay between DNA methylation and H3K27me3 could play important roles in the regulation of retroelements and dsRNA formation. Whether the combination of DNMTi with EZH2i would achieve a
broader activation of IR-Alu elements and increased expression of dsRNA is worth further investigations. Moreover, our analysis reveals that the intronic and 3′ UTR regions of ISGs activated
by EZH2i contain IR-Alu elements that may produce dsRNA, leading to an enhancement of viral mimicry via a feedforward mechanism. This could have far-reaching implication in innate immunity,
as ISGs seem to increase interferon response through the production of endogeneous dsRNA. Our research shows that EZH2i not only activates the dsRNA sensing pathway, but also triggers
cytoplasmic ssDNA, genome instability and formation of micronuclei through L1-mediated reverse transcription, leading to the activation of the cGAS-STING pathway and viral mimicry state. In
our study, we observed that inhibiting EZH2 leads to the induction of DSBs, as evidenced by increased γ-H2AX foci formation, which could be rescued with the addition of RT inhibitors.
However, direct evidence of residual genomic scars from DSBs remains elusive, as whole-genome sequencing (WGS) struggles to detect genomic instability at the necessary resolution. Future
studies should employ higher-resolution techniques, such as long-read sequencing or single-cell sequencing, to identify potential DSBs and their remnants. These methods could complement our
findings and offer a more comprehensive understanding of the impact of EZH2i on L1 activity and genome instability. In addition, our findings expand a previous report of EZH2i activating the
dsRNA-STING-ISG response in prostate cancer models26, providing a deeper understanding of viral mimicry induction by EZH2i. Indeed, co-depletion of MAVS and cGAS fully rescues ISG
induction, indicating that viral mimicry is dependent on both dsRNA and DNA sensing pathways. Our reverse transcriptase inhibition and L1 knockout/down experiments suggest that the presence
of cytoplasmic ssDNA and subsequent DNA sensing activation following EZH2i depend on L1 reverse transcriptase activity. Recent studies by Thawani et al.59 and Baldwin et al.60 provided
comprehensive insights into the structural basis and molecular mechanism of the L1 retrotransposon. They demonstrated that the cytosolic reverse transcriptase activity of ORF2p can generate
RNA:DNA hybrids, leading to the activation of DNA sensing pathway and downstream interferon signaling. These findings align with our discovery that cytoplasmic ssDNA induced by UNC1999
relies on the reverse transcriptase activity of L1 elements. However, our CUT&RUN and RNA-seq analyses did not pinpoint the specific L1 subfamily involved and might not have the
resolution to detect autonomous L1Hs that could potentially be activated by EZH2i. The relatively ancient L1PA elements upregulated by EZH2i may lack the functional reverse transcriptase
activity necessary for retrotransposition. It is conceivable that L1PA elements upregulated by EZH2i could exploit the reverse transcriptase produced by L1Hs expressed at basal levels to
mobilize in a nonautonomous manner. These limitations should be considered when extrapolating our results to active L1 elements involved in viral mimicry. Altogether, our study identifies
the activation of viral mimicry as a fundamental mechanism underlying the vulnerability of ATRT cells to EZH2i. Specifically, IR-Alu elements from intragenic regions are characterized as the
primary source of immunogenic retroelements, producing dsRNA through increased expression of their associated genes upon EZH2i. Moreover, our results suggest a positive feedback loop where
the viral mimicry state is reinforced as certain ISGs activated by EZH2i contain IR-Alu sequences. Finally, our data show that EZH2i triggers genome instability through L1-mediated reverse
transcription and activates the cGAS-STING pathway, working in conjunction with the dsRNA sensing pathway to drive viral mimicry induction. METHODS PHARMACOLOGICAL TREATMENT The EZH2
inhibitors UNC1999 (Cayman Chemical 14621-50), GSK343 (Sigma-Aldrich SML0766), Valemetostat (DS-3201) (Selleck Chemicals S8926), and Tazemetostat (EPZ-6438) (Selleck Chemicals S7128) were
reconstituted in DMSO as 10 mM stocks and stored at −80 °C. UNC2400 (gift from SGC), a negative control for UNC1999, was reconstituted in DMSO as 10 mM stock and stored at −80 °C. The JAK
inhibitors Ruxolitinib (InvivoGen tlrl-rux) and CP-690550 (InvivoGen tlrl-cp69) were reconstituted in DMSO, both as 20 mM stocks and stored at −20 °C. The STING inhibitor H-151 (gift from
SGC) was reconstituted in DMSO as 10 mM stocks and stored at −80 °C. The reverse-transcriptase (RT) inhibitors Stavudine (D4T) (Selleck Chemicals S1398), Lamivudine (3TC) (Selleck Chemicals
S1706), Zidovudine (AZT) (Selleck Chemicals S2579), Didanosine (ddI, DDI) (Selleck Chemicals S1702), Nevirapine (NVP) (Selleck Chemicals S1742) were reconstituted in DMSO or water as 50 mM
stocks according to the manufacturer’s instructions and stored at −80 °C. For in vitro experiments, cells were seeded at 50,000 cells/mL for 6–12 h, followed by UNC1999 (1 μM, 2.5 μM, or 5
μM) or UNC2400 (2.5 μM or 5 μM) treatment. For treatment with JAK inhibitors, Ruxolitinib or CP-690550 was added at a concentration of 1 μg/mL. For STING inhibition, H-151 was added at 1 μM.
A combination of 1 μM D4T and 10 μM 3TC or a combination of 5 μM AZT, 5 μM ddI, and 5 μM NVP was used for treatment with RT inhibitors. CELL CULTURE ATRT cell line CHLA02-ATRT (ATCC, Cat#
CRL-3020) and CHLA05-ATRT (ATCC, Cat# CRL-3037) were obtained from American Type Culture Collection (ATCC, Teddington, UK) and cultured in DMEM/F12 supplemented with 20 ng/mL FGF, 20 ng/mL
EGF, and 1x B27 supplement. BT12 and BT16, which were kind gifts from Dr. Annie Huang at Hospital for Sick Children, were cultured in RPMI-1640 supplemented with 10% FBS. CELL COUNT AND CELL
PROLIFERATION ASSAY ANALYSIS Relative cell growth was measured by counting viable cells. Viable cell numbers harvested from all treatment conditions were counted using the automated
cell-counting machine Vi-CELL XR (Beckman Coulter) following the manufacturer’s instructions. Cell proliferation was measured by CellTrace Violet (CTV) assay. Briefly, at day 0 prior to drug
treatment, cells were stained with CTV dye (ThermoFisher Scientific C34557) according to the manufacturer’s instructions. At day 3 and day 7 post UNC1999 or UNC2400 treatment, cells were
harvested and washed with FACS washing buffer (PBS, 0.5% BSA, 2 mM EDTA). CTV fluorescence was measured by flow cytometry and analyzed using FlowJo software. APOPTOSIS ASSAY Cellular
apoptosis was assessed through annexin V and propidium iodide (PI) staining using annexin V-FITC Apoptosis Detection Kit (BD Pharmingen 556547), according to the manufacturer’s protocol.
FITC and PI fluorescence was measured by flow cytometry and analyzed using FlowJo software. RNA-SEQ AND DATA ANALYSIS BT16 cells were treated with UNC1999 or UNC2400 at 5 μM and harvested at
day 4 and day 6 for total RNA isolation. 12 total RNA samples from three biological replicates were extracted using the RNeasy Plus Mini Kit (QIAGEN, catalog No. 74104) and then quantified
by qubit RNA kit (Life Technologies) and quality assessed by Agilent Bioananlyzer. All samples had an RNA integrity number greater than 9. Libraries were prepared using TruSeq Stranded Total
RNA kit (Illumina). 200 ng of each RNA sample was ribosomal RNA depleted using Ribo-zero Gold rRNA beads. The RNA samples were fragmented following purification. The cleaved RNA fragments
were copied into first strand cDNA using reverse transcriptase and random primers. This is followed by second strand cDNA synthesis using RNase H and DNA Polymerase I. A single ‘A′
nucleotide was added, followed by adapter ligation. The resulting product was then purified and amplified with PCR to create cDNA libraries. Final cDNA libraries were size validated using
Agilent Bioanalyzer or Tapestation and concentration validated by qPCR (Kapa Biosystems/Roche). All libraries were normalized and pooled together, denatured with 0.2 N NaOH and diluted to a
final concentration of 250 pM. Pooled libraries were loaded onto an Illumina Novaseq V1.5 cartridge for cluster generation and sequenced by the Princess Margaret Genomics Centre on an
Illumina Novaseq 6000 instrument (Illumina). Paired-end 101 bp protocol was used to achieve around 60 million reads per sample. Raw reads were trimmed using TrimGalore tool
(http://www.bioinformatics.babraham.ac.uk/projects/trim_galore/) to remove adapters and low-quality bases. Bases with quality score less than 30 were removed, and trimmed reads that have
length less than 40 bp were removed. Trimmed reads were aligned to the human genome reference hg38 using STAR tool v.2.5.261. Aligned reads were sorted based on the genomic coordinates using
the sort command from samtools package v.1.962. Duplicate reads were marked using Picard tools v.1.9.1 (http://broadinstitute.github.io/picard/) with duplicate parameters marked as
“lenient” and then removed using samtools. Genome track bigwig files were created for the forward and reverse strands using the bamCoverage command from the deepTools package63. RNA-seq
differential analysis for genes was performed to assess the deferentially up/downregulated genes. The aligned reads were counted for genes using the featureCount command64 from the subread
tools v.1.6.2. The featureCount command was used with the following setting (-p -B --ignoreDup -O -s 2). Differential analysis for gene counts was performed using the edgeR library65.
Significantly upregulated/downregulated genes were determined by abs(log2FC)>1 and FDR < 0.05. Pathway analysis for the upregulated genes was performed using the R package
gprofiler266,67. RNA-seq differential analysis at repeat elements was also performed to assess the up/downregulated repeat elements. Aligned reads at repeat loci were counted for each sample
using the featureCount command from the subread tools. We used a gene transfer format (GTF) file for the whole genome repeat loci downloaded from the UCSC database. Reads were counted for
each repeat locus from the two RNA-seq stands separately to assess the differential analysis of repeat loci by the two strands separately. The featureCount command was used with the
following setting (-M -p -B --ignoreDup -f). Differential analysis for repeat loci counts was performed using the edgeR library. Significantly upregulated/downregulated repeat loci were
determined by abs(log2FC)>1 and FDR < 0.05. Differential analysis for ATRT samples21 (_n_ = 11) versus SMARCB1-wildtype tumor samples (_n_ = 14) was performed to evaluate the
upregulated and downregulated repeats. Tumor total RNA were collected through the Rare Brain Tumor Consortium and Registry (www.rarebraintumorconsortium.ca) with informed consent as per
protocols approved by the Research Ethics Board of the Hospital for Sick Children and sequenced with Illumina machine. Mean-average plots were plotted to show the upregulated and
downregulated repeats in ATRT samples vs SMARCB1-wildtype tumor samples. CPM and TPM normalizations were calculated for all repeat elements. Genomic annotation for upregulated repeat
elements was performed to evaluate the genomic distribution of the upregulated repeats elements. The counts of the upregulated repeat elements that were annotated to each genomic feature
were calculated. These counts were compared with the counts of genomic annotation of all repeat elements in the whole genome using the Fisher exact test to calculate the odds ratio and
p-value. The reads for the genes were counted and the TPM expression values of the genes were calculated in each RNA-seq patient sample. Differential analysis for SMARCB1-negative (_n_ = 3)
versus SMARCB1-positive (_n_ = 3) I2A cell line samples (2 days post the re-expression of SMARCB1) was performed to evaluate the upregulated and downregulated repeats. Upregulated repeats
were determined using the log2(FC) > 1 and FDR < 0.05 cut-offs. Downregulated repeats were determined using the log2(FC) < 1 and FDR < 0.05 cut-offs. EXPRESSED IR-ALUS ANALYSIS
Alu elements in each sample that have expression of CPM value >5 have been determined to be expressed elements. The expressed Alus in each sample have been intersected with the list of
annotated IR Alus36 to get the list of IR Alus that are expressed in each sample. We made a list of the union of these expressed IR Alu elements in all the samples. We calculated the TPM
scores for the union list in each sample as the sum of the TPM values of that list of expressed IR Alus in each sample. ISG SCORE ISG score was calculated for 38 ISG genes39 by normalizing
the expression of each gene in all samples by the mean of expression of the gene in all samples to remove the bias in the baseline expression of each of the 38 genes. The ISG score in each
sample is calculated as the mean of the normalized TPM values of the 38 genes in each sample. CTY SCORE We performed the quantile normalization of the TPM values after performing the
log2(TPM + 1) normalization for these TPM values. The geometric mean was calculated for the PRF1 and GZMA genes to calculate the CTY score in each sample as previously described38.
CUT&RUN AND DATA ANALYSIS BT16 cells were treated with UNC1999 or UNC2400 at 5 μM and harvested at day 4 and day 6. CUT&RUN was performed as previously described37. Briefly, 250,000
cells from each condition were immobilized on magnetic beads, and were then incubated with H3K27me3 antibody (anti-histone H3 (tri methyl K27) antibody-ChIP grade (ab6002)) or H3K4me3
antibody (anti-histone H3 (tri methyl K4) antibody-ChIP grade (ab8580)) at 4 °C at 1:100 dilution overnight. Digitonin wash buffer (0.05%) was applied to cells the next way, followed by
addition of approximately 700 ng μl − 1 protein A-MNase into the mixture. After the 1 h of rotation at 4 °C, the mixture was washed with digitonin wash buffer (0.05%). To initiate the
cleavage step, 3 μl of 100 mM Ca2+ was added to the mixture on ice for 30 min. Then, chelation was used to stop the cleavage step. Following centrifugation, the histone-DNA complexes in the
supernatant were then extracted using QIAGEN MinElute Kit. The extracted DNA was subjected to library preparation. NEBNext Ultra II DNA Library Prep Kit was used to prepare paired-end
sequencing libraries by following the instructions of the manufacturer. Approximately 40 million reads per sample were achieved via Illumina Nextseq500 instrument sequencing. Fastq reads
were trimmed using fastp program v.0.19.568 to remove adapters and remove bases with low quality score. Bases with quality score less than 30 were removed, and trimmed reads that are less
than 35 bp were removed. Trimmed reads were aligned to the human genome hg38 using bowtie2 tool v.2.3.569 using the same alignment setting described previously70. Duplicated reads were kept
in the downstream analysis, while the unaligned reads and discordantly aligned reads were discarded. We further filtered reads that were aligned to the hg38 genome by removing reads that
overlap with the hg38 ENOCDE blacklist regions (https://www.encodeproject.org/files/ENCFF356LFX/) to remove potential blacklist regions. These reads that overlap with blacklist regions were
filtered using pairtobed command from the bedtools suite v.2.27.171. The trimmed reads were also aligned to the S. cerevisiae yeast genome (sacCer3) to quantify the yeast spike-in reads for
the spike-in normalization purpose using the bowtie2 parameters setting of alignment to the spike-in genome described previously70. Alignment files were converted from sam to bam format and
sorted by genomic coordinates using samtools v.1.962. Alignment files of biological replicates were pooled using samtools. Whole genome coverage tracks in bigwig file format were created
from the pooled bam files using the bamCoverage command from the deeptools package v.3.5.063. In calculating the genome tracks, we counted the spike-in reads that were aligned to the yeast
genome to calculate the spike-in normalization factor that was used to normalize read counts with the bamCoverage command. Normalization factor was calculated as 10000 divided by the count
of spike-in reads. Heatmaps of the CUT&RUN signal were extracted from the bigwig files using computeMatrix command and plotted using plotHeatmap command in the deepTools package. IR-ALU
ANALYSIS To analyze the IR-Alu elements using the hg38 genome reference and based on the experimentally-validated (EV) IR-Alu elements that are MDA5 dsRNA agonists identified previously36,
we re-analyzed the MDA5 protection assay based on the hg38 genome reference using the method described previously36. We detected about 1038 IR pairs which include 1587 Alu elements as
baseline IR-Alu elements, and 3719 IR pairs which include about 5261 Alu elements as treatment-induced IR-Alu elements. These numbers are very close to the numbers previously detected based
on hg19 genome36. We also performed whole-genome IR-Alu analysis to annotate all possible IR-Alu pairs in the hg38 genome. We detected about 750,005 annotated IR pairs, which is very close
to the number of pairs detected previously based on the hg19 reference genome. The genomic regions of the IR-Alu elements were annotated using GENCODE v.28 assembly. Alu elements that are
not overlapping with introns, exons, 3′UTR and 5′UTR regions were considered as Intergenic Alu elements. We determined the upregulated EV and Annotated IR pairs in ATRT cells in UNC1999
versus UNC2400 samples as the pairs where both Alu elements have log2FC > 1 and FDR < 0.05 after preforming differential analysis for the whole genome repeat elements using edgeR
package. We detected the set of genes that overlap with intronic and 3′UTR IR pairs, which are the IR pairs that annotated to intronic or 3′UTR regions. We called these IRs intronic IRs or
3′UTR IRs and combined them as intragenic IRs. Pathway analysis was performed on the upregulated genes that overlap with intragenic IRs using the R package gprofiler2 to identify the
enriched pathways and the transcription factor enrichment at these genes. Heatmaps for the RNA-seq signal of genes with upregulated intronic annotated IRs were plotted from the transcription
start site (TSS) to the transcription end site (TES) of these genes with expanding the plot by 1 kb upstream of the TSS and downstream of the TES. RNA-seq signal for each gene was plotted
from the stand where the gene is transcribed. Heatmap data matrix was computed using the computeMatrix command from deepTools package and plotted using plotHeatmap from the same package.
Another heatmap showing the CUT&RUN H3K27me3 signal at these genes was also plotted from the TSS to the TES with expanding the plot by 2 kb upstream of the TSS and downstream of the TES.
Another heatmap of the RNA-seq signal for these overlapping genes was plotted only at the intronic regions of the genes. The tracks of this heatmap were plotted from the 5′end of the first
intron to the 3′end of the last intron in the gene. To plot this heatmap, RNA-seq signal for each intron of a gene was extracted from the bigwig file of the strand where the gene is
transcribed using the pyBigWig v.0.2.7 python package. RNA-seq signals of the introns of the same genes were concatenated with keeping the order of the introns from the 5′end to the 3′end.
If the gene is transcribed in the reverse strand, the concatenated signal of the gene is reversed such that the 5′end of the signal will always be at the left side. The concatenated signal
of each gene was normalized to be the same length for all genes. Signals for the genes from all plotted samples were stored in a data matrix such that each row represents a gene signal with
the first group of columns representing signal from the first sample and the second group of columns representing signal from the second sample. Signal matrix was converted to a format
compatible with plotHeatmap in deeptools. This matrix was used by the plotHeatmap command from the deepTools package to plot the heatmap. Correlation scatter plots were plotted for log2FC of
the genes that overlap with upregulated intragenic annotated IRs and the log2FC of these IRs. log2FC of the upregulated IR was calculated as the average of the log2FC of the two Alu
elements. For genes overlapping with multiple IR pairs, we selected the IR pair with the highest log2FC for calculating the correlation. The scatter plot was plotted using the R package
ggplot2. Pearson correlation coefficient was calculated with a p-value using two-sided t test. Correlation scatter plots were plotted for genes with upregulated IR-Alu elements in their
3′UTR and intronic regions. These scatter plots show the correlation between the log2FC of RNA-seq and the log2FC of each of the H3K4me3 and the H3K27me3 marks, and between the two histone
marks. The FC of the RNA-seq of the genes was calculated as the ratio between the Count per Million (CPM) of the gene at the UNC1999 condition to the CPM of the gene at the UNC2400
condition. The FC of each of the two histone marks was calculated as the ratio of the average of the genomic signal of the histone mark from 5 kb upstream the TSS to 5KB downstream the TSS
of the gene in the UNC1999 condition to the average of the same region in the UNC2400 condition. Histone mark signal was extracted from the bigwig file using the pyBigWig v.0.2.7 python
package. Pearson correlation coefficient was calculated, and the p-value was calculated using the t test. Gene set enrichment analysis (GSEA) was performed on upregulated genes overlapping
with upregulated intragenic annotated IRs. GSEA tool v.4.2.372,73 was used in this analysis. FULL-LENGTH LINE-1 ANALYSIS Upregulated LINE-1 elements were classified as full-length LINE-1
elements that have a length >= 6 kb and truncated LINE-1 elements that have a length less than 6 Kb. Donut plots for the proportions of upregulated full-length and truncated LINE-1
elements were generated. Counts of these two groups of upregulated LINE-1 elements were compared with the counts of full-length and truncated LINE-1 elements in the whole genome using the
two-sided Fisher exact test to calculate the odds ratio and p-value. Correlation scatter plots were plotted for the RNA-seq FC of the upregulated full-length LINE-1 elements and the FC of
CUT&RUN histone marks. These scatter plots included RNA-seq log2FC versus H3K4me3 log2FC, RNA-seq log2FC versus H3K27me3 log2FC, and H3K4me3 log2FC versus H3K27me3 FC. The FC of the
H3K4me3 and H3K27me3 marks was calculated as the ratio of the CUT&RUN signal in the UNC1999 sample to the UN2400 sample at 5 kb upstream of the 5′UTR and 5 kb downstream of the 5′UTR of
the elements. L1H AND L1P SEQUENCE ANALYSIS Full length DNA sequences of L1PA2, L1PA3, L1PA4, L1PA5, L1PA6 and L1PA7 elements have been aligned individually to a sequence of L1H. The pairs
of sequences were aligned in using the Needleman-Wunsch global alignment algorithm. The following score settings were used in alignment: 1 penalty score for gap extension, 10 penalty score
for gap opening, 1 score for match, and 0 score for mismatch. The alignment data has been plotted as genome tracks with color-coding the gaps in L1PA and L1H, mismatches, matches, location
of 5′ UTR guides, and location of ORF1 guides. 5′ UTR AND ORF1 GUIDE SEARCH We searched for the presence sequences of 5′ UTR and ORF1 guides in all LINE-1 elements in the whole genome. The
counts of each LINE-1 subfamily that included the guide were compared with the total count of the corresponding subfamily in the whole genome using the two-sided Fisher exact test to
calculate the odds ration and p-value. Donut plots were plotted to visualize the proportions of the LINE-1 subfamilies that included the sequences of the guides. PLASMIDS AND LENTIVIRAL
TRANSDUCTION sgRNA sequences listed in Supplementary Table 1 targeting MAVS, cGAS, TP53, Luciferase and a control region (AAVS locus) were cloned into the lentiCRISPRv2 plasmid (gift from
Feng Zhang - Addgene 52961 and 83480) as previously described74. Lentiviral particles were generated using HEK293FT cells as previously described75, and the packaging plasmids pMDG.2 and
psPAX2 (gifts from Didier Trono - Addgene 12259 and 12260). Cells were transduced for 24hrs followed by selection with media containing puromycin (2 μg/mL) or blasticidin (5 μg /mL) for
72hrs. Cells were washed with PBS and seeded for experimental procedures. RT–QPCR RNA was isolated from cells using RNeasy Mini Kit (QIAGEN) with DNase I treatment, and quantified by a
NanoDrop 2000 spectrophotometer (Thermo Scientific). SuperScript VILO cDNA Synthesis Kit (Thermo Fisher) was used to synthesize cDNA from 500 ng to 1 μg of RNA. Then, qPCR was performed in
duplicates using 10 to 20 ng of cDNA. Each qPCR reaction used 5 μl of cDNA, 10 μl of SYBR Select Master Mix (Thermo Fisher) and 0.2 μM of forward and reverse primers in 20 μl total volume,
which was performed by StepOnePlus Real-Time PCR system (Applied Biosystems). The condition of the qPCR reaction was: 95 °C for 10 min, 40 cycles of 95 °C for 15 s, and 60 °C for 1 min. The
expression levels of the target gene were normalized against the housekeeping gene RPLP0 and referred to control using the formula (2-ΔΔ_CT_). The Supplementary Table 2 shows the sequences
of the primers used. IMMUNOCYTOCHEMISTRY Cells were grown on glass coverslips and fixed for 20 min in 4% paraformaldehyde (PFA), permeabilized for 5 min with 0.5% Triton X-100, blocked with
blocking buffer (BSA 3%) for 1 h at 37 °C and incubated with primary antibodies diluted in 3% BSA at 4 °C overnight. The primary antibodies for immunocytochemistry were shown in
Supplementary Table 3. On the next day, secondary antibodies including anti-mouse IgG (H + L) (Cell Signaling Technology, 4410) and Anti-rabbit IgG (H + L) (Cell Signaling Technology, 4412)
were used at a dilution of 1:1000 to incubate the cells for 1 h at room temperature. Cells were then incubated with DAPI before mounting with ProLong Gold Antifade Mountant (Thermo Fisher
Scientific, P36930). Confocal microscopy was performed using Leica SP8 Confocal Microscope with consistent acquisition parameters. captured images were analyzed with FIJI (ImageJ). Corrected
total cell fluorescence (CTCF) was calculated as: integrated density − (area of selected cell × mean fluorescence of background readings). The number of γH2A.X foci per cell was quantified
by manually counting γH2A.X foci under blinded conditions. Micronuclei were characterized as discrete DNA structures detached from the primary nucleus, while apoptotic appearance cells were
excluded from the analysis. The fraction of cells containing micronuclei was determined via microscopy in blinded conditions with DAPI staining. SSDNA STAINING ssDNA immunocytochemistry was
conducted as previously described56. Briefly, cells were fixed with 4% PFA on ice for 20 min and then were incubated with methanol overnight at −20 °C. The following day, 200 μg/mL RNase
(Sigma R4642) was applied on the cells for 4 hours at 37 °C. 3% BSA was then used to block the cells for 1 h. Cells were incubated with the anti-ssDNA primary antibody (Millipore, MAB3299, 5
μg/mL) at 4 °C overnight. On the next day, the secondary antibodies and then DAPI were used to incubate the cells prior to mounting. Leica SP8 Confocal Microscope was used to blindly obtain
images of ssDNA. The number of ssDNA puncta per cell was determined by manually counting ssDNA puncta under blinded conditions. MAVS AGGREGATION ASSAY MAVS aggregation was examined using
semi-denaturing detergent agarose gel electrophoresis (SDD-AGE) gel as previously described76.In summary, mitochondria were isolated (Qproteome Mitochondria Isolation Kit, Qiagen) from BT16
and CHLA02 cells after casting a 1.5% agarose vertical gel. The isolated mitochondria were resuspended in mitochondria buffer, and diluted before loading on the gel. Electrophoresis was done
for 1 h at 4 °C at a constant voltage of 100 V in running buffer (1× TBE and 0.1% SDS). Then, proteins were transferred into a Trans-Blot Turbo Midi PVDF Transfer membrane (BioRad), and
MAVS protein was detected using anti-MAVS antibody in 1:1,000 dilution (ab89825; Abcam). WESTERN BLOT Cells were lysed in lysis buffer (0.1% SDS, 400 mM NaCl, 1 mM EDTA, 50 mM of Tris-HCl,
1% Triton) and applied haltprotease and phosphatase inhibitor cocktail (Thermo Fisher Scientific) as the final dilution of 1:100 to obtain whole-cell extracts. A BCA assay (Promega) was then
used to quantify protein. After boiling at 95 °C for 5 min, 20–30 μg of protein per lane was loaded and separated on 4–20% Mini-PROTEAN TGX Gel (BioRad). Then, protein was transferred onto
a Trans-Blot Turbo Nitrocellulose Transfer membrane (BioRad). The membrane was blocked in 5% BSA in TBS + 0.1% Tween 20 (TBST) and incubated in primary antibody diluted in blocking buffer
overnight at 4 °C. The primary antibodies for western blot were listed in Supplementary Table 3. The following secondary antibodies were used: Anti-Rabbit IgG, HRP-linked Antibody (Cell
Signaling, 7074, 1:5000) and anti-Mouse IgG, HRP-linked Antibody (Cell Signaling, 7076, 1:5,000). ClarityWestern ECL Substrate (BioRad) was used to develop the blots. ISOLATION OF SSDNA
SPECIES Extrachromosomal DNA extraction and ssDNA preparation was conducted as previously described56. In brief, BT16 cells were detached using trypsin, pelleted, and suspended in Buffer 1
(50 mM Tris-HCl, 10 mM EDTA, supplemented with 100 μg/mL RNase A). Subsequently, cells were lysed with Buffer 2 (1.2% sodium-dodecyl sulfate), ensuring complete lysis through a 5-minute
incubation at room temperature. Debris and high-molecular-weight chromosomal DNA were precipitated by adding Buffer 3 (3 M CsCl, 1 M potassium acetate, and 0.67 M acetic acid). After
chilling on ice for 15 minutes, the supernatant containing extrachromosomal DNA was collected, column purified, and treated with dsDNase (ThermoScientific) before a second column
purification to obtain ssDNA. L1 enrichment in ssDNA were quantified by qPCR using primers targeting 5′UTR, ORF1, and ORF2 regions, with normalization to the corresponding gDNA. The primers
used for qPCR were included in Supplementary Table 2. DSRNA IMMUNOPRECIPITATION The dsRNA immunoprecipitation was adapted from previously established method77. One day before harvesting the
cells, Protein G Dynabeads (Thermo 10004D) were washed three times with antibody conjugation buffer before being resuspended beads in antibody conjugation buffer (1x PBS, 2 mM EDTA,0.1%
BSA). In all, 5 μg J2 anti-dsRNA antibody (Scicons) per reaction was added to the washed beads and incubated overnight at 4 °C with rotation. BT16 cells were detached by trypsin and
resuspended in lysis buffer (20 mM Tris pH 7.5, 150 mM NaCl, 10 mM EDTA, 10% Glycerol, 0.1% NP-40, 0.5% Triton X-100, protease inhibitors (add fresh)) at day 4 post UNC1999 or UNC2400
treatment. Cell lysates were incubated for 15 minutes on ice. Cell debris was cleared via 15 min max speed centrifugation. 10% of the cleared cell lysate was retained as input control.
Antibody-bound beads were then washed three times with ice-cold lysis buffer before being added to the IP fraction. The mixture was incubated overnight at 4 °C with rotation. RNA-bound beads
were then washed three times with ice-cold high salt wash buffer before RNA extraction using TRIzol (along with input). Input and dsRNA-enriched fractions were then converted into cDNA and
analyzed by qPCR. The primers used for qPCR were included in Supplementary Table 2. STATISTICAL ANALYSIS AND ILLUSTRATIONS The sample size in each experiment is indicated in the figure
legends. Statistical analyses and plotting for in vitro assays were performed using GraphPad prism (GraphPad Software, USA). Schematic illustrations were created using BioRender. REPORTING
SUMMARY Further information on research design is available in the Nature Portfolio Reporting Summary linked to this article. DATA AVAILABILITY Raw sequencing data of RNA-seq and CUT&RUN
have been deposited at the Gene Expression Omnibus (GEO) (https://www.ncbi.nlm.nih.gov/geo) under the accession number GSE213250. Source data are provided with this paper. CODE AVAILABILITY
Custom codes used for data analysis are available at the project Zenodo repository (https://zenodo.org/records/10534910). REFERENCES * Kadoch, C. et al. Proteomic and bioinformatic analysis
of mammalian SWI/SNF complexes identifies extensive roles in human malignancy. _Nat. Genet._ 45, 592–601 (2013). Article PubMed PubMed Central CAS Google Scholar * Ginn, K. F. &
Gajjar, A. Atypical teratoid rhabdoid tumor: current therapy and future directions. _Front. Oncol._ https://doi.org/10.3389/fonc.2012.00114 (2012). * Versteege, I. et al. Truncating
mutations of hSNF5/INI1 in aggressive paediatric cancer. _Nature_ 394, 203–206 (1998). Article ADS PubMed CAS Google Scholar * Wilson, B. G. et al. Epigenetic antagonism between
polycomb and SWI/SNF complexes during oncogenic transformation. _Cancer Cell_ 18, 316–328 (2010). Article PubMed PubMed Central CAS Google Scholar * Kia, S. K., Gorski, M. M.,
Giannakopoulos, S. & Verrijzer, C. P. SWI/SNF mediates polycomb eviction and epigenetic reprogramming of the INK4b-ARF-INK4a locus. _Mol. Cell Biol._ 28, 3457–3464 (2008). Article
PubMed PubMed Central CAS Google Scholar * Margueron, R. & Reinberg, D. The polycomb complex PRC2 and its mark in life. _Nature_ 469, 343–349 (2011). Article ADS PubMed PubMed
Central CAS Google Scholar * Varambally, S. et al. The polycomb group protein EZH2 is involved in progression of prostate cancer. _Nature_ https://doi.org/10.1038/nature01075 (2002). *
Kleer, C. G. et al. EZH2 is a marker of aggressive breast cancer and promotes neoplastic transformation of breast epithelial cells. _Proc. Natl Acad. Sci. USA_
https://doi.org/10.1073/pnas.1933744100 (2003). * Sneeringer, C. J. et al. Coordinated activities of wild-type plus mutant EZH2 drive tumor-associated hypertrimethylation of lysine 27 on
histone H3 (H3K27) in human B-cell lymphomas. _Proc. Natl Acad. Sci. USA_ https://doi.org/10.1073/pnas.1012525107 (2010). * Li, H., Cai, Q., Godwin, A. K. & Zhang, R. Enhancer of zeste
homolog 2 promotes the proliferation and invasion of epithelial ovarian cancer cells. _Mol. Cancer Res._ https://doi.org/10.1158/1541-7786.MCR-10-0398 (2010). * Poirier, J. T. et al. DNA
methylation in small cell lung cancer defines distinct disease subtypes and correlates with high expression of EZH2. _Oncogene_ https://doi.org/10.1038/onc.2015.38 (2015). * Morin, R. D. et
al. Somatic mutations altering EZH2 (Tyr641) in follicular and diffuse large B-cell lymphomas of germinal-center origin. _Nat. Genet._ https://doi.org/10.1038/ng.518 (2010). * Lohr, J. G. et
al. Discovery and prioritization of somatic mutations in diffuse large B-cell lymphoma (DLBCL) by whole-exome sequencing. _Proc. Natl Acad. Sci. USA_ https://doi.org/10.1073/pnas.1121343109
(2012). Article PubMed PubMed Central Google Scholar * Bödör, C. et al. EZH2 mutations are frequent and represent an early event in follicular lymphoma. _Blood_
https://doi.org/10.1182/blood-2013-04-496893 (2013). * McCabe, M. T. et al. EZH2 inhibition as a therapeutic strategy for lymphoma with EZH2-activating mutations. _Nature_
https://doi.org/10.1038/nature11606 (2012). * Knutson, S. K. et al. Selective inhibition of EZH2 by EPZ-6438 leads to potent antitumor activity in EZH2-mutant non-Hodgkin lymphoma. _Mol
Cancer Ther_ https://doi.org/10.1158/1535-7163.MCT-13-0773 (2014). * Kim, K. H. & Roberts, C. W. M. Targeting EZH2 in cancer. _Nat. Med._ 22, 128–134 (2016). Article PubMed PubMed
Central CAS Google Scholar * Knutson, S. K. et al. Durable tumor regression in genetically altered malignant rhabdoid tumors by inhibition of methyltransferase EZH2. _Proc. Natl Acad.
Sci. USA_ https://doi.org/10.1073/pnas.1303800110 (2013). * Bitler, B. G. et al. Synthetic lethality by targeting EZH2 methyltransferase activity in ARID1A-mutated cancers. _Nat. Med._ 21,
231–238 (2015). Article PubMed CAS Google Scholar * Kadoch, C. et al. Dynamics of BAF-Polycomb complex opposition on heterochromatin in normal and oncogenic states. _Nat. Genet._ 49,
213–222 (2017). Article PubMed CAS Google Scholar * Torchia, J. et al. Integrated (epi)-genomic analyses identify subgroup-specific therapeutic targets in CNS rhabdoid tumors. _Cancer
Cell_ 30, 891–908 (2016). * Italiano, A. et al. Tazemetostat, an EZH2 inhibitor, in relapsed or refractory B-cell non-Hodgkin lymphoma and advanced solid tumours: a first-in-human,
open-label, phase 1 study. _Lancet Oncol._ https://doi.org/10.1016/S1470-2045(18)30145-1 (2018). * Chi, S. N. et al. Phase I study of tazemetostat, an enhancer of zeste homolog-2 inhibitor,
in pediatric pts with relapsed/refractory integrase interactor 1-negative tumors. _J. Clin. Oncol._ 38, 10525 (2020). Article Google Scholar * Gounder, M. et al. Tazemetostat in advanced
epithelioid sarcoma with loss of INI1/<em>SMARCB1 < /em > : an international, open-label, phase 2 basket study. _Lancet Oncol._ 21, 1423–1432 (2020). Article PubMed CAS Google
Scholar * Deblois, G. et al. Epigenetic switch–induced viral mimicry evasion in chemotherapy-resistant breast cancer. _Cancer Discov._ 10, 1312–1329 (2020). Article PubMed CAS Google
Scholar * Morel, K. L. et al. EZH2 inhibition activates a dsRNA–STING–interferon stress axis that potentiates response to PD-1 checkpoint blockade in prostate cancer. _Nat. Cancer_ 2,
444–456 (2021). Article PubMed PubMed Central CAS Google Scholar * Chen, R., Ishak, C. A. & De Carvalho, D. D. Endogenous retroelements and the viral mimicry response in cancer
therapy and cellular homeostasis. _Cancer Discov._ 11, 2707–2725 (2021). Article PubMed CAS Google Scholar * Konze, K. D. et al. An orally bioavailable chemical probe of the lysine
methyltransferases EZH2 and EZH1. _ACS Chem. Biol._ 8, 1324–1334 (2013). Article PubMed PubMed Central CAS Google Scholar * Roulois, D. et al. DNA-demethylating agents target colorectal
cancer cells by inducing viral mimicry by endogenous transcripts. _Cell_ https://doi.org/10.1016/j.cell.2015.07.056 (2015). * Verma, S. K. et al. Identification of potent, selective,
cell-active inhibitors of the histone lysine methyltransferase EZH2. _ACS Med. Chem. Lett._ 3, 1091–1096 (2012). Article PubMed PubMed Central CAS Google Scholar * Quintás-Cardama, A.
et al. Preclinical characterization of the selective JAK1/2 inhibitor INCB018424: therapeutic implications for the treatment of myeloproliferative neoplasms. _Blood_ 115, 3109–3117 (2010).
Article PubMed PubMed Central Google Scholar * Changelian, P. S. et al. Prevention of organ allograft rejection by a specific janus kinase 3 inhibitor. _Science (1979)_ 302, 875–878
(2003). CAS Google Scholar * Barbalat, R., Ewald, S. E., Mouchess, M. L. & Barton, G. M. Nucleic acid recognition by the innate immune system. _Annu Rev. Immunol._ 29, 185–214 (2011).
Article PubMed CAS Google Scholar * Clavarino, G. et al. Induction of GADD34 is necessary for dsRNA-dependent interferon-b production and participates in the control of chikungunya virus
infection. _PLoS Pathog._ https://doi.org/10.1371/journal.ppat.1002708 (2012). * Hou, F. et al. MAVS forms functional prion-like aggregates to activate and propagate antiviral innate immune
response. _Cell_ 146, 448–461 (2011). Article PubMed PubMed Central CAS Google Scholar * Mehdipour, P. et al. Epigenetic therapy induces transcription of inverted SINEs and ADAR1
dependency. _Nature_ 588, 169–173 (2020). Article ADS PubMed CAS Google Scholar * Skene, P. J. & Henikoff, S. An efficient targeted nuclease strategy for high-resolution mapping of
DNA binding sites. _Elife_ 6, 1–35 (2017). Article Google Scholar * Leruste, A. et al. Clonally expanded T cells reveal immunogenicity of rhabdoid tumors. _Cancer Cell_ 36, 597–612 (2019).
Article PubMed CAS Google Scholar * Liu, H. et al. Tumor-derived IFN triggers chronic pathway agonism and sensitivity to ADAR loss. _Nat. Med._ 25, 95–102 (2019). Article PubMed CAS
Google Scholar * Cai, X., Chiu, Y. H. & Chen, Z. J. The cGAS-cGAMP-STING pathway of cytosolic DNA sensing and signaling. _Mol. Cell_ 54, 289–296 (2014). Article PubMed CAS Google
Scholar * Harding, S. M. et al. Mitotic progression following DNA damage enables pattern recognition within micronuclei. _Nature_ 548, 466–470 (2017). Article ADS PubMed PubMed Central
CAS Google Scholar * MacKenzie, K. J. et al. CGAS surveillance of micronuclei links genome instability to innate immunity. _Nature_ 548, 461–465 (2017). Article ADS PubMed PubMed
Central CAS Google Scholar * Yang, H., Wang, H., Ren, U., Chen, Q. & Chena, Z. J. CGAS is essential for cellular senescence. _Proc. Natl Acad. Sci. USA_ 114, E4612–E4620 (2017).
Article ADS PubMed PubMed Central CAS Google Scholar * Liao, Y. et al. Inhibition of EZH2 transactivation function sensitizes solid tumors to genotoxic stress. _Proc. Natl Acad. Sci.
USA_ 119, e2105898119 (2022). * Xu, L. et al. Pharmacological inhibition of EZH2 combined with DNA-damaging agents interferes with the DNA damage response in MM cells. _Mol. Med Rep._ 49,
4249–4255 (2019). Google Scholar * Wang, Y. et al. DNA-PK-mediated phosphorylation of EZH2 regulates the DNA damage-induced apoptosis to maintain T-cell genomic integrity. _Cell Death Dis._
7, e2316–e2316 (2016). Article PubMed PubMed Central CAS Google Scholar * Campbell, S., Ismail, I. H., Young, L. C., Poirier, G. G. & Hendzel, M. J. Polycomb repressive complex 2
contributes to DNA double-strand break repair. _Cell Cycle_ 12, 2675–2683 (2013). Article PubMed PubMed Central CAS Google Scholar * Wu, Z. et al. Polycomb protein EZH2 regulates cancer
cell fate decision in response to DNA damage. _Cell Death Differ._ 18, 1771–1779 (2011). Article PubMed PubMed Central CAS Google Scholar * Sun, L., Wu, J., Du, F., Chen, X. &
Chen, Z. J. Cyclic GMP-AMP synthase is a cytosolic dna sensor that activates the type I interferon pathway. _Science (1979)_ 339, 786–791 (2013). CAS Google Scholar * Haag, S. M. et al.
Targeting STING with covalent small-molecule inhibitors. _Nature_ 559, 269–273 (2018). Article ADS PubMed CAS Google Scholar * Gilbert, N., Lutz-Prigge, S. & Moran, J. V. Genomic
deletions created upon LINE-1 retrotransposition. _Cell_ 110, 315–325 (2002). Article PubMed CAS Google Scholar * Symer, D. E. et al. Human L1 retrotransposition is associated with
genetic instability in vivo. _Cell_ 110, 327–338 (2002). Article PubMed CAS Google Scholar * Rodriguez-Martin, B. et al. Pan-cancer analysis of whole genomes identifies driver
rearrangements promoted by LINE-1 retrotransposition. _Nat. Genet._ 52, 306–319 (2020). Article PubMed PubMed Central CAS Google Scholar * Konkel, M. K. & Batzer, M. A. A mobile
threat to genome stability: The impact of non-LTR retrotransposons upon the human genome. _Semin. Cancer Biol._ 20, 211–221 (2010). Article PubMed PubMed Central CAS Google Scholar *
Dewannieux, M., Esnault, C. & Heidmann, T. LINE-mediated retrotransposition of marked Alu sequences. _Nat. Genet._ 35, 41–48 (2003). Article PubMed CAS Google Scholar * Thomas, C. A.
et al. Modeling of TREX1-dependent autoimmune disease using human stem cells highlights L1 accumulation as a source of neuroinflammation. _Cell Stem Cell_ 21, 319–331.e8 (2017). Article
PubMed PubMed Central CAS Google Scholar * Jones, R. B. et al. Nucleoside analogue reverse transcriptase inhibitors differentially inhibit human LINE-1 retrotransposition. _PLoS ONE_ 3,
e1547 (2008). Article ADS PubMed PubMed Central Google Scholar * Banuelos-Sanchez, G. et al. Synthesis and characterization of specific reverse transcriptase inhibitors for mammalian
LINE-1 retrotransposons. _Cell Chem. Biol._ 26, 1095–1109.e14 (2019). Article PubMed CAS Google Scholar * Thawani, A., Ariza, A. J. F., Nogales, E. & Collins, K. Template and target
site recognition by human LINE-1 in retrotransposition. _Nature_ https://doi.org/10.1038/s41586-023-06933-5 (2023). * Baldwin, E. T. et al. Structures, functions, and adaptations of the
human LINE-1 ORF2 protein. _Nature_ https://doi.org/10.1038/s41586-023-06947-z (2023). * Dobin, A. et al. STAR: ultrafast universal RNA-seq aligner. _Bioinformatics_ 29, 15–21 (2013).
Article PubMed CAS Google Scholar * Li, H. et al. The Sequence Alignment/Map format and SAMtools. _Bioinformatics_ 25, 2078–2079 (2009). Article PubMed PubMed Central Google Scholar
* Ramírez, F. et al. deepTools2: a next generation web server for deep-sequencing data analysis. _Nucleic Acids Res._ 44, W160–W165 (2016). Article PubMed PubMed Central Google Scholar *
Liao, Y., Smyth, G. K. & Shi, W. FeatureCounts: an efficient general purpose program for assigning sequence reads to genomic features. _Bioinformatics_ 30, 923–930 (2014). Article
PubMed CAS Google Scholar * Robinson, M. D., McCarthy, D. J. & Smyth, G. K. edgeR: a bioconductor package for differential expression analysis of digital gene expression data.
_Bioinformatics_ 26, 139–140 (2009). Article PubMed PubMed Central Google Scholar * Kolberg, L., Raudvere, U., Kuzmin, I., Vilo, J. & Peterson, H. gprofiler2 – an R package for gene
list functional enrichment analysis and namespace conversion toolset g:Profiler. _F1000Res_ 9, 709 (2020). Article Google Scholar * Raudvere, U. et al. G:Profiler: a web server for
functional enrichment analysis and conversions of gene lists (2019 update). _Nucleic Acids Res._ 47, W191–W198 (2019). Article PubMed PubMed Central CAS Google Scholar * Chen, S., Zhou,
Y., Chen, Y. & Gu, J. fastp: an ultra-fast all-in-one FASTQ preprocessor. _Bioinformatics_ 34, i884–i890 (2018). Article PubMed PubMed Central Google Scholar * Langmead, B. &
Salzberg, S. L. Fast gapped-read alignment with Bowtie 2. _Nat. Methods_ 9, 357–359 (2012). Article PubMed PubMed Central CAS Google Scholar * Skene, P. J., Henikoff, J. G. &
Henikoff, S. Targeted in situ genome-wide profiling with high efficiency for low cell numbers. _Nat. Protoc._ 13, 1006–1019 (2018). * Quinlan, A. R. & Hall, I. M. BEDTools: a flexible
suite of utilities for comparing genomic features. _Bioinformatics_ 26, 841–842 (2010). Article PubMed PubMed Central CAS Google Scholar * Subramanian, A. et al. Gene set enrichment
analysis: a knowledge-based approach for interpreting genome-wide expression profiles. _Proc. Natl Acad. Sci. USA_ 102, 15545–15550 (2005). Article ADS PubMed PubMed Central CAS Google
Scholar * Mootha, V. K. et al. PGC-1α-responsive genes involved in oxidative phosphorylation are coordinately downregulated in human diabetes. _Nat. Genet._ 34, 267–273 (2003). Article
PubMed CAS Google Scholar * Sanjana, N. E., Shalem, O. & Zhang, F. Improved vectors and genome-wide libraries for CRISPR screening. _Nat. Methods_ 11, 783–784 (2014). Article PubMed
PubMed Central CAS Google Scholar * Soares, F. et al. _CRISPR screen identifies genes that sensitize AML cells to double negative T cell therapy CRISPR screen identifies genes that
sensitize AML cells to double negative T cell therapy Short title: CRISPR screen uncovers biomarkers for DNT therapy Princess Ma_ (2021). * Halfmann, R. & Lindquist, S. Screening for
amyloid aggregation by semi-denaturing detergent-agarose gel electrophoresis. _J. Vis. Exp._ https://doi.org/10.3791/838 (2008). * Mukherjee, P., Raghava Kurup, R. & Hundley, H. A.
_Methods in Enzymology_ (ed. Jackman, J. E.) Vol. 658. p. 137–160 (Academic Press, 2021). Download references ACKNOWLEDGEMENTS We thank members of the De Carvalho laboratory for their
discussions and input. We would like to thank Princess Margaret Cancer Centre Genomics core (PM Genomics) for library preparation and sequencing on RNA-seq and CUT&RUN samples. This work
was supported by CIHR Foundation Grants (FDN 148430), CIHR Project Grant (PJT 165986), NSERC (489073), Canada Research Chair, New Investigator salary award (201512MSH360794-228629), Helen M
Cooke professorship from Princess Margaret Cancer Foundation, and Ontario Institute for Cancer Research (OICR) with funds from the province of Ontario to D.D.D.C., CIHR (FDN154328) to
C.H.A., NSERC (RGPIN-2019-07041) to M.D.W. and D.J.S., NSERC PGS D to D.J.S., and National Natural Science Foundation of China (No. 32400487) to S.F. The Structural Genomics Consortium (SGC)
is a registered charity (no: 1097737) that receives funds from Bayer AG, Boehringer Ingelheim, Bristol Myers Squibb, Genentech, Genome Canada through Ontario Genomics Institute [OGI-196],
EU/EFPIA/OICR/McGill/KTH/Diamond Innovative Medicines Initiative 2 Joint Undertaking [EUbOPEN grant 875510], Janssen, Merck KGaA (aka EMD in Canada and US), Pfizer and Takeda. AUTHOR
INFORMATION Author notes * These authors contributed equally: Shengrui Feng, Sajid A. Marhon, Dustin J. Sokolowski. AUTHORS AND AFFILIATIONS * Princess Margaret Cancer Centre, University
Health Network, Toronto, ON, Canada Shengrui Feng, Sajid A. Marhon, Fraser Soares, Parinaz Mehdipour, Charles Ishak, Helen Loo Yau, Ilias Ettayebi, Parasvi S. Patel, Raymond Chen, Shiyao
Ning, Cheryl H. Arrowsmith & Daniel D. De Carvalho * The First Affiliated Hospital of University of South China, Hengyang, Hunan, China Shengrui Feng & Annie Huang * Department of
Molecular Genetics, University of Toronto, Toronto, ON, Canada Dustin J. Sokolowski & Michael D. Wilson * Genetics and Genome Biology, SickKids Research Institute, Toronto, ON, Canada
Dustin J. Sokolowski & Michael D. Wilson * Department of Computer Science, University of Toronto, Toronto, ON, Canada Alister D’Costa & Jared T. Simpson * Ontario Institute for
Cancer Research, Toronto, ON, Canada Alister D’Costa, Philip C. Zuzarte & Jared T. Simpson * Ludwig Institute for Cancer Research, Nuffield Department of Medicine, University of Oxford,
Oxford, UK Parinaz Mehdipour * Department of Medical Biophysics, University of Toronto, Toronto, ON, Canada Helen Loo Yau, Ilias Ettayebi, Parasvi S. Patel, Raymond Chen, Cheryl H.
Arrowsmith & Daniel D. De Carvalho * The Cardiac Development and Early Intervention Unit, West China Institute of Women and Children’s Health, West China Second University Hospital,
Sichuan University, Chengdu, China Jiming Liu * Division of Hematology/Oncology, Hospital for Sick Children, Toronto, ON, Canada King Ching Ho & Annie Huang * Arthur and Sonia Labatt
Brain Tumour Research Centre, Hospital for Sick Children, Toronto, ON, Canada King Ching Ho & Annie Huang * Laboratory Medicine and Pathobiology, Faculty of Medicine, University of
Toronto, Toronto, ON, Canada Ben Ho & Annie Huang * Structural Genomics Consortium, University of Toronto, Toronto, ON, Canada Cheryl H. Arrowsmith Authors * Shengrui Feng View author
publications You can also search for this author inPubMed Google Scholar * Sajid A. Marhon View author publications You can also search for this author inPubMed Google Scholar * Dustin J.
Sokolowski View author publications You can also search for this author inPubMed Google Scholar * Alister D’Costa View author publications You can also search for this author inPubMed Google
Scholar * Fraser Soares View author publications You can also search for this author inPubMed Google Scholar * Parinaz Mehdipour View author publications You can also search for this author
inPubMed Google Scholar * Charles Ishak View author publications You can also search for this author inPubMed Google Scholar * Helen Loo Yau View author publications You can also search for
this author inPubMed Google Scholar * Ilias Ettayebi View author publications You can also search for this author inPubMed Google Scholar * Parasvi S. Patel View author publications You can
also search for this author inPubMed Google Scholar * Raymond Chen View author publications You can also search for this author inPubMed Google Scholar * Jiming Liu View author publications
You can also search for this author inPubMed Google Scholar * Philip C. Zuzarte View author publications You can also search for this author inPubMed Google Scholar * King Ching Ho View
author publications You can also search for this author inPubMed Google Scholar * Ben Ho View author publications You can also search for this author inPubMed Google Scholar * Shiyao Ning
View author publications You can also search for this author inPubMed Google Scholar * Annie Huang View author publications You can also search for this author inPubMed Google Scholar *
Cheryl H. Arrowsmith View author publications You can also search for this author inPubMed Google Scholar * Michael D. Wilson View author publications You can also search for this author
inPubMed Google Scholar * Jared T. Simpson View author publications You can also search for this author inPubMed Google Scholar * Daniel D. De Carvalho View author publications You can also
search for this author inPubMed Google Scholar CONTRIBUTIONS Conceptualization: S.F. and D.D.D.C. Methodology and experiments: S.F., F.S., P.M., C.I., H.L.Y., I.E., P.S.P., R.C., J.L.,
P.C.Z., K.C.H., B.H., and S.N. Data analysis: S.A.M., D.J.S., A.D.C., and S.F. Original draft: S.F., S.A.M., D.J.S., C.H.A., and D.D.D.C. Supervision: A.H., M.D.W., J.T.S., C.H.A., and
D.D.D.C. CORRESPONDING AUTHORS Correspondence to Shengrui Feng or Daniel D. De Carvalho. ETHICS DECLARATIONS COMPETING INTERESTS D.D.C. reports grants from Princess Margaret Cancer
Foundation, the Canadian Institutes of Health Research, and Canada Research Chair during the conduct of the study; grants from Pfizer, and other support from Adela, Inc outside the submitted
work. All the other authors declare no conflict of interest. PEER REVIEW PEER REVIEW INFORMATION _Nature Communications_ thanks Franck Bourdeaut and the other, anonymous, reviewer(s) for
their contribution to the peer review of this work. A peer review file is available. ADDITIONAL INFORMATION PUBLISHER’S NOTE Springer Nature remains neutral with regard to jurisdictional
claims in published maps and institutional affiliations. SUPPLEMENTARY INFORMATION SUPPLEMENTARY INFORMATION PEER REVIEW FILE REPORTING SUMMARY SOURCE DATA SOURCE DATA RIGHTS AND PERMISSIONS
OPEN ACCESS This article is licensed under a Creative Commons Attribution 4.0 International License, which permits use, sharing, adaptation, distribution and reproduction in any medium or
format, as long as you give appropriate credit to the original author(s) and the source, provide a link to the Creative Commons licence, and indicate if changes were made. The images or
other third party material in this article are included in the article’s Creative Commons licence, unless indicated otherwise in a credit line to the material. If material is not included in
the article’s Creative Commons licence and your intended use is not permitted by statutory regulation or exceeds the permitted use, you will need to obtain permission directly from the
copyright holder. To view a copy of this licence, visit http://creativecommons.org/licenses/by/4.0/. Reprints and permissions ABOUT THIS ARTICLE CITE THIS ARTICLE Feng, S., Marhon, S.A.,
Sokolowski, D.J. _et al._ Inhibiting EZH2 targets atypical teratoid rhabdoid tumor by triggering viral mimicry via both RNA and DNA sensing pathways. _Nat Commun_ 15, 9321 (2024).
https://doi.org/10.1038/s41467-024-53515-8 Download citation * Received: 01 March 2023 * Accepted: 12 October 2024 * Published: 29 October 2024 * DOI:
https://doi.org/10.1038/s41467-024-53515-8 SHARE THIS ARTICLE Anyone you share the following link with will be able to read this content: Get shareable link Sorry, a shareable link is not
currently available for this article. Copy to clipboard Provided by the Springer Nature SharedIt content-sharing initiative