- Select a language for the TTS:
- UK English Female
- UK English Male
- US English Female
- US English Male
- Australian Female
- Australian Male
- Language selected: (auto detect) - EN
Play all audios:
ABSTRACT Landscape fragmentation is statistically correlated with both increases and decreases in wildfire burned area (BA). These different directions-of-impact are not mechanistically
understood. Here, road density, a land fragmentation proxy, is implemented in a CMIP6 coupled land-fire model, to represent fragmentation edge effects on fire-relevant environmental
variables. Fragmentation caused modelled BA changes of over ±10% in 16% of [0.5°] grid-cells. On average, more fragmentation decreased net BA globally (−1.5%), as estimated empirically.
However, in recently-deforested tropical areas, fragmentation drove observationally-consistent BA increases of over 20%. Globally, fragmentation-driven fire BA decreased with increasing
population density, but was a hump-shaped function of it in forests. In some areas, fragmentation-driven decreases in BA occurred alongside higher-intensity fires, suggesting the decoupling
of fire severity traits. This mechanistic model provides a starting point for quantifying policy-relevant fragmentation-fire impacts, whose results suggest future forest degradation may
shift fragmentation from net global fire inhibitor to net fire driver. SIMILAR CONTENT BEING VIEWED BY OTHERS FIRE ENHANCES FOREST DEGRADATION WITHIN FOREST EDGE ZONES IN AFRICA Article 05
July 2021 ENVIRONMENTAL AND ANTHROPOGENIC INFLUENCES ON FIRE PATTERNS IN TROPICAL DRY DECIDUOUS FORESTS Article Open access 17 April 2025 NATIVE AMERICAN GEOGRAPHY SHAPED HISTORICAL FIRE
FREQUENCY IN FORESTS OF EIGHTEENTH-CENTURY PENNSYLVANIA, USA Article Open access 30 October 2023 INTRODUCTION Human land use change (LUC) affects a third of the terrestrial surface1, and the
resulting alteration of land continuity-known as fragmentation2 -can result in biodiversity loss3,4, habitat degradation5, changes to the surface energy balance6,7,8,9,10 and biogeochemical
cycling11, leading to around one-third of global carbon (C) emissions12,13. LUC is forecast to increase substantially by 2100, with expansions in agricultural and settlement areas across
all future climate-SSP scenarios of +12–83%14 and +54–111%15, respectively, over a 2015 baseline. Fire is a key component of earth system biogeochemical and ecological dynamics16,17,18,19,
however human-driven perturbations to global atmospheric and hydrologic circulations may alter existing fire regimes, changes that are expected to increase the future frequency and severity
of fire events16,20,21,22,23,24, the global area prone to frequent fire (+~30%)25, and their attendant economic costs26, hampering the ability of biological -and implicitly social -systems
to respond to broad -scale environmental change27,28. Fire and LUC interact at differing space-time scales via weather and vegetation29 through fuel structure and landscape fragmentation,
“the division of habitat into smaller and more isolated fragments”30. Human land fragmentation has existed for at least 10,000 years b.p.31, encompassing a spectrum of forms, rationales, and
cultural specificities32. The increasing yet spatially varying extent of fragmentation may have wide-ranging consequences for the fire regimes that present and future human activity embeds
in its surrounding environment, which may differ substantially across ecosystems and timescales. However, the underlying processes linking fragmentation and fire, and whether it drives or
inhibits fire activity, remains largely unknown.16,20,21,22,23,24,25,26,33,34,35,36 This uncertainty hampers the capacity of economic and infrastructural policy to consider its
implications28 for fire hazard, and hobbles understanding and forecasting of fire behaviour29. Context-specific studies have demonstrated both negative and positive interactions of
fragmentation with fire probability21,33,34,35,36, with meta-analyses suggesting on average that fragmentation tends to decrease landscape-scale burned area in grassland savannahs37,38, and
increase it in forest ecosystems33,38,39. However, these are limited in scope, scale, and number24, and do not directly determine the drivers of these associative relationships. The
‘fragments’ that make up fragmentation can be considered as isolated vegetation patches, each with an interior and an ‘edge’. The edge of a fragment is subject to a diverse range of
environmental impacts through their contact with the edge’s sparsely vegetated space, affecting plant and animal ecology40,41,42,43,44,45,46, microclimate9,47,48,49,50,51,52, and plant
physiology7,53. A fragment’s edge limit represents the point where the fragment’s interior vegetation is at a minimum, whereas the edge area represents the area between the fragment limit
and interior that is subject to a gradient of ‘edge effects’ (SI Text S3 for context). Fragments may influence fire probability and behaviour through edge effects, which might include soil
and fuel drying (increasing ignition probability and fire intensity near fragment edges), wind infiltration (increasing spread rate near edges), and ignition risks associated with the
combination of fragment edges and the presence of human populations (Methods). Real-world fragmentation today is predominantly driven by large-scale investment in LUC and access
infrastructure (i.e., roads)1,54,55,56 -the latter the direct cause of many of the LUC effects described by the above studies30,57,58. Recent statistical evidence demonstrates that RD is the
strongest predictor for the lower annual burned area at a global scale59, suggesting a fire-inhibiting effect in some places. Direct measurement of fire-fragmentation impacts is difficult
because it is an exercise in the counterfactual, asking: _what would fire outcomes be if fragmentation was/wasn’t here given that it isn’t/is here?_ Addressing this under controlled
unfragmented plot-scale conditions is possible, but may require removing key processes. Land surface modelling is a powerful tool in this context for handling the integration of
fragmentation-fire feedback and experimentation with worlds where fragmentation does and doesn’t affect fire. This enables the isolation of these effects in a way that is impractical to
achieve at in situ scales and conditions. Bridging these issues, this study is built around conceptualising and developing the process-based links between the edge effects of land
fragmentation on observed land surface and human ignition variables that can conceivably affect fire probability and behaviour. These were implemented in a global land surface model,
ORCHIDEE-MICT-SPITFIRE60,61,62, a commonly-used and fire-representing63,64 terrestrial branch of the [CMIP6] IPSL earth system model (Fig. S1b; see Methods and SI Text S11 for detail).
Modelling global fragmentation effects requires a global land fragmentation dataset. To our knowledge, current fragmentation datasets only cover forest biomes65, whereas most of the world’s
fires occur in grassland savannahs. Here, fragmentation extent is proxied through road density (RD) (SI Text S1). This is the only global-scale satellite-derived data available that might
capture fragmentation extent across biomes, and simplify analysis because roads are a fixed infrastructural feature in the medium term. Roads are used to define the edges of fragments
because LUC and subsequent fragment generation require overland access and represent a form of fragment boundary. Roads act, on the one hand, as a physical barrier to individual fire size
and spread59,66,67, while on the other, exposing vegetation to increased human contact, edge effects, and potential fire68,69,70,71. For modelling purposes, fragments can be simplified to a
single shape and size in a grid cell, given that grid cell’s RD (see SI Text S5). Doing so enables a ‘bottom-up’ representation of fragmentation’s impact on the state of environmental
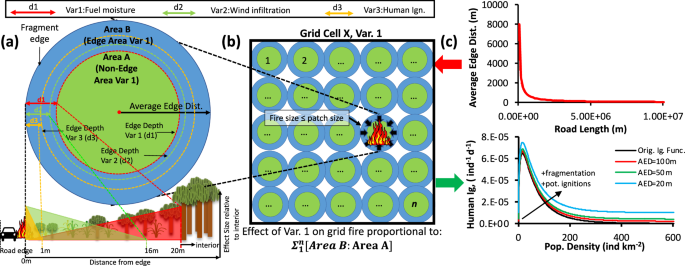
variables that affect fire probability and behaviour–the aforementioned ‘edge effects’ (Figs. 1 and S1, S2). The radii of our synthetic circular fragments provide the average Euclidean
distance from patch edge to interior, also known as the Average Edge Distance (AED, Fig. 2a). AED is input as a map to the ORCHIDEE model (Fig. 2a) and defines the relationships between land
surface variables and fire phenomena (Fig. 1a–c, Methods, Table 1, Fig. S1b). As fragmentation increases and AED decreases: (1) Individual fire size is restricted by patch size unless
threshold conditions for crown fire spread and fuel limitation in forests and grasslands72, respectively, are surpassed (_Methods_)64 (2) Vegetation is more exposed to human contact and
hence ignitions-potential through machinery, smoking, trash burning, etc.73,74 (_Methods_). (3) Fuel moisture and threshold fuel ignition moisture at the patch edge decreases due to edge
drying47,48,49,50,51, increasing fire occurrence and propagation potential; (4) Wind infiltration and hence speed at patch edges increases in forests only72 due to decreased surface
roughness75,76 Simulated fragmentation-fire impacts are benchmarked to observational data through comparison with remotely sensed statistical relationships of road fragmentation with respect
to burned area, which is the primary unit of account in global-scale fire ecology studies. Any correlation between the two is the emergent result of modelled relationships at grid-average
edge scale, not of model parameter ‘tuning’ towards observations (see Methods, SI Text S1, S2, S5). Our model implementation results in first-order reproduction of observed fragmentation
impacts on burned area (Results), enabling examination of emergent fragmentation impacts on other fire behaviour attributes, such as fire intensity -a measure of the combustion rate of fuel
per unit land surface area. Fire intensity may change because of fragmentation due to changes in the average state of fuel and rate of spread characteristics, such as wind speed, which are
dynamically calculated by ORCHIDEE. Intensity also benchmarks the area-specific vegetation carbon emissions of fires, which is calculated in ORCHIDEE, and which represents net global
emissions of ~1 billion tons CO2-C yr−1 77 (equivalent to ~10% of annual anthropogenic emissions). Here, we substitute area and vegetation-specific fire CO2 emissions (gC m−2 d−1) for ‘fire
radiative power’ (MW), a commonly-used intensity metric, as they are conceptually equivalent78 (SI Text S8) and ORCHIDEE does not resolve the latter. Global-scale ORCHIDEE fire simulations
were conducted at 0.5° grid-resolution over 2000-2013 with all fragmentation functions activated, in addition to a ‘control’ (‘CTRL’) simulation, with fragmentation deactivated (_Methods_).
A separate suite of ten sensitivity simulations, in which fragmentation was varied globally for all grid cells at decreasing two-fold increments of AED of 10,000 m, 5000 m … ~39 m (AEDF2),
were performed to study the incremental effects of fragmentation-doubling on the burned area at global and biome scale. These simulations were run from 2001-2003, straddling weak or neutral
El Niño/La Niña years. The context and definitions used in this study are summarised in SI Text S3, and study aims, rationale, and hypotheses are provided in SI Text S4. We stress that this
study does not seek to account for land use (fragment patch interior) impacts of fragmentation (e.g., deforestation, plantation), but the impact of fragment _edges_ in isolation. RESULTS
SIMULATED GLOBAL-SCALE FRAGMENTATION-INDUCED FIRE IMPACTS Fragmentation caused both decreases and increases in simulated time-averaged burned area (BAFrag–BACTRL = ΔBAFrag) depending upon
the region considered. The sum of gross (\(\Delta {{{\rm{BA}}}}_{{{{\rm{Frag}}}}.}^{-}\)) decreases amounted to −30 MHa yr−1, while gross increases (\(\Delta
{{{\rm{BA}}}}_{{{{\rm{Frag}}}}.}^{+}\)) were +25.6 MHa yr−1, equivalent to −3.25–6.5% and +2.25–5.5% of satellite-observed annual burned area79 (2001–2019), respectively (Fig. 2c, d)80,81.
Burned area changed by >±10% in 17%, and by >±25% in 7%, of burned grid cells, respectively. Areas with high levels of both fragmentation (Fig. 2a) and population density, simulated
the largest proportionate burned area decreases in response to fragmentation (Fig. 2c, d), such as in north-west Europe, California, and northeast-USA. Conversely, burned area and vegetation
combustion (Fig. S6) increases were simulated in areas with moderate fragmentation and population densities (Fig. S5a–c), e.g., Indonesia, eastern Brazil, the north Mediterranean, and parts
of Africa (e.g. the Eastern Congo Basin). Interestingly, in Mediterranean areas already prone to summer fire activity, e.g., Greece, the Balkans, southern Italy, northern Algeria, and
western Turkey, fragmentation causes substantial increases in simulated fire activity, which we suggest is the result of exacerbated human ignition potential, and enhanced propagation from
fuel desiccation and powerful wind fields in these regions. We evaluated the simulated statistical relationship between burned area and RD (solid lines, Fig. 2b) against the observationally
derived relationship from ref. 59 (dashed black line, Fig. 2b), who found that RD was the greatest predictor for _lower_ annual burned area values at global scale. This linear regression
comparison shows the simulated relationship replicates the observed slopes and intercept. However, the R2 coefficient is low when (I) considering all grid cells (black line, Spearman’s rho
(_ρ_) = −0.07, _R_2 = 0.05, _p_ < 0.001), but it is improved in (II) grid cells where road-fragmentation actively decreases individual fire sizes (see Methods for model code-based
filtering of attribution)64, as shown by the regression statistics for the red and blue regression lines in Fig. 2b. We attribute this low R2 to intrinsic differences between models and
observations: (1) ORCHIDEE simulates large numbers of small fires that can aggregate to low levels of annual burned area (bottom-left grey dots in Fig. 2b). Where realistic, these small
fires generally aren’t detected by existing satellite (e.g. MODIS) retrieval/processing mechanisms82. (2) Urban roads were not removed in ref. 59, potentially reflecting non-fragmentation
related factors that co-correlate with RD (e.g. fire suppression, large fire-retardant surface areas like concrete). (3) Comparing histograms of observed fire patch and fragment patch sizes
(Fig. S4a–c) shows that in general, fragment patches are much larger than observed maximum, minimum and mean fire patch sizes (other colours), meaning fire sizes physically-limited by the
size of fragments can only occur in a small minority of grid cells. Counts of small fragment patches are about two orders of magnitude lower than counts of small fire (areas A vs. B, Fig.
S4c), and fragmentation are only likely to constrain large fires (>1500 Ha). Twenty percent of terrestrial grid cells have no meaningful level of fragmentation, implying that
fragmentation will have no meaningful fire impact in these grid cells. This exposes the limits of fragmentation as a _physical_ constraint to fire size, although there may be other
_nonphysical_ constraints that we exclude. SIMULATED REGIONAL-SCALE FRAGMENTATION-FIRE IMPACTS General patterns in simulated regional ΔBAFrag are discernible in Fig. 2c, d, but robust
evaluation requires an observational dataset that removes and adds fragmentation while holding population density, vegetation, and climate constant–which is implausible. It is difficult to
validate model outputs with observations in places where modelled fragmentation decreases burned area, due to a lack of long-term burned area and/or any historical RD (or fragmentation)
data. Further, in one of the world’s most fragmented landscapes, north-western Europe (Fig. 2a), fragmentation largely decreases simulated fire activity (Fig. 2c), but we cannot validate
against this given much of European fragmentation predates the satellite era. However, we can compare observed and modelled fire activity in areas over which large-scale increases in
fragmentation have occurred during the period for which satellite fire observations exist (post-2000). This period coincides with the ‘boom’ years of globalisation83,84, in which lowered
regulatory power and multinational corporate demand85 incentivised large-scale supply of cheap commodities for global markets86. Large swathes of the global South1, most notably the forests
of Indonesia and Brazil87,88, were given over to clearing, logging and plantation/mining establishment89,90 that have been associated with systematic increases in fire activity30,91,92,93.
This provides a ‘before-after’ comparison of fire behaviour with fragmentation. We thus focus the grid cell-specific validation of simulation results on the tropics (SI Text S9), which also
happen to be amongst the biomes most prone to future fire-mediated systematic change45,94 (along with boreal systems27,28–see Discussion for boreal fragmentation-fire intensity impacts),
recognising the potential validation bias this presents. Figure 3a plots _f_\((\Delta {{{\rm{BA}}}}_{{{{\rm{Frag}}}}})\) in northern S. America, overlaid with data from ref. 95 that
identified where the running mean of burned area and a fragmentation proxy experienced significant [+/−] trends over 2003–2018. That study suggested Amazon rainforest-interior burned area
rose with fragmentation, but either fell or was unresponsive to fragmentation increases in the _cerrado_. Model output replicates a similar dynamic, whereby large \(\Delta
{{{\rm{BA}}}}_{{{{\rm{Frag}}}}.}^{+}\) values follow the ‘Trans-Amazonian highway’96 into the Amazon rainforest interior (Figs. 3a, S5c), while the _cerrado_ region sees burned area
decreases. Figure 3a’s model-data comparison is not entirely commensurate as ref. 95 identify temporal trends in fragmentation and _total_ burned area to approximate if and where they are
correlated, whereas our fragmentation input is static. Thus, in _cerrado_ areas that are subject to large climate-driven interannual variations in drought and fire extent, aggregate burned
area trends may overwhelm fragmentation burned area effects. The inverse may prevail in the wet Amazon, where fragmentation can dominate fire causation34,39. Large simulated \(\Delta
{{{\rm{BA}}}}_{{{{\rm{Frag}}}}.}^{+}\) in the deep interior Amazon where ref. 95 find no significant trends (no data points) reflect large fractional increases in simulated fire over a low
baseline -fires not detectable by MODIS sensors. A similar comparison was performed for Indonesia and Malaysia (Figs. S7 and S5b), where deforestation and fragmentation have been rampant in
recent decades. Comparing grid cells where simulated and observed burned area increased between 2000–2019 over a 1982–1999 baseline97,98 and identifying where model and observation agreed,
these were overlaid with markers identifying where significant deforestation99 and plantation inception100 occurred since 2000 (Figs. S7, S8, S9, S5b). In highly-fragmented Borneo/Kalimantan
and Sumatra, model-data agreement was found for 58% of grid cells that experienced an observed increased of burned area, of which 67% were areas of known significant deforestation and/or
plantation establishment. This broadly agrees with ref. 101, which found that human activity had amplified (but may not dominate) drought-related fires there. Model-data disagreement was
more pronounced in fire-susceptible drained peatland regions102,103,104,105, an expected result given ORCHIDEE does not represent tropical peat or soil burning (itself a loose model
validation). Simulated average gross \(\Delta {{{\rm{BA}}}}_{{{{\rm{Frag}}}}.}^{+}\) values in the Amazon and Indonesia are equivalent to ~27% and 24% of observed average annual burned
area81, respectively, suggesting fragmentation is a powerful driver of fire activity in these two regions. Road fragmentation may thus describe the linkage between initial deforestation and
dry season severity106 to promote fires that would otherwise not have spread107,108. FRAGMENTATION’S RELATIONSHIP WITH POPULATION DENSITY, CARBON EMISSIONS AND INTENSITY, AND REGIONAL-SCALE
FIRE VULNERABILITY We look at how simulated biome-specific response of fire to fragmentation as population density (PopD) levels change, to provide broad insight into fire regime evolution
with increasing human landscape encroachment. The relationship of simulated fragmentation-derived fractional burned area _f_\((\Delta {{{\rm{BA}}}}_{{{{\rm{Frag}}}}.})\) changes with
population density for each global biome, as well as the corresponding generalised additive model (GAM) trend for each is shown in Fig. 3b. Tropical forest exhibits a clear hump-shaped
increase in simulated fragmentation burned area at low-to-moderate population levels, reaching a maximum at ~0.5 individuals km−2 (asterisk, Fig. 3b)) before decreasing toward zero, and is
the only biome where a fragmentation-related increase in burned area is _more_ important than a decrease. In temperate forests, fragmentation decreases burned area at low and high population
density and increases it at moderate levels (max = 50 individuals km−2). Boreal forests appear relatively unaffected by changes in population, although this may be because they generally
hold low population densities109. Temperate grassland fragmentation slightly increased burned area at low PopD levels, and decreased dramatically at high levels. One of the central goals of
integrating a fire model with a land surface model is to quantify the effects of fire on the terrestrial carbon (C) cycle. Globally, the impact of fragmentation on simulated fire C-emissions
is similar to that of simulated burned area, with a net reduction of ~−1% (−0.02 PgC yr−1) of global emissions. Conversely, fragmentation’s impact on the fire emissions of specific biomes
(Fig. S6) suggests that it tends to increase them in tropical, temperate, and boreal forests, despite a net-negative impact at the global scale (see Fig. 2c, d; SI Text S10). This is
highlighted in Fig. 4a, which shows substantial areas of forested biomes where simulated area-specific fire C-emissions -a proxy for fire intensity-increase due to fragmentation even where
it causes burned area decreases (SI Text S8). This is particularly true of boreal (per ref. 71) and to a lesser extent, tropical forests. This model result implies that fragmentation can
reduce burned area while increasing the intensity of the fires that do burn, as suggested by ref. 109 regarding human impacts on fire activity in boreal Russia, and is also of relevance to
observed increases in global fire intensity over the last 20 yrs110. Understanding high-intensity fires is important because they are (a) harder to extinguish, (b) consume more fuel and, as
such cause more _immediate_ damage to terrestrial ecosystems, (c) are of importance to understanding the potential carbon cycle impacts of fragmentation-induced fire behaviour, To understand
how different regions respond to fragmentation independent of contemporary RD distributions, ten global sensitivity simulations were run where the AED of all grid cells was set to equal 9
factor-of-two values (F2) of AED from 10,000 m to 39 m (AEDF2, see Methods). We compared the fractional change in burned area of grid cells _between each_ sequential level of fragmentation
_f_\((\Delta B{A}_{\Delta F2})\) as a measure of biome-scale fire sensitivity to fragmentation. Burned area declined everywhere as fragmentation increased when averaged over all AEDF2 levels
(Fig. S11), however burned area decreases were lowest in tropical and boreal forest regions of the world (Fig. 4b, S11). We aggregated these burned area changes to a biome-scale average for
each simulation. Fragmentation doubling caused simulated biome-specific burned area decreases _f_\((\Delta B{A}_{\Delta F2})\) of −7.5% (Tropical forest); −15% (Temperate forest); −19%
(Boreal forest); −30% (C3 grasslands); −22% (C4 grasslands). On average, burned area decreased monotonically for almost all biomes with two-fold increases in fragmentation level (Figs. S11
and S12). Simulated burned area begins to decrease at different AED levels for different biomes (Fig. S11), implying differential biome-average fire sensitivities to land fragmentation. For
example, to reach the same fractional decrease in burned area (−5%) due to fragmentation, an average tropical forest grid cell requires an additional road length (RL) of 2.5 km km−2 (~6000
km grid−1), highlighting the higher resistance of the tropical biome to fragmentation-associated burned area reductions (Fig. S11). DISCUSSION This study has hypothesised (SI Text S4) that
simple treatment of four model processes by globally averaged parameters and by a proxy for fragmentation would be sufficient to broadly reproduce its statistically-observed burned area
effects. In rejecting the null, this study provides tentative model-based inference of fragmentation theory, by identifying and quantifying the central drivers of the fragmentation-fire
link. While our fragmentation representation relies on empirical and mathematical/probabilistic constraints to test these hypotheses, and outputs appear to correspond well to available
empirical data, the conceptual and hypothetical nature of its construction means that there is substantial uncertainty inherent to parameterisations used (SI Text S5), the vegetation and
biome-specificity of fragmentation effects and the completeness of relevant process representations. As a result, caution should be taken in their interpretation, particularly with respect
to policy. We suggest that the _absolute_ changes in model outputs here are to be treated as highly uncertain, while the _relative_ changes, at least in sign if not necessarily precise
value, are reasonable by global modelling standards (see SI Text S6 for further discussion). Our universal modelling approach may neglect culture-specific interactions with fragmentation and
fire that result in managed fire ecology outcomes31,111,112. However, roads are both _result and instrument of_ financial capital, a known driver of cultural homogenisation113: While
cultural diversity is correlated with biodiversity114, the strongest negative predictor of culture globally is RD115. Places where road fragmentation and its impacts are high are thus those
least likely to host the forms of local cultural attunement that are best suited to their environment, and are likely of limited relevance to this study (see SI Text S7). Model
representation could be improved by discriminating between road-types, although the empirical impact of these on edge effects is currently unknown. The extent of fragmentation estimated here
is likely substantially underestimated in some places due to (a) input RD low bias; (b) omission of other fragmentation sources in the AED proxy (SI Text S1). This may bause underestimation
of fragmentation fire effects, particularly in tropical forests where bias may be particularly high. Because the AED input map is static, year-by-year interpretation of output is
problematic, and provides impetus for the production of higher resolution and better-identified gridded RL timeseries maps. In some areas fragmentation may result in significant decreases in
standing vegetation biomass, relative to historical ‘equilibria’, thereby reducing fuel load, potential area-specific fire intensity, and so spread potential. Thus, the dampening effect of
fragmentation on burned area may in some places have more to do with biomass/fuel diminishment than the patch area-determined fire breaks represented here. In this vein, we caution there
being no direct equivalence between the observed and modelled finding that fragmentation reduces aggregate fire activity, and socio-ecosystem-level management considerations. Taken to its
extreme, the aim of reducing fire risk in this way could justify wiping out most vegetation in an area. This study’s parsimonious representation of land fragmentation based on RD enables a
simplified first estimate of its impact on fire probability and behaviour in a land surface model. This reproduced observed relationships between land fragmentation and fire probability at
global and regional scales. Fragmentation has globally significant impacts on burned area, and may be a major driver of fire activity at regional scale. While reproducing the observed
decreasing relationship of burned area with RD, our analysis highlights that this physical fragment constraint remains largely limited to dampening larger fires (Fig. S4). Broadly, our
results mirror what is known only anecdotally, while providing explanatory quantification and future projection potential for such relationships at global scale. This allows: (1) Identifying
how and which edge effects may increase fire behaviour in specific locations/biomes, facilitating remediating action; (2) Dynamic forecasting of how projected changes in fragmentation/RD
may impact fire behaviour in the future; (3) A first step towards policy assessment of fire risk and social welfare when considering fragmentation-relevant policy directives. The methodology
applied here also provides a route for large-scale modelling of other fragmentation or linear-feature effects in earth, ecological30,34,57,116 and epidemiological sciences107,117. Climate
warming, population density, and LUC-driven fragmentation will increase in the future, with socioeconomic effects of the greatest magnitude forecast in the tropics118. Fragmentation largely
increases tropical fire activity, meaning it may become a major driver of burned area there in the future. This suggests fragmentation could eventually ‘tip’ towards a global net-positive
burned area phenomenon with future tropical forest degradation and fire activity, in a potential feedback loop. Ultimately, fragmentation-suppression of wildfire could still cause extreme
fires as a direct result119. This may place a greater burden on countries in these regions to balance economic policy with the environmental and welfare consequences of fire risk those
policies may entail. With a higher degree of spatial, process, and variable resolution, future iterations of this model format may be useful for assessing the potential fire risks underlying
such policy, particularly in ecosystems vulnerable to fire activity and shortening fire regimes. METHODS MODEL DESCRIPTION ORCHIDEE-MICT-SPITFIRE integrates dynamic vegetation/fuel with
climate, ignitions, and fire physics73,120,121 and is a participant in the Global Fire Model Intercomparison Project (FireMIP122,123,124). ORCHIDEE-MICT is a global-scale, grid-resolution
model generally employed at 0.5 to 2 degrees, with boreal and permafrost-specific adaptations for high latitude biomes that affect soil, vegetation, hydrological, and thermal processes
specific to those latitudes. These process representations are particularly important in the context of this study for the modelling of future fire-vegetation-hydrological interactions. The
model is carbon based, in that it ultimately denominates earth system dynamics through their impacts on the C cycle, by which energy, soil, water, and climate drive fluxes of C through the
system via vegetation and associated biological and ecological processes. Thus, photosynthetic C is fixed by 11 plant functional types (PFTs), doing so differentially as each PFT is subject
to specific primary production, senescence, and C dynamics. The spatial distinction between PFTs can either be forced through an input vegetation map, defining the fractions of each grid
cell covered by each PFT, or through the dynamic global vegetation model in ORCHIDEE, which predicts PFT type and allocation according to the biophysical suitability of each PFT to primarily
climatic input variables. Fixed C is then allocated to foliage, fruit, roots, above/below-ground sapwood, heartwood, and C reserves, that upon death or senescence are shunted to two
reactivity-differentiated litter pools. ORCHIDEE-MICT is hard-coded with an adaptation of the SPITFIRE fire module63,73,125,126, which divides the aboveground vegetation components described
above and apportions them to potential fuel type categories differentiated by their potential time to oxidation. Fire ignitions are controlled by a positive linear function of lightning
flash density and are an increasing then decreasing function of human population density, with maximum human ignitions occurring at 20 individuals per square kilometre and declining
thereafter. Vegetation flammability is determined by fuel and climatic conditions (Nesterov Index and Fire Danger Index). The area burned in an individual fire event is determined by the
rate of fire spread and fire duration, as influenced by vegetation flammability. Fire CO2 emissions depend on vegetation biomass, fire intensity and duration. See Supplement for further
model description of ORCHIDEE-SPITFIRE. FRAGMENTATION REPRESENTATION Global-scale representation of fragmentation-fire interactions must first overcome three problems. First, fragments
occupy a wide range of morphologies that cannot be represented explicitly at the sub-grid scales required by existing model resolutions. Second, although the lack of an extant fragmentation
metric might be overcome through a proxy, this proxy must be continuous and operable at sub-grid scale (SI Text S11). Third, the edge-interior characterisation of fragments requires that
gradients of properties related to fire susceptibility exist between these two states, raising the problem of how to represent such gradients given patch shape-size heterogeneity, for which
predictive relationships with fire specifically do not exist. Here, these are resolved through the use of roads as a fragmentation proxy and the simplification of fragments to a single
‘average’ shape and size in a grid cell, given that the grid cell’s RD is such that all patches in a grid can be reduced to an average ‘disk’ size. This enables conversion of empirical data
on fragment ‘edge effects’ -a transect from fragment length to fragment interior whose length is defined by a gradient in the state of a variable (e.g., soil temperature) -as a function of
the patch radius. In the literature on fragment edge effects, these effects are typically studied and reported in transects along a gradient of distance from fragment edge to interior.
Fragments can be of any shape or size, meaning that at grid-scale, such sub-grid edge effects due to shape heterogeneity are extremely difficult to resolve or represent. Because global
gridded RD data used here gives us the RL per grid, our method which uses this to calculate the average patch size based on an assumed circular patch shape, and hence ‘Average Edge Distance’
(radius), provides an elegant solution to representing these empirical edge effects: Any distance from the ‘edge’ (circle perimeter) to the interior (anywhere along the radius) can be
calculated for all patches and applied to all fragmentation affected variables, thereby integrating the observed edge effects in a consistent and universal way at grid scale. The average
edge distance (AED) per grid (\({AE}{D}_{G}\)) given per-grid RL sum (\(R{L}_{G}\)) was solved analytically and is given by the following: $${{AED}}_{G}=(2 * {{Area}}_{G} * f({Cont}))/\sum
\left.({{RL}}_{G})\right)$$ (1) Where _Area__G_ is the grid area in _m_2, and _f_ (_Cont_) the fraction of each grid cell area taken up by the continental landmass. The gridded RL dataset in
Meijer et al. (2018) gives a global RL estimate that is about 50% lower than that estimated by the World Road Statistics database (~30 million km), and ~300% lower than the estimate
provided by the CIA _World Factbook_. Furthermore, a recent report127 showed that the Global Roads Inventory Project (GRIP) database consistently and strongly under-predicted the existence
of small roads, leading to large low biases against manually observed road data in the report’s two case study sites in the Congo and Canada. The primary reason hypothesised for these
mismatches, which are acknowledged in ref. 56 paper, is the under-representation of unofficial and unpaved roads in their source database. GRIP was shown to under-represent total manually
measured RL in a grid cell by a factor of over 8 in one area (Fig. 19 of ref. 127). For this reason, in Eq. 1, which generates the AED map used as input to ORCHIDEE, we make the assumption
that the gridded RL data underrepresent actual RL by a factor of 2, which implies a total global RL roughly in between the WRS and CIA estimates. Further, as river and stream length as well
as large topographic discontinuities can reasonably be expected to act as fire breaks in most circumstances, and given that these are excluded from the input data, we take these to be
potentially integrated into the factorial AED map. We acknowledge that multiplying RL uniformly by a single factor masks the likely spatial distribution of bias inherent to the GRIP
database; however, given that the source bias has not been assessed or quantified, we retain this spatial uniformity assumption for simplicity in this study. In order to modulate the effects
of fire by fragmentation, ORCHIDEE must first be fed a gridded input map containing the AED data. This is derived from56, which gives global gridded RL in m km−2 at 5 arc-minute (~8 km)
resolution for a single time period (~2017), downloaded from (https://zenodo.org/record/6420961, accessed 20/11/2022), converted to netcdf format and regridded to this study’s simulation
resolution of 0.5° (~50 km) using the conservative interpolation function in the Climate Data Operator (CDO) package128. The raw data were provided in five classes of road type: highway,
primary, secondary, tertiary, and local. Although we can reasonably expect each of these road classes to represent different scales of fragmentation, each conferring differential effects in
their relation with fire phenomena, the paucity of empirical data on what these might be, coupled with the range of impacts that may, as mentioned be contradictory, mean that for the moment
we take all road classes to be equal in effect, and as such sum them to a single RL density variable. Eq. 1 is then applied to the dataset to generate a global gridded map of the average
circular patch radius associated with each grid cell (\({AE}{D}_{G}\)). Next, we assume that spatially extensive fires do not occur on land that can be considered ‘urban’. This assumption is
made on the basis that urban areas are characterised by very low fuel densities (compared to, say, a pine forest), large areas of concrete, asphalt and steel, which do not burn easily, and
high population densities that strongly increase the probability of successful human fire suppression. Because RD in urban areas is very high, this assumption should also require that the
urban proportion of RD in each grid cell is removed from the original RL data, and a corresponding AED map generated. To do so, we download the output data from [ref. 55] which gives the
urban area fraction (UAF) of grid cells at global 0.125° resolution, and projects this variable globally to 2100 under the Shared Socioeconomic Pathways (SSP) scenario suite:
(https://dataverse.harvard.edu/dataverse/geospatial_human_dimensions_data, accessed January 12, 2023). We then plotted a simple linear regression between the 2018 UAF data and the original
RL, giving a relationship between the fraction of urban area in a grid cell and the RD of that grid cell (RL = ((2.68∗104)∗UAF) +292; R2 = 0.43), where 2.68∗104 = is the regression
coefficient (αUAF, Table 1). The RL data were split into categories of urban fraction, whereby each grid cell was allocated to one of twelve UAF bins, corresponding to [0–1, 1–5, 5–10,
10–20, 20–30…90–100 percent] and the equation was used to estimate the implied RD at the numerical midpoint of each bin. Thus, on the basis of the RL/UAF regression, a RL per unit UAF was
allocated to each of the UAF-based classes, multiplied by the actual UAF of each grid cell given its UAF, and the resulting ‘excess’ RL subtracted from the original RL data, to give an
‘effective’ RD and AED value. The resulting AED ‘fragmentation’ map can be compared to the original, and shows that in removing the impact of urban area roads on the representation of
fragmentation, the world’s most fragmented landscapes are no longer found in north-west Europe but in the north-eastern United States and, e.g., Bangladesh. This is likely indicative of
extensive non-urban infrastructural sprawl in the former, and a symptom of uniformly high population density and low to medium intensity and highly extensive agricultural land use in the
latter, meaning that roads criss-cross large parts of the country (see Fig. 1a). We chose to use UAF bins and calculate the RD at their midpoint instead of direct application of the
regression equation because the latter's scatter is substantial, with binning more closely approximating the statistical value envelope. DESCRIPTION OF FIRE-FRAGMENTATION DYNAMICS FIRE
SIZE In ORCHIDEE, total burned area per timestep is given by the product of average _individual_ fire size in a given grid cell, and fire number. Because it has been shown in an anecdotal
number of studies38 that for forests, fragmentation leads to decreases in fire size, and at the same time, ref. 59 showed that the single strongest negative determinant of burned area at
global scale is RD, we first approach fragmentation representation by decreasing the potential size of an individual fire as fragmentation increases. This is done first by assuming that the
maximum individual fire size is a multiple (\({n}_{{Pat}}\)) of a grid cel’'s AED-determined mean patch area. This is because fragmentation may delimit the boundaries of fire spread in
many circumstances, the circular AED-derived patch area is itself only an average, and large variations in patch size will be the reality, with some patches much larger than others. In
addition, it lends a lower degree of restriction of fragmentation on fire size, allowing for the real-world possibility that fires can spread beyond the borders of the original vegetated
patch. \({n}_{{Pat}}\) allows for future refinement of model representation when empirical relations between sub-grid-scale fragment size distribution and propensity for spread become known.
In the absence of such data, we set \({n}_{{Pat}}\left({forest}\right)\) =1 and \({n}_{{Pat}}({grass})\) =1.25 (Table 1). We reason this because the observed individual fire size
distribution is highly skewed towards small fires when compared to the fragment sizes defined by AED (see Fig. 2d), and because statistical treatment of observations suggests road
fragmentation is a strong determinant of lower aggregate burned area59. Without any empirical data to work with, we assume that maximum fire size is limited to the fragment size unless the
conditions for extreme fire are met. Thus, the relation between fragment size and maximum fire size is equal to, or given a multiplier value of, 1.0. We slightly increased grassland fire
size limitation by AED by 25% above above this value (1.25) due to the relative ease fine fuels in grasslands to more easily ignite and be carried over road barriers by wind (see SI Text S5
on Assumptions). FIRE SPREAD THRESHOLDS To introduce added realism and further reduce the restrictiveness of the fragmentation representation, the AED-denominated limit on individual fire
size is only applied when separate conditions are met for forests and grasslands. For forests, if the simulated fire intensity and flame height exceed canopy base height, which is the
pre-existing condition for canopy scorch in the original version of SPITFIRE63, and the condition for crown fire spread in an upcoming version (Bowring et al., in prep.) then no size
limitation is imposed: $${{{{\rm{FST}}}}}_{{{{\rm{TREE}}}}}={{{\rm{True}}}}.{{{\rm{IF}}}}.\,:{{{\rm{SH}}}} > ({{{{\rm{H}}}}}_{{{{\rm{TREE}}}}}-({{{{\rm{H}}}}}_{{{{\rm{TREE}}}}}
*{{{{\rm{CL}}}}}_{{{{\rm{TREE}}}}}))$$ (2) Where FSTTREE is the fire spread threshold (Table 1), SH is the mean fire scorch height, _H_TREE the mean tree height, CLTREE the mean crown
length. This is done to account for the possibility that high-intensity forest fires can’t ‘jump’ over roads through crown spread, particularly if meteorological conditions for doing so are
favourable. When this condition is met, fire spread and fire size are calculated as in the original SPITFIRE formulation. Second, over grasslands, ref. 72 found that a critical threshold
limiting fire spread (FSTGRASS), and hence fire patch size, exists in grasslands, which results from grassland fuel connectivity as given by area-specific fuel mass (tons Ha−1). They showed
that if this 2.4 tons Ha−1 grass wet mass threshold is reached, even fuel at 100% moisture was able to burn. Thus, individual fire size limitation due to fragmentation on ORCHIDEE grasslands
applies only to instances where the simulated grass fuel mass is below this biomass threshold, and are otherwise allowed to spread freely, as in the original SPITFIRE formulation:
$${{{{\rm{fGrass}}}}}_{{{{\rm{WW}}}}}=\Sigma
({{{{\rm{F}}}}}_{1{{{\rm{hr}}}}}+{{{{\rm{F}}}}}_{10{{{\rm{hr}}}}}+{{{{\rm{F}}}}}_{100{{{\rm{hr}}}}}+{{{{\rm{F}}}}}_{1000{{{\rm{hr}}}}}+{{{{\rm{F}}}}}_{{{{\rm{Live}}}}}) *(1/0.45)$$ (3)
$${{{{\rm{FST}}}}}_{{{{\rm{GRASS}}}}}={{{\rm{True}}}}\,\cdot{{{\rm{IF}}}}\cdot\,{{{{\rm{fGrass}}}}}_{{{{\rm{WW}}}}} > \,2.5{{{{\rm{tHa}}}}}^{-1}$$ (4) Where fGrassWW is the summed weight
of grass and grass fuel, _F__n_hr refers to the different ‘hour’ fuel classes in ORCHIDEE, _F_Live is live grass and (1/0.45) is the conversion of dry biomass to wet weight. Note that this
ensures that the fragmentation model is able to account for the likely increases in extreme fire weather projected by future scenarios of climatic change. In a hot and dry season, a
combination of fuel availability, low fuel moisture and high heat will enable an ignited fire to reach fire-high reaction intensities, allowing high fuel consumption and flame heights to
exceed those of the canopy and permit crown fire spread between forested patches. Likewise, fuel-limited grassland fires will, in dry seasons preceded by high pre-fire-season grass growth
rates, spread when the medium of connectivity (fuel) is sufficient. Conversely, if there is insufficient fuel (i.e., prolonged drought), fire will not be able to spread between patches.
Please see SI text S5 for further discussion of these parameterisations and their assumptions. HUMAN IGNITIONS Because the characterisation of fragmentation applied here is definitionally
anthropogenic, it follows logically that an increment increase in RL in a given area exposes that length to human contact. Human contact, in turn, increases the risk of human ignitions,
either through intentional (e.g., arson) or unintentional action (e.g., discarded cigarette butts, machinery, power lines, sunlit beer bottles, etc). In ORCHIDEE, human ignitions are
controlled as a non-linear increasing then decreasing function of human population density (Fig. S3b), to reflect the fact that ignitions are more probable, and suppression less likely, when
population density is low but not extremely sparse, such that the number of human ignitions (\(I{G}_{H}\), Ha−1 d−1) is given by: $${{IG}}_{H}={PopD} *k({PopD}) *a({Nd})/10000$$ (5)
$$k({PopD})=30 *{e}^{-0.5 *\surd ({PopD})}$$ (6) Where \({PopD}\) is population density and \(a({Nd})\) an observationally-estimated parameter representing ignitions per person per day, set
at 0.0163,73. Here, we assume that an increase in fragmentation causes an increase in the probability of ignitions in direct proportion to the ratio of edge area: patch area, assuming
conservatively that the human interaction with an edge can be characterised by a 1 m edge depth (EDHumig., i.e. a 1 m increment into the radius of the assumed circle). This 1 m edge depth
assumption is equivalent to the depth from the patch edge (i.e., road) which is potentially subject to increased fire ignitions due to human contact (potentially resulting in fires through
arson, cigarettes, machinery, etc). The 1 m edge is assumed and low because although human effects on ignition may occur deeper into a patch, the time-averaged edge depth that they do so
along the length of fragment edges is likely small, so we hold this parameter at unity. This transforms the perimeter from a length to an area, allowing us to probabilistically modulate the
ignition function directly by the area represented by the total fragmentation edge area present in the grid. We then adjust the human fire ignition function (\(I{G}_{H}\)) in SPITFIRE73 by
the product of the number of patches that fit into a grid's area (\({Are}{a}_{G}\)) and the cumulative fractional grid area of the ignition surface as defined by the assumed 1 m
ignition edge depth to arrive at a fragmentation-affected ignition function (\(I{G}_{{HFrag}}\)), as illustrated in Fig. S1b: $${{IG}}_{{HFrag}}={{IG}}_{H}+\left(\right.(({{Area}}_{G}/(\pi
*{{AED}}^{2})) *((2\pi *{AED} *1)/{{Area}}_{G})/10,\!000)$$ (7) Thus, an AED of 20 m yields a potentially increased ignition surface amounting to ~10% of a grid cell’s area. This probability
is scaled to the ignitions person−1km−2d−1 as a constant (/10,000), and results in significantly increased ignitions at low and high population density when fragmentation is high, which
decreases exponentially as fragmentation decreases (AED increases). This is clearest at high population densities, where the suppression effect of high population is counteracted by
fragmentation (Fig. S1b). Please see SI Text S5 for further elaboration on the assumptions inherent to this parameterisation. FUEL WETNESS Landscape fragmentation studies across many
forested biomes have found that soil temperature and moisture were significantly higher and lower, respectively, at forest patch edge than in the patch interior47,48,49,50,51, with
subsequent impacts on fuel moisture and fire ignition and spread probabilities. After a review of the literature of edge-to-interior effects on soil moisture, which measure transects of soil
moisture from fragment edges to their interior at different depths in the soil, we find that the distance from the edge at which the gradient is effectively zero average at ~50 m48,108,
increasing to hundreds of metres in deeper soils. For air temperature129, find it is at 20 m in Korean temperate forest130, at 15 m in the Swiss Jura mountains131, at <10 m (depending on
time-of-day) in a sharp tropical forest fragment edges, around 50 m at Brazilian Amazon transitional edges132, while48 show that it sits at ~5 m to 75 m in European deciduous forests,
depending on the vegetation density and mean annual temperature of the fragment concerned. We did not find any data relating litter or ‘fuel’ temperatures to fragment edge-to-interior
gradients. We represent this by simply using the relative areas of patch area and edge area to define the proportion of a grid cell made subject to edge drying. Thus, we calculate the ratio
of the edge area to patch area (the edge-to-patch ratio, EPR), and assuming conservatively that the ‘edge-to-interior’ gradient through which temperature and soil effects are significant can
be defined as the 20 m from the edge inwards (this is the distance to which edge-interior soil moisture and temperature gradient in the above studies falls to approximately zero). This is
then the area subject to increased drying and higher temperatures owing to fragmentation: $${EPR}=((\pi *{{AED}}^{2})-(\pi *({{AED}-10})^{2}))/(\pi *{{AED}}^{2})$$ (8) In ORCHIDEE-SPITFIRE,
each fuel class in each grid cell is allocated a simulated fuel moisture content (\({We}{t}_{{FC}}\)). In addition, there is a moisture threshold for each fuel class above which fuel
consumption by fire no longer occurs (\({Thres}{h}_{F{C}_{{{\mathrm{1,2}}}}}\)), where the subscripts refer to the 1 hr and 10 hr fuel classes subjected to edge drying. The 100 hr fuel class
is not affected in this scheme, as we assume that the diameter of 100 hr fuel is sufficiently high to preclude edge drying from affecting its sensitivity to ignition. Here, both the
calculated wetness and the ignition threshold were used to proxy edge fuel drying, and are both lowered by the product of the fractional edge-to interior moisture gradient with \({EPR}\).
$${{Wet}}_{{FC}}={{Wet}}_{{FC}}-((0.25/2) *{{Wet}}_{{FC}} *{EPR})$$ (9) $${{Thresh}}_{F{C}_{1,2}}={{Thresh}}_{F{C}_{1,2}}-((0.25/2) *{{Thresh}}_{F{C}_{1,2}} *{EPR})$$ (10) Whereby 0.25 is
the ~25% fractional soil moisture gradient difference between edge and interior found across the field studies cited above. Effect sizes ranged from ~10–40%, with most data-aggregated
transects at 15–30% (see also ref. 133). Since we take the edge depth (EDMoisture) to be 20 m, and assume a linear moisture gradient from 0–20 m, half of the maximum gradient is taken as the
average decrease in soil moisture owing to fragmentation over the length of the edge, and total grid fuel wetness is then affected by the fractional area occupied by this edge. WIND SPEED
AND RATE OF SPREAD Increasing fragmentation results in an increasing proportion of the landscape subject to a perimeter through which wind can travel with relatively less interruption. In
other words, there is less of a barrier to wind at the patch edge local surface roughness is lower, wind speeds are higher, and a larger proportion of the landscape is subject to these
higher winds as fragmentation increases (e.g., ref. 9). We treat this in ORCHIDEE by reducing the pre-existing model wind speed reduction factors at atmospheric versus ground level by an
analytically resolved factor derived from the implicit amount of fragment edge derived from AED. Specifically, we reduce the pre-existing reduction in windspeed due forest coverage in
ORCHIDEE by the grid-areal proportion given by a parameterised 16 m mean edge depth (\({{ED}}_{{WIND}}\)). We based our parameterisation on Davies‐Colley et al.134 who showed for forests in
New Zealand that differences in the windspeed gradients between fragment edge and interior approached zero somewhere between the 10 m and 20 m mark along their transect (which include 0 m, 5
m, 10 m, 20 m, 40 m, 80 m measurement loggers with respect to distance from fragment edge). For the edge depth of wind infiltration, we settled on an ‘in between’ value of 16 m. Effective
\({{ED}}_{{WIND}}\) is actually 4 m, since at any time in any patch, we assume the wind can only come from one of four idealised wind directions so that at the grid-scale average,
\({{ED}}_{{WIND}}\) is divided by 4 in model implementation. We then reduce the fixed forest wind reduction factor (\({WRF}=0.4\)) in SPITFIRE proportional to the areal coverage of the
fragment perimeter given by effective \({{ED}}_{{WIND}}\). $${f}_{{EDGE}}={{Area}}_{{patch}}/{{Area}}_{{edge}}$$ (11) $${WRF}={WRF}-{{ED}}_{{WIND}}$$ (12) Increases in windspeed due to
fragmentation in turn affects the fire ROS in areas that are considered substantially fragmented, leading in principle to increased burned area within the patch area and (with the increase
in fuel combustibility as a function of dryness and Fire Danger Index), potentially greater _area-specific_ total combustion, fire intensity, and C emissions, potentially decoupling burned
area from ECO2 (Fig. 1b). The fragmentation-wind relation was not applied to grasslands, because, firstly, wind has been shown to not increase grassland ROS and burned area72, and secondly,
because the relative exposure differential of grass height and ground height compared to forest areas was assessed to be minimal. Please see SI text S5 for further discussion of these
parameterisations and their assumptions. SIMULATION PROTOCOL The resulting model was spun up for 40 years to allow for vegetation to reach a quasi-equilibrium biomass state. This was done by
forcing the model with the vegetation, climate and atmospheric CO2 of 1901–1910, looped over that period of time, then looped again for 40 years over 1990–2000 forcing data, to bring the
model to an equilibrium consistent with the near-present day. Principal and ‘control’ simulations were run over the period 2000–2013. Vegetation was imposed and not predicted using
ORCHIDEE’s dynamic global vegetation model to reduce uncertainties associated with its output. Climate forcing data for all runs came from the CRU-NCEP v8 dataset135, and vegetation imposed
on the model from the ESA-LUH2 suite of projections with 13 plant functional types14. A number of additional output variables were also implemented to ease assessment of the effects of
fragmentation on fire behaviour. Thus, a ‘counterfactual’ burned area variable, giving the burned area that would have been simulated without the fragmentation code, is written to history
along with fragmentation-affected burned area, to enable tracking of fragmentation's effects. Likewise, differential burned area between the fire size and human ignitions fragmentation
functions, assuming they are both activated, allows the user to track the relative burned area if either only the human ignitions or fire size -fragmentation flags were activated. This could
not be done across all fragmentation-fire adaptations because of a necessarily large duplication of code and simulation runtime inefficiencies that would result. SENSITIVITY ANALYSIS We
created synthetic maps of factor-two levels of homogenous global AED levels to assess the global change in burned area for each biome type (tropical, temperate, boreal) resulting from a
factor-2 change in fragmentation level. AED (not RD, which would cause differential AED because of grid area heterogeneity) was homogenised globally at 2-factor levels [of
\({{{\rm{AE}}}}{{{{\rm{D}}}}}_{{{{\rm{f}}}}2}\) =39.0625, 78.125, 156.25, 312.5, 625, 1250, 2500, 5000, 10,000, 20,000 metres], permitting analysis of the biome-scale effects of
fragmentation on fire independent of historical fragmentation trajectory, by calculating the global average change in burned area for each homogenised AED bin and biome. The model was run
over a three-year period (2001-2003 inclusive) for each \({{{\rm{R}}}}{{{{\rm{D}}}}}_{{{{\rm{f}}}}2}\) leve. This period was chosen because it incorporates a mixture of moderate El Niño and
La Niña years, to limit its signal in simulated fire behaviour to be averaged out in annualised postprocessing. We initially maintained the existing global population distribution for the
simulated years to gauge whether population density may cause a change in sign of sensitivity, and hence warrant further factorial analysis. Sensitivity was evaluated as the fractional
change in burned area (\(\Delta {fB}{A}_{F2}\)) per grid cell due to a two-fold increase in fragmentation (halving of AED): $${\Delta
{fBA}}_{F2}=(({{BA}}_{{{AED}}_{F2[1/2]}})-({{BA}}_{{{AED}}_{F2[1]}}))/{({{BA}}_{{{AED}}_{F2[1]}})}_{{GRID}}$$ (13) Where \(B{A}_{{AE}{D}_{1/2}}\) is the burned area at an AED of half the
value of \(B{A}_{{AE}{D}_{F2[1]}}\). For each of the ten sensitivity simulations, biomes were assigned to each grid cell by identifying the PFT in each grid that contributed the maximum
amount of simulated fire CO2 emissions within that grid cell. This was done to identify the actual vegetation that burned in a grid cell, and hence the fire-relevant vegetation type, as
opposed to using the maximum value between vegetation fractions of each PFT assigned to a grid cell, given that within a grid, certain vegetation types may have a fractionally higher
propensity to burning than their areal coverage. At the global scale, the individual PFTs were then aggregated into tropical, temperate, boreal, C3, and C4 grassland/savannah bins. BA in
ORCHIDEE-SPITFIRE is not PFT-disaggregated. However, CO2 emissions from burning are. This gives a reasonable proxy of what vegetation is burning in a grid cell. Each grid cell was assigned a
PFT identity according to that PFT, which produced the highest fire CO2 emissions over the course of each sensitivity simulation; global biome-specific masks were then created by
aggregating boreal tropical and temperate forest types, and \(\Delta {fB}{A}_{F2}\) calculated for biome. ANALYSIS RD was recently estimated in a statistical generalised linear modelling
study to be a strong negative predictor for burned area globally59. We evaluated the statistical relationship between burned area and RD that emerges from our simulations to compare with the
same regression performed by ref. 59. We transform these two variables by taking the square root of RD and applying the logit-link function to monthly burned area. The latter requires
reducing a variable (burned area) to a probabilistic value, which in this case means a conversion to fraction of grid cell area (_p_). The logit function is then given by:
$${Logit}\left({BA}\right)={Ln}(p/1-p)$$ (14) To estimate fragmentation-fire behaviour at biome scale, we found the maximum PFT-type that burned the most in carbon terms over the simulation
period in each grid cell, by iteratively searching out the maximum value of time-aggregated CO2 emissions per PFT in each grid. This was done because burned area in SPITFIRE is not output in
PFT-specific fractions, while CO2 emissions are, and informs us of what biome fire activity is most prevalent over time in each grid cell, such that these grid cells are collectively used
to characterise global biome (PFT) -scale fire behaviour. All tropical, temperate and boreal PFTs were bundled into single biome bins to simplify explanation and analysis. Fig. 4a was
produced by assigning Boolean numeric values to simulation average changes in burned area and ECO2, then combining these to assign coupled/decoupled direction-of-change. DATA UAF was
obtained from ref. 54. Fire size data used in Fig. S4 is sourced from FRYv2.0136, updated from FRYv1.0137 with single ignition point polygons delineation from re. 138, based on pixel
information MCD64A1 and FireCCI51, as recently used in ref. 139. Long-term burned area data for South-east Asia from97,98 was obtained from https://climate.esa.int/es/odp/#/project/fire
(accessed 05/06/2023), while deforestation and pre-and post 2000 average tree plantation grid data were obtained from refs. 99,100. Fragmentation and fire data for Brazil in Fig. 3a were
provided by ref. 95 and upscaled using CDO’s conservative remapping function from 10 km to 0.5 degree grid resolution. All other datasets above were interpolated bilinearly in CDO to 0.5
degree resolution. Postprocessing was performed using NCL, Panoply, CDO and R, with R maps created including the following packages: _ncdf4, ggplot2, raster, maptools, rgdal, rgeos, maps,
ggpubr, sp, geosphere, rColorBrewer, ggmap, lattice, dplyr, tidyr, plyr_. FIGURE GENERATION Figure 2c: Here, we briefly explain how we isolated grid cells where fragmentation explicitly
decreased fire size in simulations: In SPITFIRE model code, we created diagnostic variables to analyse the effect of the fragmentation representation on BA. In the case of individual fire
size restriction due to fragmentation (blue and red datapoints in Fig. 2c), we created a ‘dummy variable’ -a version and value of a given variable that is not what is finally output, but is
temporarily saved to allow for the calculation of another variable. This dummy variable calculated daily burned area without fragmentation-limiting effects on fire size. This required
running most of the SPITFIRE model code and saving this ‘dummy’ fire size value, and then looping the same code to include the fire limiting fragmentation effects on BA, giving ‘actual’ fire
size values. Where actual < dummy fire size, the fire size limitation of fragmentation as represented here has actually had a constraining impact on fire size, and the difference is
saved, as are the locations. _The values in the red and blue scatters of_ Fig. 2c_are thus those areas where fire size is on average constrained by the patch size, but includes the aggregate
impact of fragmentation on BA (it can still cause either increase or decreases in BA)_. Figure 4b: Fig. 4b shows the _inverse_ of the average effect of fragmentation on fire outcomes,
across a suite of sensitivity experiments in which fragmentation is varied at fixed levels equally and globally. We say ‘inverse’ because on the average, across these levels of fragmentation
_in conjunction with c_ontemporary human population density levels and vegetation distributions, the impact of increasing fragmentation on fire is negative (a decrease in BA), almost
everywhere in the world. However, in the jump from one level of fragmentation to another, depending on the fragmentation level, certain biomes and grid cells will show an increase in fire
activity. We average across this suite of nine simulations to indicate that: _where fragmentation caused the smallest decrease in BA (_hence the inverted scale_) is therefore also where
fragmentation is likely to cause the greatest increase in susceptibility to fire_. By contrast, areas where decreases in BA due to fragmentation were, on average, very high are places that
have the lowest susceptibility to increased fire due to fragmentation. The scale on this diagram is derived from a continuous fractional change in burned area scale averaged over results of
our sensitivity runs, but we have removed the values and made the result qualitative to facilitate representation and interpretation of the locations rather than the precise quantities
whereby fire susceptibility to fragmentation may be highest. This was done to reflect how some areas and biomes are more or less fire-buffered by fragmentation than others, across a broad
suite of possible fragmentation levels. Figures S7 and S10: To generate the burned area anomaly and model-data agreement Figure for this portion of Southeast Asia, we used a (highly
uncertain) long-term burned area dataset, and data that gives the onset (timing) of plantations and other concessions. We then overlaid grid cells in the region where the fraction of these
concessions had increased with grid cells in which observed burned area had increased (the shading in the Figure refers to burned area anomaly magnitude). We compared these grid cells to
those in which modelled burned area increases due to fragmentation, to see if there was a correlation between locations. Generally, this correlation was high (‘simulation-observation
agreement’), although observed positive BA anomalies occurred in more grid cells than that predicted by the model. This model/data disagreement (dark blue in the figure) occurred mostly in
areas of Borneo/Kalimantan underlain predominantly by peat. As peat is not represented in this version of ORCHIDEE, we are not able to represent the increases in fire activity that have been
widely linked to peat burning as a result of concessionary clear-cutting. Although simple, this exercise nonetheless provides strong suggestive support for the idea that (a) fragmentation
and RD are directly correlated; (b) fragmentation is a strong driver of fire activity in tropical biomes. The same approach was used to build Figure S10. DATA AVAILABILITY The, SPITFIRE
module code with fragmentation-fire related additions in bold, scripts for figure reconstruction, as well as post-processing scripts, are available online through the Zenodo digital
repository (https://zenodo.org/records/13809911), which is managed by the European Organisation For Nuclear Research (CERN) and OpenAIRE. Owing to file size limitations, we are unable to
deposit primary data (model output) online. These are archived on the Obelix cluster and the repository managed by LSCE/IPSL/CNRS, which can be made available upon request by contacting the
corresponding author. CODE AVAILABILITY The source code for this version of ORCHIDEE-MICT is available via
https://forge.ipsl.fr/orchidee/wiki/GroupActivities/CodeAvalaibilityPublication/ORCHIDEE_FireFrag which has the following DOI provided by IPSL and is provided open access under the CeCILL
license https://doi.org/10.14768/277bd478-f12d-4b91-a7f3-9cd732dff5ef). Please follow the online instructions for accessing the code. We suggest that interested parties contact the
corresponding author for the latest code versions containing bug fixes, improvements, or cleaner code. This software is governed by a CeCILL licence under French law and abides by the rules
of the distribution of free software. You can use, modify and/or redistribute the software under the terms of the CeCILL licence as circulated by CEA, CNRS, and INRIA at the following URL:
http://www.cecill.info (last accessed 29 August 2024). REFERENCES * Winkler, K., Fuchs, R., Rounsevell, M. & Herold, M. Global land use changes are four times greater than previously
estimated. _Nat. Commun._ 12, 1–10 (2021). Article Google Scholar * Albert, J. S. et al. Human impacts outpace natural processes in the Amazon. _Science_ 379, eabo5003 (2023). * Millard,
J. et al. Global effects of land-use intensity on local pollinator biodiversity. _Nat. Commun._ 12, 2902 (2021). Article ADS CAS PubMed PubMed Central Google Scholar * Powers, R. P.
& Jetz, W. Global habitat loss and extinction risk of terrestrial vertebrates under future land-use-change scenarios. _Nat. Clim. Change_ 9, 323–329 (2019). Article ADS Google Scholar
* Matricardi, E. A. T. et al. Long-term forest degradation surpasses deforestation in the Brazilian Amazon. _Science_ https://doi.org/10.1126/SCIENCE.ABB3021 (2020). * Zellweger, F. et al.
Forest microclimate dynamics drive plant responses to warming. _Science_ 368, 772–775 (2020). Article ADS CAS PubMed Google Scholar * Reinmann, A. B. & Hutyra, L. R. Edge effects
enhance carbon uptake and its vulnerability to climate change in temperate broadleaf forests. _Proc. Natl Acad. Sci. USA_ 114, 107–112 (2017). Article ADS CAS PubMed Google Scholar *
Smith, I. A., Hutyra, L. R., Reinmann, A. B. & Thompson, J. R. Evidence for edge enhancements of soil respiration in temperate forests. _Geophys. Res. Lett_. 46, 4278–4287 (2019). * De
Frenne, P. et al. Forest microclimates and climate change: Importance, drivers and future research agenda. _Glob. Change Biol._ 27, 2279–2297 (2021). Article ADS Google Scholar * Smith,
C., Baker, J. C. A. & Spracklen, D. V. Tropical deforestation causes large reductions in observed precipitation. _Nature_ 615, 270–275 (2023). Article ADS CAS PubMed PubMed Central
Google Scholar * Zhu, L. et al. Comparable biophysical and biogeochemical feedbacks on warming from tropical moist forest degradation. _Nat. Geosci._ 16, 244–249 (2023). Article ADS CAS
Google Scholar * Crippa, M. et al. Food systems are responsible for a third of global anthropogenic GHG emissions. _Nat. Food_ 2, 198–209 (2021). Article CAS PubMed Google Scholar *
Hong, C. et al. Global and regional drivers of land-use emissions in 1961–2017. _Nature_ 589, 554–561 (2021). Article ADS CAS PubMed Google Scholar * Hurtt, G. C. et al. Harmonization
of land-use scenarios for the period 1500-2100: 600 years of global gridded annual land-use transitions, wood harvest, and resulting secondary lands. _Clim. Change_ 109, 117–161 (2011).
Article ADS Google Scholar * Li, G. et al. Global impacts of future urban expansion on terrestrial vertebrate diversity. _Nat. Commun._ 13, 1628 (2022). Article ADS PubMed PubMed
Central Google Scholar * Bowman, D. M. J. S. et al. Fire in the earth system. _Science_ 324, 481–484 (2009). * Kelly, L. T. et al. Understanding fire regimes for a better anthropocene.
_Annu. Rev. Environ. Resour._ 48, 207–235 (2023). Article Google Scholar * Bowman, D. M. J. S. O., Brien, J. A. & Goldammer, J. G. Pyrogeography and the global quest for sustainable
fire management. _Annu Rev. Environ. Resour._ 38, 57–80 (2013). Article Google Scholar * Pausas, J. G. & Keeley, J. E. A burning story: the role of fire in the history of life.
_Bioscience_ 59, 593–601 (2009). Article Google Scholar * Jolly, W. M. et al. Climate-induced variations in global wildfire danger from 1979 to 2013. _Nat. Commun._
https://doi.org/10.1038/ncomms8537 (2015). * Brando, P. M. et al. The gathering firestorm in southern Amazonia. _Sci. Adv._ 6, 1–10 (2020). Article Google Scholar * Bowman, D. M. J. S. et
al. Vegetation fires in the Anthropocene. _Nat. Rev. Earth Environ._ 1, 500–515 (2020). Article ADS Google Scholar * Ruffault, J. et al. Increased likelihood of heat-induced large
wildfires in the Mediterranean Basin. _Sci. Rep._ 10, 1–9 (2020). Article ADS Google Scholar * Clarke, H. et al. Forest fire threatens global carbon sinks and population centres under
rising atmospheric water demand. _Nat. Commun._ 13, 7161 (2022). Article ADS CAS PubMed PubMed Central Google Scholar * Senande-Rivera, M., Insua-Costa, D. & Miguez-Macho, G.
Spatial and temporal expansion of global wildland fire activity in response to climate change. _Nat. Commun._ 13, 1208 (2022). Article ADS CAS PubMed PubMed Central Google Scholar *
Yu, Y. et al. Machine learning–based observation-constrained projections reveal elevated global socioeconomic risks from wildfire. _Nat. Commun._ 13, 1250 (2022). Article ADS CAS PubMed
PubMed Central Google Scholar * Buma, B., Hayes, K., Weiss, S. & Lucash, M. Short-interval fires increasing in the Alaskan boreal forest as fire self-regulation decays across forest
types. _Sci. Rep._ 12, 4901 (2022). Article ADS CAS PubMed PubMed Central Google Scholar * Whitman, E., Parisien, M.-A., Thompson, D. K. & Flannigan, M. D. Short-interval wildfire
and drought overwhelm boreal forest resilience. _Sci. Rep._ 9, 18796 (2019). Article ADS CAS PubMed PubMed Central Google Scholar * Moritz, M. A., Morais, M. E., Summerell, L. A.,
Carlson, J. M. & Doyle, J. Wildfires, complexity, and highly optimized tolerance. _Proc. Natl Acad. Sci._ 102, 17912–17917 (2005). Article ADS CAS PubMed PubMed Central Google
Scholar * Haddad, N. M. et al. Habitat fragmentation and its lasting impact on Earth’s ecosystems. _Sci. Adv._ 1, 1–10 (2015). Article Google Scholar * Bird, M. I. et al. Late Pleistocene
emergence of an anthropogenic fire regime in Australia’s tropical savannahs. _Nat. Geosci._ https://doi.org/10.1038/s41561-024-01388-3 (2024). * Jacobson, A. P., Riggio, J., M. Tait, A.
& E. M. Baillie, J. Global areas of low human impact (‘Low Impact Areas’) and fragmentation of the natural world. _Sci. Rep._ 9, 14179 (2019). Article ADS PubMed PubMed Central
Google Scholar * Armenteras, D., González, T. M. & Retana, J. Forest fragmentation and edge influence on fire occurrence and intensity under different management types in Amazon
forests. _Biol. Conserv._ 159, 73–79 (2013). Article Google Scholar * Lapola, D. M. et al. The drivers and impacts of Amazon forest degradation. _Science_ 379, eabp8622 (2023). Article
CAS PubMed Google Scholar * Laurance, W. F., Sayer, J. & Cassman, K. G. Agricultural expansion and its impacts on tropical nature. _Trends Ecol. Evol._ 29, 107–116 (2014). Article
PubMed Google Scholar * Kumar, S. et al. Changes in land use enhance the sensitivity of tropical ecosystems to fire-climate extremes. _Sci. Rep._ 12, 964 (2022). Article ADS CAS PubMed
PubMed Central Google Scholar * Archibald, S. et al. Biological and geophysical feedbacks with fire in the Earth system. _Environ. Res. Lett._ 13, 033003 (2018). * Driscoll, D. A. et al.
How fire interacts with habitat loss and fragmentation. _Biol. Rev._ 96, 976–998 (2021). Article PubMed Google Scholar * Silva, C. H. L. et al. Deforestation-induced fragmentation
increases forest fire occurrence in central Brazilian Amazonia. _Forests_ 9, (2018). * Fahrig, L. et al. Is habitat fragmentation bad for biodiversity? _Biol. Conserv._ 230, 179–186 (2019).
Article Google Scholar * Arroyo-Rodríguez, V. et al. Designing optimal human-modified landscapes for forest biodiversity conservation. _Ecol. Lett._ 23, 1404–1420 (2020). Article PubMed
Google Scholar * Saldan, R. A. & Fahrig, L. Does forest fragmentation cause an increase in forest temperature? https://doi.org/10.1007/s11284-016-1411-6 (2016). * Symes, W. S., Edwards,
D. P., Miettinen, J., Rheindt, F. E. & Carrasco, L. R. Combined impacts of deforestation and wildlife trade on tropical biodiversity are severely underestimated. _Nat. Commun._ 9, 4052
(2018). Article ADS PubMed PubMed Central Google Scholar * Simkin, R. D., Seto, K. C., McDonald, R. I. & Jetz, W. Biodiversity impacts and conservation implications of urban land
expansion projected to 2050. _Proc. Natl. Acad. Sci._ 119, e2117297119 (2022). Article CAS PubMed PubMed Central Google Scholar * Flores, B. M. et al. Critical transitions in the Amazon
forest system. _Nature_ 626, 555–564 (2024). Article ADS CAS PubMed PubMed Central Google Scholar * Phillips, B. B., Bullock, J. M., Osborne, J. L. & Gaston, K. J. Ecosystem
service provision by road verges. _J. Appl. Ecol._ 57, 488–501 (2020). Article Google Scholar * Meeussen, C. et al. Structural variation of forest edges across Europe. _Ecol. Manag._ 462,
117929 (2020). Article Google Scholar * Meeussen, C. et al. Microclimatic edge-to-interior gradients of European deciduous forests. _Agric. For. Meteorol._ 311, 108699 (2021). * Crockatt,
M. E. & Bebber, D. P. Edge effects on moisture reduce wood decomposition rate in a temperate forest. _Glob. Chang Biol._ 21, 698–707 (2015). Article ADS PubMed Google Scholar *
Morreale, L. L., Thompson, J. R., Tang, X., Reinmann, A. B. & Hutyra, L. R. Elevated growth and biomass along temperate forest edges. _Nat Commun_ 12, 7181 (2021). * Garvey, S. M.,
Templer, P. H., Pierce, E. A., Reinmann, A. B. & Hutyra, L. R. Diverging patterns at the forest edge: soil respiration dynamics of fragmented forests in urban and rural areas. _Glob.
Chang. Biol._ 3094–3109 https://doi.org/10.1111/gcb.16099 (2022). * Keppel, G., Anderson, S., Williams, C., Kleindorfer, S. & O’Connell, C. Microhabitats and canopy cover moderate high
summer temperatures in a fragmented Mediterranean landscape. _PLoS One_ 12, 1–18 (2017). Article Google Scholar * Aguilar, R. et al. Habitat fragmentation reduces plant progeny quality: a
global synthesis. _Ecol. Lett._ 22, 1163–1173 (2019). Article PubMed Google Scholar * Gao, J. & Pesaresi, M. Downscaling SSP-consistent global spatial urban land projections from
1/8-degree to 1-km resolution 2000–2100. _Sci. Data_ 8, 1–9 (2021). Article Google Scholar * Gao, J. & O’Neill, B. C. Mapping global urban land for the 21st century with data-driven
simulations and shared socioeconomic pathways. _Nat. Commun._ 11, 1–12 (2020). Article Google Scholar * Meijer, J. R., Huijbregts, M. A. J., Schotten, K. C. G. J. & Schipper, A. M.
Global patterns of current and future road infrastructure. _Environmental Research Letters_ 13, (2018). * Laurance, W. F. et al. A global strategy for road building. _Nature_ 513, 229–232
(2014). Article ADS CAS PubMed Google Scholar * Archibald, S., Staver, A. C. & Levin, S. A. Evolution of human-driven fire regimes in Africa. _Proc. Natl. Acad. Sci. USA_
https://doi.org/10.1073/pnas.1118648109 (2012). * Haas, O., Prentice, I. C. & Harrison, S. P. Global environmental controls on wildfire burnt area, size, and intensity. _Environ. Res.
Lett._ 17, 065004 (2022). Article ADS Google Scholar * Guimberteau, M. et al. ORCHIDEE-MICT (v8.4.1), a land surface model for the high latitudes: model description and validation.
_Geosci. Model Dev._ 11, 121–163 (2018). Article ADS CAS Google Scholar * Qiu, C. et al. ORCHIDEE-PEAT (revision 4596), a model for northern peatland CO2, water, and energy fluxes on
daily to annual scales. _Geosci. Model Dev._ 11, 497–497 (2018). Article ADS CAS Google Scholar * Bowring, S. P. K. et al. ORCHIDEE MICT-LEAK (r5459), a global model for the production,
transport and transformation of dissolved organic carbon from Arctic permafrost regions, Part 2: Model evaluation over the Lena River basin. _Geosci. Model. Dev. Discussions_ 1–45
https://doi.org/10.5194/gmd-2018-322 (2019). * Yue, C., Ciais, P., Cadule, P., Thonicke, K. & Van Leeuwen, T. T. Modelling the role of fires in the terrestrial carbon balance by
incorporating SPITFIRE into the global vegetation model ORCHIDEE -Part 2: Carbon emissions and the role of fires in the global carbon balance. _Geosci. Model Dev._ 8, 1321–1338 (2015).
Article ADS Google Scholar * Yue, C. et al. Modelling the role of fires in the terrestrial carbon balance by incorporating SPITFIRE into the global vegetation model ORCHIDEE—Part 1:
Simulating historical global burned area and fire regimes. _Geosci. Model. Dev._ https://doi.org/10.5194/gmd-7-2747-2014 (2014). * Ma, J., Li, J., Wu, W. & Liu, J. Global forest
fragmentation change from 2000 to 2020. _Nat. Commun._ 14, 3752 (2023). * Narayanaraj, G. & Wimberly, M. C. Influences of forest roads on the spatial pattern of wildfire boundaries.
_Int. J. Wildland Fire_ 20, 792–803 (2011). Article Google Scholar * Fisher, R., Lewis, B., Price, O. & Pickford, A. Barriers to fire spread in northern Australian tropical savannas,
deriving fire edge metrics from long term high-frequency fire histories. _J. Environ. Manag._ 301, 113864 (2022). Article Google Scholar * Stolle, F., Chomitz, K. M., Lambin, E. F. &
Tomich, T. P. Land use and vegetation fires in Jambi Province, Sumatra, Indonesia. _Ecol. Manag._ 179, 277–292 (2003). Article Google Scholar * Sze, J. S., Jefferson & Lee, J. S. H.
Evaluating the social and environmental factors behind the 2015 extreme fire event in Sumatra, Indonesia. _Environ. Res. Lett._ 14, 015001 (2019). Article ADS Google Scholar * Barni, P.
E. et al. Logging Amazon forest increased the severity and spread of fires during the 2015–2016 El Niño. _Ecol. Manag._ 500, 119652 (2021). Article Google Scholar * Arienti, M. C.,
Cumming, S. G., Krawchuk, M. A. & Boutin, S. Road network density correlated with increased lightning fire incidence in the Canadian western boreal forest. _Int J. Wildland Fire_ 18,
970–982 (2009). Article Google Scholar * Cardoso, A. W. et al. Quantifying the environmental limits to fire spread in grassy ecosystems. _Proc. Natl. Acad. Sci. USA_ 119, 1–7 (2022).
Article Google Scholar * Thonicke, K. et al. The influence of vegetation, fire spread and fire behaviour on biomass burning and trace gas emissions: Results from a process-based model.
_Biogeosciences_ https://doi.org/10.5194/bg-7-1991-2010 (2010). * Archibald, S., Roy, D. P., Van Wilgen, B. W. & Scholes, R. J. What limits fire? An examination of drivers of burnt area
in Southern Africa. _Glob. Chang Biol._ 15, 613–630 (2009). Article ADS Google Scholar * Baker, J. C. A. & Spracklen, D. V. Climate benefits of intact amazon forests and the
biophysical consequences of disturbance. _Front. For. Glob. Change_ 2, (2019). * Trancoso, R. et al. Converting tropical forests to agriculture increases fire risk by fourfold. _Environ.
Res. Lett._ 17, 104019 (2022). Article ADS Google Scholar * Jones, M. W. et al. Global and regional trends and drivers of fire under climate change. _Rev. Geophys._ 60, e2020RG000726
(2022). Article ADS Google Scholar * Di Giuseppe, F., Rémy, S., Pappenberger, F. & Wetterhall, F. Using the Fire Weather Index (FWI) to improve the estimation of fire emissions from
fire radiative power (FRP) observations. _Atmos. Chem. Phys._ 18, 5359–5370 (2018). Article ADS Google Scholar * Giglio, L., Boschetti, L., Roy, D. P., Humber, M. L. & Justice, C. O.
The Collection 6 MODIS burned area mapping algorithm and product. _Remote Sens. Environ._ 217, 72–85 (2018). Article ADS PubMed PubMed Central Google Scholar * Chen, Y. et al.
Multi-decadal trends and variability in burned area from the fifth version of the Global Fire Emissions Database (GFED5). _Earth Syst. Sci. Data_ 15, 5227–5259 (2023). Article ADS Google
Scholar * Van Der Werf, G. R. et al. Global fire emissions estimates during 1997–2016. _Earth Syst. Sci. Data_ 9, 697–720 (2017). Article ADS Google Scholar * Gaveau, D. L. A., Descals,
A., Salim, M. A., Sheil, D. & Sloan, S. Refined burned-area mapping protocol using Sentinel-2 data increases estimate of 2019 Indonesian burning. _Earth Syst. Sci. Data_ 13, 5353–5368
(2021). Article ADS Google Scholar * Subramanian, A. & Kessler, M. The hyperglobalization of trade and its future. _Towards a better global economy: Policy implications for citizens
worldwide in the 21st century_ (2013). * Stiglitz, J. E. Where modern macroeconomics went wrong. _Oxf. Rev. Econ. Policy_ 34, 70–106 (2018). Google Scholar * Hoang, N. T. & Kanemoto, K.
Mapping the deforestation footprint of nations reveals growing threat to tropical forests. _Nat. Ecol. Evol._ 5, 845–853 (2021). Article PubMed Google Scholar * Pendrill, F. et al.
Agricultural and forestry trade drives large share of tropical deforestation emissions. _Glob. Environ. Change_ 56, 1–10 (2019). Article Google Scholar * Lambin, E. F. & Meyfroidt, P.
Global land use change, economic globalization, and the looming land scarcity. _Proc. Natl. Acad. Sci. USA_ 108, 3465–3472 (2011). * Byerlee, D. Globalized agriculture and tropical
deforestation. _Population, Agriculture, and Biodiversity_ 123–148 (2020). * Wolf, C., Levi, T., Ripple, W. J., Zárrate-Charry, D. A. & Betts, M. G. A forest loss report card for the
world’s protected areas. _Nat. Ecol. Evol._ 5, 520–529 (2021). Article PubMed Google Scholar * Giljum, S. et al. A pantropical assessment of deforestation caused by industrial mining.
_Proc. Natl. Acad. Sci._ 119, e2118273119 (2022). Article CAS PubMed PubMed Central Google Scholar * Maxwell, S. L. et al. Degradation and forgone removals increase the carbon impact of
intact forest loss by 626%. _Sci. Adv._ 5, eaax2546 (2023). Article ADS Google Scholar * Taubert, F. et al. Global patterns of tropical forest fragmentation. _Nature_ 554, 519–522
(2018). Article ADS CAS PubMed Google Scholar * Turubanova, S., Potapov, P. V., Tyukavina, A. & Hansen, M. C. Ongoing primary forest loss in Brazil, Democratic Republic of the
Congo, and Indonesia. _Environ. Res. Lett._ 13, 074028 (2018). Article ADS Google Scholar * Lapola, D. M. et al. The drivers and impacts of Amazon forest degradation. _Science_ 379,
eabp8622 (2024). Article Google Scholar * Rosan, T. M. et al. Fragmentation-driven divergent trends in burned area in Amazonia and Cerrado. _Front. For. Glob. Change_ 5, (2022). * Walker,
R., Perz, S., Arima, E. & Simmons, C. The transamazon highway: past, present, future. In: _Engineering Earth: The Impacts of Megaengineering Projects_ (ed. Brunn, S. D.) 569–599
(Springer Netherlands, Dordrecht, 2011). https://doi.org/10.1007/978-90-481-9920-4_33. * Lizundia-Loiola, J., Otón, G., Ramo, R. & Chuvieco, E. A spatio-temporal active-fire clustering
approach for global burned area mapping at 250 m from MODIS data. _Remote Sens. Environ._ 236, 111493 (2020). Article Google Scholar * Otón, G., Lizundia-Loiola, J., Pettinari, M. L. &
Chuvieco, E. Development of a consistent global long-term burned area product (1982–2018) based on AVHRR-LTDR data. _Int. J. Appl Earth Obs. Geoinf._ 103, 102473 (2021). Google Scholar *
Curtis, P. G., Slay, C. M., Harris, N. L., Tyukavina, A. & Hansen, M. C. Classifying drivers of global forest loss. _Science_ 361, 1108–1111 (2018). Article ADS CAS PubMed Google
Scholar * Du, Z. et al. A global map of planting years of plantations. _Sci. Data_ 9, 141 (2022). Article PubMed PubMed Central Google Scholar * Field, R. D., van der Werf, G. R. &
Shen, S. S. P. Human amplification of drought-induced biomass burning in Indonesia since 1960. _Nat. Geosci._ 2, 185–188 (2009). Article ADS CAS Google Scholar * Nikonovas, T., Spessa,
A., Doerr, S. H., Clay, G. D. & Mezbahuddin, S. Near-complete loss of fire-resistant primary tropical forest cover in Sumatra and Kalimantan. _Commun. Earth Environ._ 1, 65 (2020).
Article ADS Google Scholar * Krasovskii, A. et al. Modeling burned areas in Indonesia: the FLAM approach. _Forests_ 9, 437 (2018). Article Google Scholar * Gaveau, D. L. A. et al. Major
atmospheric emissions from peat fires in Southeast Asia during non-drought years: evidence from the 2013 Sumatran fires. _Sci. Rep._ 4, 6112 (2014). Article CAS PubMed PubMed Central
Google Scholar * Kiely, L. et al. Assessing costs of Indonesian fires and the benefits of restoring peatland. _Nat. Commun._ 12, 7044 (2021). Article ADS CAS PubMed PubMed Central
Google Scholar * Aragão, L. E. O. C. et al. 21st Century drought-related fires counteract the decline of Amazon deforestation carbon emissions. _Nat. Commun._ 9, 536 (2018). Article ADS
PubMed PubMed Central Google Scholar * Plowright, R. K. et al. Land use-induced spillover: a call to action to safeguard environmental, animal, and human health. _Lancet Planet. Health_
5, e237–e245 (2021). * Riutta, T., Clack, H., Crockatt, M. & Slade, E. M. Landscape-scale implications of the edge effect on soil fauna activity in a temperate forest. _Ecosystems_ 19,
534–544 (2016). Article Google Scholar * Mollicone, D., Eva, H. D. & Achard, F. Human role in Russian wild fires. _Nature_ 440, 436–437 (2006). Article ADS CAS PubMed Google
Scholar * Zheng, B. et al. Increasing forest fire emissions despite the decline in global burned area. _Sci. Adv._ 7, eabh2646 (2021). Article ADS PubMed PubMed Central Google Scholar
* Hoffman, K. M. et al. Conservation of Earth’s biodiversity is embedded in Indigenous fire stewardship. _Proc. Natl. Acad. Sci._ 118, e2105073118 (2021). Article CAS PubMed PubMed
Central Google Scholar * Schmidt, M. J. et al. Intentional creation of carbon-rich dark earth soils in the Amazon. _Sci. Adv._ 9, eadh8499 (2024). Article Google Scholar * Swyngedouw, E.
Globalisation or ‘glocalisation’? Networks, territories and rescaling. _Camb. Rev. Int. Aff._ 17, 25–48 (2004). Article Google Scholar * Levis, C. et al. Contributions of human cultures
to biodiversity and ecosystem conservation. _Nat. Ecol. Evol._ https://doi.org/10.1038/s41559-024-02356-1 (2024). * Bromham, L. et al. Global predictors of language endangerment and the
future of linguistic diversity. _Nat. Ecol. Evol._ 6, 163–173 (2022). Article PubMed Google Scholar * Laurance, W. F. et al. Ecosystem decay of amazonian forest fragments: a 22-year
investigation. _Conserv Biol._ 16, 605–618 (2002). Article Google Scholar * Skinner, E. B., Glidden, C. K., MacDonald, A. J. & Mordecai, E. A. Human footprint is associated with shifts
in the assemblages of major vector-borne diseases. _Nat. Sustain._ 6, 652–661 (2023). Article PubMed PubMed Central Google Scholar * Kemp, L. et al. Climate endgame: exploring
catastrophic climate change scenarios. _Proc. Natl Acad. Sci._ 119, e2108146119 (2022). Article CAS PubMed PubMed Central Google Scholar * Kreider, M. R. et al. Fire suppression makes
wildfires more severe and accentuates impacts of climate change and fuel accumulation. _Nat. Commun._ 15, 2412 (2024). Article ADS CAS PubMed PubMed Central Google Scholar * Rothermel,
R. C. Predicting behavior and size of crown fires in the northern Rocky Mountains. _USDA Forest Service, Intermountain Research Station_, Research Paper 46 (1991). * Albini, F. A.
Estimating wildfire behavior and effects. _U.S. Department of Agriculture, Forest Service, Intermountain Research Station_ 30, 1–22 (1976). Google Scholar * Hantson, S. et al. The status
and challenge of global fire modelling. _Biogeosciences_ https://doi.org/10.5194/bg-13-3359-2016 (2016). * Hantson, S. et al. Quantitative assessment of fire and vegetation properties in
simulations with fire-enabled vegetation models from the Fire Model Intercomparison Project. _Geosci. Model. Dev._ https://doi.org/10.5194/gmd-13-3299-2020 (2020). * Van Marle, M. J. E. et
al. Historic global biomass burning emissions for CMIP6 (BB4CMIP) based on merging satellite observations with proxies and fire models (1750-2015). _Geosci. Model. Dev._ 10, 3329–3357
(2017). * Yue, C. et al. How have past fire disturbances contributed to the current carbon balance of boreal ecosystems? _Biogeosciences_ 13, 675–675 (2016). Article ADS Google Scholar *
Bowring, S. P. K., Jones, M. W., Ciais, P., Guenet, B. & Abiven, S. Pyrogenic carbon decomposition critical to resolving fire’s role in the Earth system. _Nat. Geosci._ 15, 135–142
(2022). Article ADS CAS Google Scholar * Keijzer, T., Schipper, A., Meijer, J. & Nijland, W. _Detecting Roads from Space: Testing the Potential of Sentinel-1 SAR Imagery and Deep
Learning for Automated Road Mapping_. PBL Netherlands Environmental Assessment Agency (2022). * Schulzweida, Uwe. CDO user guide (2.1.0). _Zenodo._ https://doi.org/10.5281/zenodo.7112925
(2022). * Li, Y., Kang, W., Han, Y. & Song, Y. Spatial and temporal patterns of microclimates at an urban forest edge and their management implications. _Environ. Monit. Assess._ 190, 93
(2018). Article PubMed Google Scholar * Baur, B., Rusterholz, H.-P. & Braschler, B. The grassland fragmentation experiment in the Swiss Jura mountains: a synthesis. _Diversity
(Basel)_ 15, 130 (2023). * Graham, E. A. et al. Dynamic microclimate boundaries across a sharp tropical rainforest–clearing edge. _Remote Sens. (Basel)_ 13, (2021). * Nunes, M. H. et al.
Edge effects on tree architecture exacerbate biomass loss of fragmented Amazonian forests. _Nat. Commun._ 14, 8129 (2023). Article ADS PubMed PubMed Central Google Scholar * Vanneste,
T. et al. Trade-offs in biodiversity and ecosystem services between edges and interiors in European forests. _Nat. Ecol. Evol._ https://doi.org/10.1038/s41559-024-02335-6 (2024). *
Davies‐Colley, R. J., Payne, G. W. & van Elswijk, M. Microclimate gradients across a forest edge. _N. Z. J. Ecol._ 24, 111–121 (2000). Google Scholar * Viovy, N. CRUNCEP Version
7—Atmospheric forcing data for the community land model. In: _Research Data Archive at the National Center for Atmospheric Research, Computational and Information Systems Laboratory_
https://doi.org/10.5065/PZ8F-F017 (2018). * Mouillot, F., Chen, W., Campagnolo, M. & Ciais, P. FRYv2.0: a global fire patch morphology database from FireCCI51 and MCD64A1. In _EGU
General Assembly 2023 -EGU23-9575_ (EGU23-9575, Vienna, Austria, 2023). * Laurent, P. et al. FRY, a global database of fire patch functional traits derived from space-borne burned area
products. _Sci. Data_ 5, 180132 (2018). Article CAS PubMed PubMed Central Google Scholar * Oom, D., Silva, P. C., Bistinas, I. & Pereira, J. M. C. Highlighting biome-specific
sensitivity of fire size distributions to time-gap parameter using a new algorithm for fire event individuation. _Remote Sens. (Basel)_ 8, 663 (2016). Article ADS Google Scholar * García,
M. et al. Characterizing global fire regimes from satellite-derived products. _Forests_ 13, 699 (2022). Article Google Scholar Download references ACKNOWLEDGEMENTS S.P.K.B. was funded by
research project FirEUrisk, a European Union Horizon 2020 research and innovation programme under Grant agreement no. 101003890. AUTHOR INFORMATION AUTHORS AND AFFILIATIONS * Laboratoire des
Sciences du Climat et de l’Environnement (LSCE), IPSL-CEA-CNRS-UVSQ, Université Paris-Saclay, Gif-sur-Yvette, France Simon P. K. Bowring & Philippe Ciais * Laboratoire de Géologie,
Département de Géosciences, Ecole Normale Supérieure (ENS), 24 rue Lhomond, 75231, Paris Cedex 05, France Simon P. K. Bowring * Department of Earth System Science, Ministry of Education Key
Laboratory for Earth System Modeling, Institute for Global Change Studies, Tsinghua University, Beijing, China Wei Li * UMR 5175 CEFE, Université de Montpellier, CNRS, EPHE, IRD, 1919 Route
de Mende, 34293, Montpellier, France Florent Mouillot * Faculty of Environment, Science and Economy, University of Exeter, Exeter, United Kingdom Thais M. Rosan Authors * Simon P. K. Bowring
View author publications You can also search for this author inPubMed Google Scholar * Wei Li View author publications You can also search for this author inPubMed Google Scholar * Florent
Mouillot View author publications You can also search for this author inPubMed Google Scholar * Thais M. Rosan View author publications You can also search for this author inPubMed Google
Scholar * Philippe Ciais View author publications You can also search for this author inPubMed Google Scholar CONTRIBUTIONS S.P.K.B. designed the study. S.P.K.B. designed and performed the
fragmentation-fire code implementation in ORCHIDEE, set up the simulations, and processed the output used for this study. F.M. and T.M.R provided access to data. F.M., P.C., and W.L.
provided additional input to the coding, study design, and data processing. All authors contributed to the interpretation of the results. S.P.K.B. wrote the manuscript and produced all the
figures. All authors contributed to the final modifications of the manuscript. CORRESPONDING AUTHOR Correspondence to Simon P. K. Bowring. ETHICS DECLARATIONS COMPETING INTERESTS The authors
declare no competing interests. PEER REVIEW PEER REVIEW INFORMATION _Nature Communications_ thanks Rodney Keenan and the other, anonymous, reviewer(s) for their contribution to the peer
review of this work. A peer review file is available. ADDITIONAL INFORMATION PUBLISHER’S NOTE Springer Nature remains neutral with regard to jurisdictional claims in published maps and
institutional affiliations. SUPPLEMENTARY INFORMATION SUPPLEMENTARY INFORMATION TRANSPARENT PEER REVIEW FILE RIGHTS AND PERMISSIONS OPEN ACCESS This article is licensed under a Creative
Commons Attribution-NonCommercial-NoDerivatives 4.0 International License, which permits any non-commercial use, sharing, distribution and reproduction in any medium or format, as long as
you give appropriate credit to the original author(s) and the source, provide a link to the Creative Commons licence, and indicate if you modified the licensed material. You do not have
permission under this licence to share adapted material derived from this article or parts of it. The images or other third party material in this article are included in the article’s
Creative Commons licence, unless indicated otherwise in a credit line to the material. If material is not included in the article’s Creative Commons licence and your intended use is not
permitted by statutory regulation or exceeds the permitted use, you will need to obtain permission directly from the copyright holder. To view a copy of this licence, visit
http://creativecommons.org/licenses/by-nc-nd/4.0/. Reprints and permissions ABOUT THIS ARTICLE CITE THIS ARTICLE Bowring, S.P.K., Li, W., Mouillot, F. _et al._ Road fragment edges enhance
wildfire incidence and intensity, while suppressing global burned area. _Nat Commun_ 15, 9176 (2024). https://doi.org/10.1038/s41467-024-53460-6 Download citation * Received: 27 September
2023 * Accepted: 10 October 2024 * Published: 24 October 2024 * DOI: https://doi.org/10.1038/s41467-024-53460-6 SHARE THIS ARTICLE Anyone you share the following link with will be able to
read this content: Get shareable link Sorry, a shareable link is not currently available for this article. Copy to clipboard Provided by the Springer Nature SharedIt content-sharing
initiative