- Select a language for the TTS:
- UK English Female
- UK English Male
- US English Female
- US English Male
- Australian Female
- Australian Male
- Language selected: (auto detect) - EN
Play all audios:
ABSTRACT Deep understanding of sugar metabolite-protein interactions should provide implications on sugar metabolic reprogramming in human physiopathology. Although tremendous efforts have
been made for determining individual event, global profiling of such interactome remains challenging. Here we describe thermal proteome profiling of glycolytic metabolite
fructose-1,6-bisphosphate (FBP)-interacting proteins. Our results reveal a chemical signaling role of FBP which acts as a phosphate donor to activate phosphoglycerate mutase 1 (PGAM1) and
contribute an intrapathway feedback for glycolysis and cell proliferation. At molecular level, FBP donates either C1_-O_-phosphate or C6_-O_-phosphate to the catalytic histidine of PGAM1 to
form 3-phosphate histidine (3-pHis) modification. Importantly, structure-activity relationship studies facilitate the discovery of PGAM1 orthostatic inhibitors which can potentially restrain
cancer cell proliferation. Collectively we have profiled a spectrum of FBP interactome, and discovered a unique covalent signaling function of FBP that supports Warburg effect via histidine
phosphorylation which inspires the development of pharmacological tools targeting sugar metabolism. SIMILAR CONTENT BEING VIEWED BY OTHERS MULTI-OMICS REVEALS NEW LINKS BETWEEN
FRUCTOSAMINE-3-KINASE (FN3K) AND CORE METABOLIC PATHWAYS Article Open access 03 June 2024 THE MOLECULAR BASIS OF HUMAN FN3K MEDIATED PHOSPHORYLATION OF GLYCATED SUBSTRATES Article Open
access 22 January 2025 CROSSTALK BETWEEN O-GLCNACYLATION AND PHOSPHORYLATION IN METABOLISM: REGULATION AND MECHANISM Article 05 March 2025 INTRODUCTION Sugar metabolic reprogramming has been
regarded as a hallmark of various diseases1,2. The altered sugar metabolism, for instance, accelerated aerobic glycolysis in cancer cells3, is adapted to support biomolecule assembly,
energy production and cellular redox homeostasis4. Emerging evidences have shown that disregulated sugar metabolites from such reprogramming process act as signaling molecules to regulate
various cellular events through interacting with important proteins5,6,7,8,9,10,11,12,13. Dissecting the mechanisms of sugar metabolite signaling is therefore crucial for understanding the
impact of sugar metabolic rewiring on human physiology and diseases. As an example, the central glycolytic metabolite fructose-1,6-bisphosphate (FBP) has been revealed as an endogenous
regulator of physiopathological processes including AMP-activated protein kinase (AMPK) activation in response to glucose deprivation14, epidermal growth receptor (EGFR) binding and
activation in triple-negative breast cancer15, activation of oncogenic protein Ras through direct binding to son of sevenless homolog 1 (SOS1)16, inhibition of mitochondrial oxidative
phosphorylation17, as well as binding to high mobility group box 1 (HMGB1) to impair cancer cell viability18. Despite tremendous efforts have been made in identifying individual FBP binding
proteins, a full spectrum of its protein targets and the underlying molecular mechanisms of FBP-target interactions remain largely unexplored. Recently, derivatization-free quantitative
chemoproteomic strategies have become powerful tools to capture the interacting proteins of small molecules in their native forms and enable comprehensive profiling of metabolite-protein
interactome. Limited proteolysis-mass spectrometry (LiP-MS)19,20, the mass spectrometry integrated with equilibrium dialysis for the discovery of allostery systematically (MIDAS) platform21,
as well as target-responsive accessibility profiling (TRAP)22 have been developed for mapping metabolite-protein interactions in intact cells. As a complementary approach, MS-based thermal
proteome profiling (TPP) found broad applications in comprehensive and unbiased profiling of small molecule targets23,24 as well as protein post-translational modifications (PTMs)25,26,27.
It enables the proteome-wide assessment of drug–protein interactions or PTMs by combining quantitative mass spectrometry with cellular thermal shift assay (CETSA)28. In this work, we utilize
a TPP approach to profile the interactome of FBP in HepG2 cells and identify 66 unreported proteins with various functions and subcellular locations as creditable FBP targets. Through
functional validations of metabolic enzymes that involve in the catalytic process of phosphate transfer, we find that FBP is able to donate either its C1-_O_-phosphate or its
C6_-O_-phosphate to the catalytic histidine (His11) of glycolytic enzyme PGAM1 to form 3-pHis modification and activate its enzymatic activity. Such specific metabolite-metabolic enzyme
interaction act as a positive intrapathway feedback to support the Warburg effect and cancer cell proliferation. Molecular docking and molecular dynamics simulations, as well as structural
modifications of FBP allow for structure-activity relationship (SAR) studies of FBP-PGAM1 interaction and give rise to PGAM1 orthostatic inhibitors to reshape glucose metabolism and restrain
cancer cell proliferation, showing promises in strategies for drug discovery in cancer treatment by targeting sugar metabolism. RESULTS THERMAL PROTEOME PROFILING OF FBP-INTERACTING
PROTEINS IN HEPG2 CELLS In TPP strategy, targets can be identified through comparing proteins’ stability within proteome over a temperature range23. The protein abundance at each temperature
was quantified to draw a thermal shift curve, from which the corresponding melting temperatures (Tm) could be calculated. By comparing the difference of Tm before and after small molecule
treatment, one can report the thermal stability change (ΔTm) in an intuitive way. As a proof of concept, we first tested if FBP is able to modulate the thermal stability of whole proteome
and known FBP-interacting proteins in cell lysates heated from 37 °C to 62 °C with a 5 °C gradient (Supplementary Fig. 1). CESTA demonstrated that FBP reduced the thermal stability of its
known target pyruvate kinase isoform M2 (PKM2)29,30 with ΔTm of −2.7 °C, and greatly decreased the thermal stability of SOS1 with ΔTm of −6.2 °C. Unexpectedly, FBP greatly increased the
thermal stability of glyceraldehyde-3-phosphate dehydrogenase (GAPDH), which is not a known FBP target, with ΔTm of 5.9 °C (Supplementary Fig. 1b). These results indicated that the TPP
strategy is suitable for capturing FBP-interacting proteins that allows for global mapping of FBP interactome in the whole cell lysates. We then accessed the FBP-interactome by TPP coupled
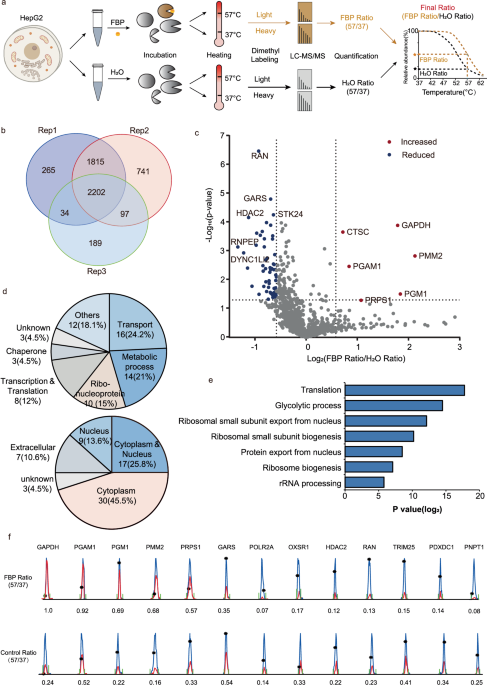
with stable isotope dimethyl labeling for quantitative mass spectrometry in a human liver cancer cell line HepG2 (Fig. 1). HepG2 cell lysates were treated with FBP or H2O and subsequently
divided into two groups to be heated to either 37 °C or 57 °C, respectively (Fig. 1a). The “heavy” groups represent cell lysates heated to 37 °C, while the “light” groups represent cell
lysates heated to 57 °C. After evaluation and quantification by liquid chromatography-tandem mass spectrometry (LC-MS/MS), we got a 57/37 (light/heavy) ratio for each protein in either FBP
or H2O treated group respectively, and then we compared the light/heavy ratio of each protein in either group to yield a new ratio (FBP/H2O) for analysis. 2202 overlapping proteins were
identified out of three biological replicates (Fig. 1b and Supplementary Dataset 1), and we assigned the proteins with a mean ratio (FBP/H2O) over 1.5 as credible FBP targets with increased
thermal stability, and proteins with a mean ratio under 0.66 as credible FBP targets with reduced thermal stability (Fig. 1c). With high confidence, we identified 6 sugar metabolic enzymes
with increased thermal stabiliies by FBP treatment, including GAPDH, phosphomannomutase 2 (PMM2), PGAM1, phosphoglucomutase 1 (PGM1), ribose-phosphate pyrophosphokinase 1 (PRPS1) and a
protease dipeptidyl peptidase 1 (CTSC). On the other hand, 60 proteins were identified FBP targets with reduced thermal stability, such as GTP-binding nuclear protein Ran (RAN), glycine-tRNA
ligase (GARS), histone deacetylase 2 (HDAC2), serine/threonine-protein kinase 24 (STK24), and aminopeptidase B (RNPEP). For the 66 highly confident FBP targets (Supplementary Dataset 2), we
performed bioinformatic analysis to identify their molecular functions, subcellular distributions, as well as the biological pathways. Gene ontology (GO) enrichment analysis indicated that
these targets are functionally involved in transport (24.1%), metabolic process (21%), ribonucleoprotein (15%), transcription and translation (12%), chaperon (4.5%), etc. (Fig. 1d). They are
located in various cellular components including the cytoplasm (45.5%), nucleus (13.6%), cytoplasm & nucleus (25.8%) and so on. Kyoto Encyclopedia of Genes and Genomes (KEGG) functional
pathway analysis showed that they participate in various biochemical pathways such as translation, glycolytic process, ribosomal small subunit biogenesis and export from the nucleus (Fig.
1e). Chromatographic peaks of representative peptides from FBP targets with 57/37 (light/heavy) ratio in the FBP treated group and control group (H2O) are shown in Fig. 1f and they provide
information of stabilization or destabilization effects of FBP on these proteins by isotope quantification. BIOCHEMICAL VALIDATION OF IDENTIFIED FBP TARGETS We next validated the
representative FBP targets by CETSA in HepG2 cell lysates (Fig. 2a). For the proteins with increased thermal stability by FBP treatment, the glycolytic enzyme PGAM1 demonstrated a ΔTm of 6.8
°C, while the other sugar metabolic enzymes PGM1, PMM2 and PRPS1 exhibited ΔTm of 3.0 °C, 7.1 °C and 10.8 °C, respectively (Fig. 2b). We also validated proteins with reduced thermal
stability by FBP treatment including GARS (ΔTm = −8.9 °C), HDAC2 (ΔTm = −3.7 °C), DNA-directed RNA polymerase II subunit RPB1 (POLR2A, ΔTm = −5.5 °C), Pyridoxal-dependent decarboxylase
domain-containing protein 1 (PDXDC1, ΔTm = −3.6 °C), polyribonucleotide nucleotidyltransferase 1 (PNPT1, ΔTm = −2.7 °C), E3 ubiquitin/ISG15 ligase (TRIM25, ΔTm = −1.6 °C), RAN (ΔTm = −2.9
°C) and serine/threonine-protein kinase OSR1 (OXSR1, ΔTm = −1.0 °C) (Fig. 2c and Supplementary Fig. 2a). These results revealed that FBP indeed induced stability changes of its interacting
proteins and suggested that our TPP strategy is an effective tool to profile the interactome of FBP. Our study delineated a global portrait of FBP-interacting proteins and provide a
comprehensive resource for the following functional investigations. To further confirm the direct regulation of protein thermal stabilities by FBP treatment at the molecular level, we
incubated the recombinant proteins with FBP or H2O. Consistent with the CESTA results in cell lysates, FBP increased the thermal stabilities of recombinant human GAPDH, PMM2, PRPS1, PGM1 and
PMM2 proteins, while it reduced the thermal stabilities of recombinant human RAN, HDAC2 and OXSR1 proteins (Fig. 2d). For the five FBP targets with increased thermal stability, we observed
concentration-dependent stabilizing effects of FBP on the recombinant proteins when they were heated from 37 °C to 62 °C (Supplementary Fig. 2b). And the proteins turned to be stabilized by
FBP immediately upon incubation. FUNCTIONAL REGULATION OF FBP TOWARDS SUGAR METABOLIC ENZYMES PGAM1, PGM1 AND PMM2 We then focused on the functional consequences of interactions between FBP
and its identified targets. Through analyzing the 66 credible FBP targets, we found that 25 of them (37.9%) are proteins involved in phosphate transfer or recognition, while 26 of them
(39.4%) are ATP/GTP or DNA/RNA binding proteins (Supplementary Fig. 3a). Further we found that 33% of FBP targets with reduced thermal stability and 83% of the FBP targets with increased
thermal stability are enzymes involved in the catalytic processes of phosphate transfer (Supplementary Fig. 3b, c). Interestingly, PGAM1, PGM1 and PMM2 share a common “ping-pong” mechanism
through phosphate transfer to catalyze the interconversion of sugar phosphates (Supplementary Fig. 3d)31,32,33. Such catalytic processes raised our strong interests to investigate how FBP,
as an endogenous metabolite, interacts with these phosphate-transfer related enzymes at the molecular level and how it regulates their functions. PGAM1 catalyzes the interconversion of the
lower glycolytic metabolite 3- phosphoglycerate (3-PG) and its downstream isomer 2-phosphoglycerate (2-PG), by using 2,3-bisphosphoglycerate (2,3-BPG) as both an intermediate and a cofactor
that phosphorylates the catalytic histidine 11 to activate the enzyme31. Besides 2,3-BPG, either lower glycolytic metabolite phosphoenolpyruvate (PEP)34 or 1,3-bisphosphoglycerate
(1,3-BPG)35 has been reported to act as a phosphate donor to activate PGAM1 through His11 phosphorylation using a similar mechanism. PGM1 catalyzes the interconversion of
d-glucose-6-phosphate (G6P) into α-d-glucose-1-phosphate (G1P) through α-d-glucose-1,6-bisphosphate (GBP) as an intermediate32 and the catalytic step branches glycolysis into glycogen
synthesis. PMM2 catalyzes the interconversion of d-mannose-6-phosphate (M6P) into α-d-mannose-6-phosphate (M1P) and requires a sugar bisphosphate, either α-d-mannose-1,6-bisphosphate (MBP)
or α-GBP for its activity33. PMM2 is very important in the biosynthesis of the GDP-mannose and dolichol-phosphate mannose and associated with the most common congenital disorder of
glycosylation (CDG)36. The three FBP targets share a common catalytic mechanism for the isomerization of sugar phosphates and we assumed that FBP as a sugar bisphosphate might have specific
interaction and regulation towards such kind of enzymes, to perform both intra- and inter-pathway regulations of glucose metabolism. From enzymatic activity assays and microscale
thermophoresis (MST) analysis we found that FBP is able to activate PGAM1 with an EC50 value of 0.48 mM and Kd value of 166 μM, while it inhibits PGM1 with an IC50 value of 2.79 mM and Kd
value of 235 μM, as well as PMM2 with an IC50 value of 7.91 mM and Kd value of 247 μM (Fig. 3a, b). Such weak interactions are consistent with previous observations on the interactions
between endogenous metabolites with their target proteins21, indicating FBP might regulate the activities of its targets and the downstream signaling events only when it is accumulated under
centain stressed or pathological conditons. We next compared FBP with the well known PGAM1 activator 2,3-BPG in regards of PGAM1 interaction and activation, and found that FBP is around
1000 times less reactive than 2,3-BPG. FBP has been reported to be highly accumulated in hepatocellular carcinoma and exhibit a cytosolic concentration up to 7–25 mM17,37. While in the
cultured mammalian cells, the absolute cellular concentration of FBP has been determined as 1.52 mM38. In order to investigate the biological or pathological relevance of such relatively
weak binding affinities between FBP and its targets, we performed LC-MS/MS based targeted metabolomics using 13C6-FBP as internal standard (IS) for quantification to determine the
intracellular concentrations of FBP in HepG2 cells (Supplementary Fig. 4a, b). The FBP concentrations in HepG2 cells were determined as 0.416 ± 0.056 mM (Supplementary Fig. 4c) with normal
glucose supplement, suggesting the binding affinities of FBP with PGAM1, PGM1 and PMM2, as well as the activation of PGAM1 by FBP are biologically relevant, while the inhibition of PGM1 and
PMM2 might be pathologically relevant. FBP ACTIVATES PGAM1 THROUGH PHOSPHORYLATION OF ITS CATALYTIC SITE HIS11 As a glycolytic metabolite, FBP is known to be cleaved into two three-carbon
metabolites glyceraldehyde-3-phosphate (G3P) and dihydroxyacetone phosphate (DHAP) by glycolytic enzyme ALDOA39. Meanwhile it is a well-studied allosteric activator of lower glycolytic
enzyme PKM229. Yet it’s unreported whether FBP could interfere or participate in the phosphate transfer processes of metabolic enzymes. We assume FBP functions as an activator of PGAM1
through phosphorylation of its catalytic histidine. Firstly, we validated this hypothesis using histidine phosphorylation antibodies and Phos-tag reagent. Recombinant human PGAM1 (PGAM1) was
incubated with FBP and subsequently subjected to immunoblotting or Phos-tag SDS-PAGE analysis (Fig. 3c). The N3-phosphohistidine (3-pHis) or 1-phosphohistidine (1-pHis) monoclonal
antibodies, developed by Prof. Tony Hunter and his colleagues40, were utilized to confirm that FBP is able to phosphorylate PGAM1 to form 3-pHis modification instead of 1-pHis species. It
was consistent with the Phos-tag SDS-PAGE41 results that the phosphorylated PGAM1 by FBP treatment exhibited a mass shift. Through comparison with the known 1-pHis modified protein NME2 by
ATP, it was then confirmed by immunoblotting analysis that there’s no 1-phosphohistidine formation on PGAM1 by FBP treatment (Supplementary Fig. 5). We observed a clear concentration
dependent phosphorylation of PGAM1 by FBP, in a similar way as known PGAM1 activator 2,3-BPG (Fig. 3d). 2,3-BPG is able to phosphorylate PGAM1 at a much lower concentration of 0.01 mM than
that of FBP (1 mM), which is consistent with the EC50 and Kd value of these two molecules towards PGAM1 (Fig. 3a, b). The weak phosphorylation of PGAM1 by PEP was consistent with the report
that PEP might need an extra enzyme or cofactor to phosphorylate and activate PGAM134. FBP was found to immediately phosphorylate the histidine of PGAM1 upon incubation and the 3-pHis
modification decayed after 4 h (Fig. 3e). These results suggested that FBP phosphorylates and activates PGAM1 directly with no cofactor and no time required. In order to identify the PGAM1
phosphorylation sites induced by FBP, we incubated PGAM1 with FBP, then digested the protein with trypsin and subjected it to LC-MS/MS analysis. It was shown that FBP could directly
phosphorylate PGAM1 at its catalytic site His11 (Fig. 3f and Supplementary Fig. 6a). We then generated a mutant of PGAM1-H11A through site-directed mutagenesis and confirmed by
immunoblotting analysis that the catalytic His11 was the only histidine phosphorylated by FBP to generate 3-pHis modification (Fig. 3g). Meanwhile, FBP lost its activation effect towards
PGAM1-H11A mutant, suggesting the phosphorylation of catalytic His11 is the key for PGAM1 activation (Fig. 3a). His11 was found to be correlated with the thermal stability of PGAM1, and H11A
mutant was slightly less stable than PGAM1 WT (Supplementary Fig. 6b–d). However, loss of His11 did not influence the stabilizing effect of FBP towards PGAM1 (Supplementary Fig. 6c, d),
indicating FBP might increase the thermal stability of PGAM1 through other mechanism but not pHis11 modification. To clarify the fate of FBP after its phosphate donation to PGAM1, we
performed LC-MS/MS analysis of fructose monophosphate products using a derivatization reagent 2-(diazo-methyl)-_N_-methyl-_N_-phenyl-benzamide (2-DMBA, Supplementary Fig. 4d) for
distinguishing F6P and F1P by retention time and fragment ions (Supplementary Fig. 4e)42. Upon treatment of PGAM1 with FBP in vitro, both F6P and F1P were generated immediately and
accumulated following reaction time (Fig. 4a), indicating that both C1-_O_-phosphate and C6-_O_-phosphate of FBP could be transferred to PGAM1 (Fig. 4b). MOLECULAR DOCKING AND MOLECULAR
DYNAMICS SIMULATIONS OF FBP-PGAM1 INTERACTION To access the molecular details of the interaction between FBP and PGAM1, we performed molecular docking to examine how FBP donates its
phosphate to His11 of PGAM1, and to confirm that the two phosphates attached to the sugar backbone behave similarly. Of special note, when FBP exists as an α-anomeric cyclic form or a linear
form, the calculated distances out of thirty confirmations between the atom P1 and atom N3 at PAGM1-His11 were all much shorter than those between P6 and N3 (Supplementary Dataset 3). In
sharp contrast, when FBP exists as a β-anomeric cyclic form that is favored (80%) in solution43, the calculated distances between P1 and N3 at PAGM1-His11 showed no significant difference
with those between P6 and N3, indicating that FBP donates either its C1-_O_-phosphate or its C6-_O_-phosphate to the N3 position of PGAM1 catalytic His11 (Supplementary Fig. 7a). It’s
consistent with the formation of both F6P and F1P products upon LC-MS/MS analysis of FBP-PGAM1 interaction (Fig. 4a, b). We also observed hydrogen bonds between C1-_O_-phosphate, C2-OH,
C3-OH, C6-_O_-phosphate of β-FBP and a few crucial amino acid residues within the catalytic pockets of PGAM1 (Fig. 4c). In detail, when donating C1-_O_-phosphate, the phosphate group at C1
position forms hydrogen bonds with the known substrate binding sites Arg10, Gly187 and Arg62, the transition state stabilizer His18644,45. And the anomeric C2-OH of FBP forms hydrogen bonds
with proton donating active site Glu89 and substrate binding site Asn188, while the C3-OH of FBP forms hydrogen bonds with substrate binding site Tyr92. On the other hand, when donating
C6-_O_-phosphate, the phosphate group at C6 position forms hydrogen bonds with the same three amino acids Arg10, Arg62 and His186, while the C2-OH and C3-OH form hydrogen bonds with Asn17
and C1-_O_-phosphate forms hydrogen bonds with Arg10. Overall the overmentioned hydrogen bonding network enabled the position of either C1-_O_-phosphate or C6-_O_-phosphate of FBP placed
exactly opposite to the N3 of His11, thereby facilitating the phosphate transfer from FBP to PGAM1. As a comparision, molecular docking of 2,3-BPG with PGAM1 showed that the C2-_O_-phosphate
is orientated to the His11 of PGAM1 through hydrogen bonding network between C2-_O_-phosphate and Arg10, Gly187, Arg62, His186, those between C1 carboxylic acid and Arg62, Gly24, as well as
those between C3-_O_-phospahte and Arg10, Ser14 (Supplementary Fig. 7c). To validate the molecular docking simulation of the binding mode between FBP and PGAM1, we generated six PGAM1
single site mutants including PGAM1-R10A, R62A, E89A, Y92A, H186A, N188A through site-directed mutagenesis of the key residues participating in the FBP binding with PGAM1, as well as
PGAM1-3A with three sites mutated (R10A, E89A and H186A). Through immunoblotting and MST analysis of the mutated proteins, we concluded that mutation of the substrate binding sites Arg10, or
the proton donating active site Glu89 or the transition state stabilizer His186 drastically compromised both the binding and histidine phosphorylation of PGAM1 by FBP (Fig. 4d and
Supplementary Fig. 6e). To further confirm the FBP-PGAM1 interaction with molecular details, molecular dynamics (MD) simulations were performed to investigate the dynamic process of the
binding and phosphorylation of PGAM1 by FBP (Fig. 4e and Supplementary Fig. 8). Steady state of PGAM1-FBP complex during the process of phosphate transfer from either C1-_O_-phosphate (Fig.
4e up) or C6-_O_-phosphate (Fig. 4e down) of FBP were captured after 750 ns simulation. We observed the hydrogen binding of FBP with key residues of PGAM1 including Arg10, Asn17, Arg62,
His186, Gly187, Asn188 that align well with the docking model, as well as the position of FBP phosphate group towards His11 of PGAM1. Based on the non-bond monitor of MD simulation of
PGAM1–FBP complex (Supplementary Fig. 8c, d), we calculated the probability of hydrogen bonding interactions between FBP and the PGAM1 active site residues. Within the interaction network,
we found that Arg10 exhibited the highest probability during the process of either C1-_O_-phosphate transfer (Fig. 4e up) or C6-_O_-phosphate transfer (Fig. 4e down). Taken together, these
data showed that the active site of PGAM1 is suitable to locate a six-carbon sugar phosphate, although its natural substrates 3-PG, 2-PG and cofactor 2,3-BPG are all three-carbon sugar
phosphates. Three-carbon units on FBP that holds C1-_O_-phosphate, 2-OH and 3-OH, makes the molecule easy to be installed into PGAM1 catalytic pocket through binding of key residues Arg10,
Glu89 and His186, which facilitates His11 phosphorylation of PGAM1 by FBP. STRUCTURE-ACTIVITY RELATIONSHIP (SAR) OF FBP-PGAM1 INTERACTION As mentioned above, we found that FBP can activate
PGAM1 by covalent signaling mediated by phosphate transfer, but little is known about its specificity for such process. There are different kinds of metabolites with sugar phosphate
structure in cells, it’s important to know whether they could activate PGAM1 in a similar way. We next collected glucose-1,6-bisphosphate (GBP), 2,3-BPG, F1P, F6P, G1P, G6P, M1P and M6P and
test whether they were able to phosphorylate PGAM1 (Fig. 5a). It turned out that only FBP or 2,3-BPG act as a phosphate donor to form 3-pHis modification on PGAM1 by immunoblotting and
Phos-tag SDS-PAGE analysis (Fig. 5b). Interesting, GBP can phosphorylate PGAM1 even though it could not form 3-pHis. From the PGAM1 enzymatic assay, bisphosphates containing metabolites FBP
and 2,3-BPG could activate the enzyme while GBP inhibited its activity (Fig. 5c). Sugar monophosphates F6P, F1P, G6P, G1P, M6P and M1P did not regulate the enzymatic activity of PGAM1. In
the meantime, the bisphosphate-containing structure has been found to be essential for PGAM1 activation. F1P holds the same three-carbon units containing C1-_O_-phosphate, C2-OH and C3-OH,
but it could not position its C1-_O_-phosphate to the opposite position of His11 from molecular docking (Supplementary Fig. 7d left). Likewise, F6P could not position its C6-_O_-phosphate to
PGAM1 His11 (Supplementary Fig. 7d right). This explains why neither F1P nor F6P could activate PGAM1 through His11 phosphorylation. GBP bearing two phosphates is able to inhibit the PGAM1
activity through occupying the active site but not donating its phosphate to His11 (Supplementary Fig. 7b). Compared to FBP, neither of the two phosphates in GBP, either in the α-cyclic form
or the β-cyclic form, could be positioned opposite to the catalytic His11 on PGAM1. Taken together, we could draw the conclusion that sugar bisphosphates (FBP, GBP and 2,3-BPG) show
influences on the phosphorylation and activation of PGAM1, but sugar monophosphates do not have such effect. To gain deeper molecular insights, we next designed and synthesized a series of
FBP analogues for SAR studies (Figs. 5d and 6). As the C1-_O_-phosphate, C6-_O_-phosphate, C2-OH and C3-OH are involved in the hydrogen-bonding network within the PGAM1 active site (Fig.
4c), we generated α- and β-methoxide on the anomeric C2 of the furanose ring to give α-MeFBP and β-MeFBP, to block the hydrogen-bonding and fix the sugar phosphate into its cyclic form with
absolute anomeric configuration (Fig. 6a). We modified the C1-_O_-phosphate of FBP with dimethyl phosphates to form 1-DMeFBP, with the purpose of inhibiting the phosphate donation process
(Fig. 6e). Likewise, we synthesized 6-DMeFBP that masks the C6-_O_-phosphate and 1,6-DMeFBP that masks both phosphates with methyl groups (Fig. 6c, d). 4-DeoxyFBP was also synthesized to act
as a mimic of FBP to retain the bisphosphates for PGAM1 phosphorylation (Fig. 6b). From Phos-tag SDS-PAGE and immunoblotting analysis, all of the six FBP analogues were found to be unable
to phosphorylate PGAM1 (Fig. 5e). From the PGAM1 enzymatic assay, α-MeFBP, β-MeFBP, 4-deoxyFBP, 1-DMeFBP, 6-DMeFBP and 1,6-DMeFBP all demonstrated inhibitory properties against PGAM1 (Fig.
5f). Among them, we measured the IC50 of the methyl phosphates 1-DMeFBP, 6-DMeFBP, 1,6-DMeFBP and gave 1.08 mM, 1.23 mM and 1.52 mM respectively (Fig. 5g). Molecular docking of PGAM1 with
six analogues showed that they are able to enter into the catalytic pocket of the enzyme but the C1-_O_-phosphate of such analogues cannot be positioned towards His11 of PGAM1 (Supplementary
Fig. 9a). As an example, we looked into the details of the interaction between 6-DMeFBP and PGAM1, and found that even the C1-_O_-phosphate, 2-OH and 3-OH of 6-DMeFBP form similar hydrogen
bonding network with the PGAM1 active site, the phosphate cannot be positioned at the opposite position of His11 (Supplementary Fig. 9b, c). These results suggested that the entire part of
FBP including bisphosphates and fructose backbone are necessary for PGAM1 phosphorylation. FBP ACTIVATES PGAM1 BY HIS PHOSPHORYLATION IN LIVING CELLS TO FEEDFORWARD GLYCOLYSIS AND SUPPORT
CANCER CELL PROLIFERATION We next investigated the downstream consequences of PGAM1 activation by FBP in living cells (Fig. 7). Dose-dependent histidine phosphorylation of PGAM1 by FBP
treatment was confirmed by immunoblotting analysis in living cells with overexpressed Flag-tagged PGAM1 (Fig. 7a). Through LC-MS/MS quantification we observed upregulation of cellular FBP
level after exogenous treatment of HepG2 cells with 10 mM FBP, ranging from 0.416 ± 0.056 mM to 1.435 ± 0.062 mM, indicating the successful uptake of FBP (Fig. 7b left). Accumulation of FBP
at such level may not reach the disease conditions that were reported as 7–25 mM.17,37 PGAM1 catalyzed the intervention of 3-PG to 2-PG and branched the glycolytic flux into the serine
synthesis pathway (SSP). As a downstream consequence of PGAM1 activation, the 2-PG/3-PG ratio was significant increased by 10 mM exogenoues FBP treatment (Fig. 7b right and Supplementary
Fig. 4f, g). Similar as FBP activation of PKM2, we regard PGAM1 activation by FBP phosphorylation as an intrapathway feedforward mechanism to support glycolysis in cancer cells. We observed
significant increases of both lactate production and glucose consumption by FBP treatment (Fig. 7c), suggesting upregulation of glycolysis by FBP treatment in living cells. PGAM1 has been
regarded as a therapeutic target in hepatocellular carcinoma46 and reported to play a significant role in coordinating glycolysis and biosynthesis to promote tumor growth47 and cancer cell
migration48. PGAM1 activation by FBP resulted in significantly upregulated cell proliferation and the effect of FBP was abolished in HepG2 cells with PGAM1-knockout (KO) by a specific sgRNA
(Fig. 7d and Supplementary Fig. 10), suggesting a positive intrapathway feedback role of central glycolytic metabolite FBP in promoting cancer cell proliferation by activating its downstream
metabolic enzyme PGAM1. The supportive role of FBP on accelerating glycolysis and cancer cell proliferation was confirmed by the opposite effects of its synthetic analogue 1-DMeFBP that
inhibits PGAM1 activity. Synthetic PGAM1 inhibitors 1-DMeFBP, 6-DMeFBP and 1,6-DMeFBP were all found to be able to inhibit cell preliferation (Fig. 7e). Among the three FBP analogues,
1-DMeFBP showed strongest inhibition against HepG2 cells proliferation, therefore we continued detailed studies using this analogue. We observed dose-dependant decrease of histidine
phosphorylation level of Flag-tagged PGAM1 in living HepG2 cells by 1-DMeFBP treatment (Fig. 7f). 1-DMeFBP significantly downregulated lactate production and glucose consumption, indicating
its inhibitory role on glycolysis by targeting PGAM1 in HepG2 cells (Fig. 7g). Consistently, cell proliferation was significantly inhibited by 1-DMeFBP treatment and and it was abolished in
PGAM1-KO cells (Fig. 7h). These studies suggested that FBP activates PGAM1 in living cells by histidine phosphorylation to support glycolysis and cancer cell proliferation, while its
analogues exhibit a contrary effect as a type of orthostatic inhibitor of PGAM1 (Fig. 7i). Our study hence provides a unique perspective on developing pharmacological molecules to regulate
and study PGAM1 based on its specific interaction with endogenous sugar metabolite FBP. DISCUSSION Highly abundant intracellular metabolites actively engage with various metabolic enzymes
from both intra- and interpathway in the forms of allosteric or orthosteric modulation, which fabricates a complex and dynamic network to regulate the cell behaviors and fates in response to
nutrient availability and environmental cues19,21,49. In terms of the interactions between sugar metabolites and enzymes, emerging evidences show that sugar metabolites not only regulate
specific upstream or downstream metabolic enzymes for intrapathway feedforward and feedback regulations, but also crosstalk with inter-pathway metabolic enzymes to maintain cellular redox
homeostasis47,50. Comprehensive identification of the interaction network between sugar metabolites and their target proteins especially those intra- and interpathway metabolic enzymes will
facilitate deeper understandings of the underlying regulatory mechanisms of sugar metabolism reprogramming and provide directions for disease diagnosis and treatment through targeting
aberrant sugar metabolism. Derivatization-free chemical proteomic strategies enable the profiling of the native forms of sugar metabolite interactomes which serve as powerful tools to
interpret the precise mechanism of actions of sugar metabolite signaling in living systems19,20,21,22. From our unbiased global profiling of the interacting proteins of the central
glycolytic metabolite FBP based on a TPP strategy in HepG2 cells, a series of unreported FBP-interacting proteins have been discovered containing a considerable population of enzymes
involved in the phosphate transfer process. Following with such a unique feature of sugar metabolite with bisphosphate, we validated the functional regulation role of FBP towards sugar
metabolic enzymes PGAM1, PGM1 and PMM2 that share a communal “ping-pong” catalytic mechanism for the interconversion of sugar phosphate substrates. PGAM1 is overexpressed in many kinds of
cancers, PGM1 and PMM2 are two important biomarkers closely related to glycosylation disorder diseases. Studies on endogenous regulations of these enzymes should facilitate better
understanding of their roles in human diseases and the development of intervention strategy. Here we disclosed the unreported activating property of FBP towards its intrapathway downstream
metabolic enzyme PGAM1, as well as its inhibitory activity against inter-pathway sugar metabolic enzymes PGM1 and PMM2. These findings may provide fundamental references for further
exploration of their psychopathological relevance. Comprehensive studies have been conducted to determine the molecular details of PGAM1 activation by FBP. As an interesting discovery, we
found that FBP acts as a phosphorylation donor to activate the catalytic His11 by generating 3-pHis modification on PGAM1. And it was confirmed by LC-MS/MS, immunoblotting and Phos-tag
SDS-PAGE analysis. Such 3-pHis modification was generated immediately upon FBP-PGAM1 interaction, with no cofactor or enzyme required, and we defined the phosphorylation process as an
autocatalytic reaction. Molecular docking and MD simulations demonstrated that the FBP interacts with PGAM1 in a very specific manner mediated by the hydrogen bonding network between its
C1_-O_-phosphate, C6_-O_-phosphate, C2-OH, C3-OH and the binding sites within the catalytic pocket of PGAM1. FBP is very likely to be fitted into the pocket and donate either its
C1-_O_-phosphate or its C6-_O_-phosphate to the N3 of catalytic His11 and then activates the enzyme immediately. It shows that the flexibility of PGAM1 catalytic pocket which allows a
six-carbon sugar metabolite besides its three-carbon substrates 2-PG, 3-PG and cofactors 2,3-BPG, PEP and 1,3-BPG34,35. Such metabolite-metabolic enzyme interaction has been proved to be
specific since other endogenous sugar phosphates with a six-carbon sugar backbone such as F1P, F6P, G1P, G6P, M1P and M6P cannot activate PGAM1. FBP analogues, including α-MeFBP, β-MeFBP,
4-deoxyFBP, 1-DMeFBP, 6-DMeFBP and 1,6-DMeFBP that block the hydrogen bonding interaction between FBP and PGAM1 were designed and obtained by chemical synthesis. Compared with FBP, they all
show inhibiting effects against PGAM1 enzymatic activity and therefore offered a type of PGAM1 inhibitors based on the endogenous sugar metabolite scaffold. FBP activates PGAM1 in living
cancer cells to support the Warburg effect and cell proliferation. Given the significant role of PGAM1 in tumor growth and cancer cell migration, such specific interaction between the
endogenous glycolytic metabolite FBP with the glycolytic enzyme PGAM1 might work as a unique feedforward mechanism, mediated by covalent signaling through histidine phosphorylation, to
support energy and biomass demands in proliferating cancer cells. Representative PGAM1 inhibitor 1-DMeFBP was found to be able to reduce its histidine phosphorylation level in living cells
and afterwards reduce glycolysis and inhibit cell proliferation. 1-DMeFBP served as a valuable tool compound to confirm the signaling role of FBP in intrapathway PGAM1 phosphorylation,
glycolysis acceleration as well as the supportive effect for cancer cell proliferation. Importantly, 1-DMeFBP is an orthostatic inhibitor of PGAM1 that derivatized from an identified
endogenous PGAM1 activator. Our study offers an approach of manipulating cell fates through chemical regulation of the interactions between sugar metabolite and metabolic enzymes. METHODS
CELL CULTURE HepG2 and HEK293T cells were obtained from China Center for Type Culture Collection and maintained in DMEM supplemented with 10% (vol/vol) FBS, 100 U/mL penicillin, and 100
mg/mL streptomycin in a humidified atmosphere at 37 °C with 5% CO2. The cells were harvested by scraping and the pellets were washed with phosphate buffered saline (PBS). After
centrifugation, the cells were collected, frozen and stored at −80 °C. SGRNA AND PLASMIDS TRANSFECTION LentiCRISPR v2 system was employed to knock out PGAM1 in HepG2 cell51, and the sgRNA
sequences were designed as following: sgPGAM1-F1 CACCGACAGCAACATCAGTAAGGTA sgPGAM1-R1 AAACTACCTTACTGATGTTGCTGTC HEK293T cells were grown in DMEM supplemented with 10% FBS to 60% confluence.
The transfection complex was prepared as following according to the manufacturer’s instructions. The pLKO.1-PGAM1 sgRNA vector was added to Lipofectamine3000 (Invitrogen) in 500 µL OPTI-MEM
serum-free medium along with psPAX2 packaging vector and pMD2.G envelop vector (4:3:1). About 6 h after transfection, the media was replaced by fresh DMEM containing 10% FBS. After
additional 48 h incubation at 37 °C, the supernatant was collected, filtered by 0.45 µm microfiltration membrane and infected HepG2 cells in the presence of 10 µg/mL polybrene (Millipore)
for 24 h. Cells stably expressing PGAM1 sgRNA were selected in the presence of puromycin (1 mg/mL) before plating for experiments. WESTERN BLOT ANALYSIS Cells were collected by RIPA lysate
(Beyotime) with cocktail protease and phosphatase inhibitors (Beyotime) and protein concentrations were determined using a BCA assay (Thermo Scientific), normalized to 2 mg/mL in 25 µL
lysate. After adding 6.25 µL loading buffer, proteins were subjected to SDS-PAGE separation and transferred to PVDF membranes (Immobilon-P, Millipore). Membranes were blocked for 1 h at room
temperature with 5% milk in Tris-buffered saline with 0.1% Tween-20 (TBST) and blotted with primary antibodies at 4 °C more than 12 h. The following antibodies were used: anti-PGAM1,
anti-PGM1, anti-1pHis, anti-3pHis, anti-PMM2, anti-GAPDH, anti-PRPS1, anti-SOS1, anti-ALDOA, anti-GARS, anti-HDAC2 (Abcam). Anti-POLR2A, anti-PDXDC1, anti-PNPT1 and anti-TRIM25, anti-RAN,
anti-OXSR1, anti-PKLR (Proteintech). After washing with TBST three times for 30 min, membranes were incubated with horseradish peroxidase-conjugated anti-rabbit IgG (1:5000) or anti-mouse
IgG (1:5000) antibodies at room temperature for 1 h and the immunoblots were scanned with ECL (Thermo Fisher Scientific). MOLECULAR DOCKING The crystal structure of human B type
phosphoglycerate mutase H11 phosphorylated form (PDB: 4gpz) is uploaded from the RCSB database at a resolution of 1.65 Å. A molecular docking study was carried out to determine the
interactions between candidate molecules and the PGAM1 active site. Referring to the template of His11 phosphorylated PGAM1 by cofactor 2,3-BPG with ligand 2-(_N_-morpholino) ethanesulfonic
acid (MES)52, amino acids within 10 Å around His11 were selected for molecular docking of sugar phosphates. Waters were deleted except the one form water bridge with the small molecule and
residues of the protein. After the addition of missing hydrogen atoms by standard protein preparation protocol. The structure of FBP was minimized using Tripos force field. The docking of
FBP was carried out using Flexx with standard precision protocol in Tripos software. In the end, the default 30 binding conformations were given. MOLECULAR DYNAMICS (MD) SIMULATION The
atomic coordinates of the PGAM1 complex were extracted from the docking model. These PGAM1 complex structures were constructed by Flexx with standard precision protocol in Tripos software.
All initial structures were first minimized in Discovery studio 2023 to eliminate any possible overlaps or clashes. CHARMm was used to perform efficient simulations with periodic boundary
conditions. Hydrogen atoms were added using the Discovery studio 2023. Counterions were used to maintain system neutrality. All systems were solvated in a truncated octahedron box of waters
with a buffer of 12 Å. The pairwise interactions (van der Waals and direct Coulomb) were computed with a cutoff distance of 8 Å. All MD simulations were accelerated with the CUDA version of
PMEMD in GPU cores of NVIDIA Tesla K20. In order to impress the importance of different residues during the MD simulation, we found the non-bond monitor of MD simulation of PGAM1–FBP complex
(FBP donates its C1-_O_-phosphate to the catalytic His11 of PGAM1) and PGAM1–FBP complex (FBP donates its C6-_O_-phosphate to the His11 of PGAM1), then we calculated the probability of
hydrogen bonding between FBP and different PGAM1 active site residues. PGAM1 ENZYME ACTIVITY ASSAY The PGAM1 enzyme activity assay was operated as previously reported53. Briefly, after
incubation of FBP dissolved in H2O of indicated concentration with 49 µL of 50 nM recombinant PGAM1, 50 µL enzyme mix containing 100 mM Tris-HCl, 100 mM KCl, 5 mM MgCl2, 1 mM ADP, 0.2 mM
NADH, 4 mM 3-PG, 3 units/mL enolase (Sigma–Aldrich), 3 units/mL recombinant pyruvate kinase M2 (Sigma–Aldrich), and 0.6 units/mL recombinant LDH (Sigma–Aldrich) was added. The decrease in OD
at 340 nm was measured as PGAM1 activity. PGM1 AND PMM2 ENZYME ACTIVITY ASSAY The enzyme activity of PGM1 was monitored using Phosphoglucomutase Activity Assay kit (ab155896). The PMM2
enzyme activity assay was operated as previously reported54. The assay was carried out for 3–4 h, with absorbance readings every 30 min at 340 nm. All of the reagents needed to convert
mannose 1-phosphate to gluconate 6-phosphate and NADPH were added to the samples except for the enzyme measured in the assay. The reaction solution consisted of 50 mM HEPES (pH 7.1), 5 mM
MgCl2, 2 µg/mL phosphoglucose isomerase (Roche), 1.7 µg/mL phosphomannose isomerase (Sigma-Aldrich), 10 µg/mL glucose 6-phosphate dehydrogenase (Roche), 1 µM glucose 1,6-bisphosphate, 0.25
mM NADP (Roche), and 0.34 mM mannose 1-phosphate (Sigma-Aldrich). Assay buffer without the substrate mannose 1-phosphate was used as the control. THERMAL PROTEOME PROFILING Cellular thermal
shift assay experiments were performed as previously described23. Briefly, HepG2 cells were resuspended in ice-cold PBS (containing EDTA-free cocktails and 0.1% Triton) and lysed by
sonication in ice and the cell lysates were collected by centrifugation (20,000 g, 30 min) at 4 °C to remove the debris. The protein concentration was determined by using the BCA protein
assay kit (Pierce). 1 M FBP stock or H2O was added to the cell extract to HepG2 cell lysates (2 mg/mL) with 5 mM final FBP concentration. The samples were then incubated for 30 min at 25 °C,
divided into 6 aliquots and transferred into 0.2 mL polymerase chain reaction (PCR) tubes. Each sample was heated in parallel for 3 min to the respective temperature (range: 37–62 °C).
Subsequently, the samples were centrifuged at 20,000 g for 20 min at 4 °C and supernatant was collected. The supernatant was divided into two parts. One part was subjected to
gel-electrophoresis for western blotting analysis, the other part of 57 °C group and 37 °C group were for in-solution digestion, dimethyl labeling and LC-MS/MS analysis (For the proteome
profiling, we determined the temperature points 57 °C according to the previous TPP studies where Tm of the majority of the proteins fall at 57 °C). IN-SOLUTION DIGESTION AND DIMETHYL
LABELING Each sample was transferred into a 10-K filter and changed with 6 M urea/100 mM TEAB buffer for three times to remove FBP. 10 mM DTT was added and incubated at 37 °C for 30 min
followed by the addition of 20 mM iodoacetamide (IAA) for 30 min at 37 °C in the dark. The samples were changed with 100 mM TEAB buffer for four times to remove excess urea, DTT and IAA. 2.5
µg trypsin resuspended in 100 mM TEAB was added into per 100 µg of proteome samples and digested overnight at 37 °C. Then peptide samples were labeled with dimethyl reagents. The 57 °C
heated group were reacted with 4 μL of 4% “light” formaldehyde (CH2O) (Sigma) every 100 μL peptides, 37 °C heated group were reacted with “heavy” formaldehyde (13CD2O) (Sigma), respectively.
The resulting solution were treated with 4 μL of 0.6 M sodium cyanoborohydride (Sigma) and incubated at room temperature for 1 h. The reaction was quenched by adding 16 μL of 1% ammonia and
8 μL of 5% formic acid. The “light” and “heavy” samples were combined and subjected for fraction. The peptides were separated into 20 fractions by a high-pH reverse phase C18 column (Agela
Technologies) using Agilent HPLC system. Mobile phase A: 2% MeCN–98% H2O (adjusted to pH 10 with NH3·H2O); B: 98% MeCN–2% H2O (adjusted to pH 10 with NH3·H2O). Samples were separated using a
20 min gradient of buffer B at a flow rate of 1 mL/min, as follows: 0 min 0% B; 0.1 min 5% B; 1 min 8% B; 7 min 14% B; 12 min 24% B; 16 min 40% B; 18 min 95% B; 20 min 15% B. The columns
were operated at 45 °C and the temperature was controlled by a built-in column heater. The 20 fractions were combined into 12 fractions, dried in a SpeedVac and subjected to LC-MS/MS
analysis. PROTEIN EXPRESSION AND PURIFICATION DNA encoding PGAM1 (NP_002620.1), PKM2 (NP_001193725.1), PMM2 (NP_000294.1), PGM1 (NP_001166289.1), PKLR (000289.1), EHHADH (NP_001957.2), HDAC2
(NP_001518.3), OXSR1 (NP_005100.1), PDXDC1 (NP_055842.2), RAN (001287725.1), PGI (NP_000166.2), G6PD (NP_000393.4), PRPS1 (NP_001191331.1), ENO1(NP_001188412.1), LDHA (NP_001128711.1), NEM2
(NP_002503.1) and GAPDH (NP_001243728.1), were amplified from HepG2 cell line cDNA libraries as the template and individually cloned into a modified pET-32M vector with Trx tag removed. All
mutants were created using the standard two-step PCR methods. The primers used for constructing the mutants are shown in Supplementary Dataset 4. All plasmids were transferred into _E.
coli_ BL21 (DE3) cells. The cells were cultured in LB media (containing 5 g yeast extract, 10 g NaCl and 10 g tryptone per 1 L) at 37 °C until OD at 600 nm reached between 0.6 and 0.8. The
protein overexpression was induced by the addition of IPTG to a final concentration of 0.1 mM. After IPTG induction at 16 °C for 16 h, bacterial cells were collected by centrifuging at 4000
rpm for 20 min, and frozen at −20 °C until further use. The collected bacteria were resuspended in 50 mM Tris, pH 8.0, 500 mM NaCl, 5 mM imidazole. The bacteria cells were lysed by
sonication. The supernatant was collected after centrifugation at 15,000 g for 30 min and loaded on Ni-chelating Ni2+ Sepharose 6 FF beads (Cytiva). After washed by 50 mM Tris, pH 8.0, 500
mM NaCl, 30 mM imidazole, the target proteins were eluted by buffer containing 50 mM Tris, pH 8.0, 500 mM NaCl, 30 mM imidazole. The elution was purified by size-exclusion chromatography
(HiLoad 26/60 Superdex 200 pg/ HILOAD 26/600 SUPERDEX 75 PG, Cytiva) in 50 mM Tris, PH 7.5, 100 mM NaCl, 1 mM DTT. The recombinant PGAM1 were subjected to a further purification step by
ion-exchange chromatography (HiPrep Q HP 16/10, Cytiva) followed by desalting (PD-10, Cytiva) to a buffer containing 50 mM Tris, pH 7.5, 100 mM NaCl, 5 mM MgCl2. THERMAL SHIFT ASSAY WITH
PURIFIED RECOMBINANT PROTEINS Each purified protein (0.2 μg/μL) was treated with FBP or H2O at 25 °C for 30 min. The mixture was divided into six aliquots and transferred into 0.2 mL PCR
tubes. All of the FBP or H2O-treated samples were heated in parallel for 3 min to their specified temperatures, respectively. The samples were subsequently centrifuged at 20,000 g for 20 min
at 4 °C and the supernatants were collected for SDS-PAGE analysis. The gel was stained by Coomassie blue. CELL VIABILITY ASSAY HepG2 cells (5000 cells/well) were seeded in 96-well plates
allowed to adhere overnight and treated with a diluted series of FBP with no glucose medium or 5 mM glucose for 24 h, or treated with a diluted series of FBP derivatives with 25 mM glucose
medium for 24 h or 48 h. Cell viability was determined using the Cell Counting Kit-8 (CCK8) colorimetric assay. The results were analyzed and displayed using GraphPad Prism 9.0. LC-MS/MS
QUANTIFICATION OF INTRACELLULAR FBP CONCENTRATIONS HepG2 cells were seeded in 6-well plates (2 × 10⁶ cells/well) in triplicates allowed to adhere overnight. Treatment groups were stimulated
by 10 mM FBP for 0.5 h in medium with 5 mM or 25 mM glucose supplement. Control groups were treated with H2O. All cells samples were washed with PBS three times and extracted with 500 µL of
MeOH: H2O mixture (8:2, v/v, −80 °C) with 0.1 µg/mL 13C6-FBP in it as internal standard for quantification. Samples were centrifuged for 15 min at 20,000 g and 4 °C to settle any particulate
matter. Supernatants were dried in a SpeedVac and submitted to LC-MS/MS analysis on Agilent 6490 Triple Quadrupole LC-MS system. Chromatographic separations were carried out on an ACQUITY
UPLC BEH Amide (2.1 × 100 mm, 3.5 mm) at an oven temperature of 40 °C. The mobile phase of LC-MS/MS was composed of 10 mM NH4HCO3 in Milli-Q Water (A) and Acetonitrile (B) in negative ion
mode. Maintained at a flow rate of 0.3 mL/min for 2 min in the 5% phase B, the B ratio rose to 23% in 2–3 min, then returned to the 5% B phase to in 3–5 min and remained until 8 min.
DERIVATIZATION BASED LC-MS/MS METHOD FOR DETECTION OF F6P AND F1P The purified PGAM1 (10 mg/mL in enzyme buffer) was diluted to 1.5 mg/mL by H2O, then incubated with 10 mM FBP (sample) or
H2O (control) as the reaction system at 25 °C. At the pointed time, fixed volume of the reaction system was diluted to ten-time volume and then PGAM1 was removed by filter in 5 minutes at 4
°C. The remaining buffer with metabolites was collected. The derivatization reagent, 2-(diazo-methyl)-_N_-methyl-_N_-phenyl-benzamide (2-DMBA) was used to obtain better separation and
identification of F1P and F6P. Briefly, 80 μL of borate buffer (50 mM, pH 7.0) and 10 μL of 2-DMBA were mixed with 10 μL sample, and the reaction solution was vortexed and then incubated at
30 °C for 1 h. LC-MS/MS analysis was performed on Agilent 6490 Triple Quadrupole LC-MS system, and chromatographic separations were carried out on an ACQUITY UPLC HSS T3 C18 Amide (2.1 × 150
mm, 1.8 mm) at an oven temperature of 50 °C. The mobile phase was composed of 0.1% formic acid in Water (A) and Acetonitrile (B) in negative ion mode. The modified gradients (v/v) were as
following: 0–2 min, 5% (B); 2–40 min, 5–35% (B); 40–40.5 min, 35–90% (B); 40.5–45 min, 90–5% (B), followed by 7 min of re-equilibration with 5% B. MS parameters for the MRM transitions were
optimized by direct infusion. LC-MS/MS DETECTION OF 3-PG AND 2-PG HepG2 cells were seeded in 6-well plates (2 × 10⁶ cells/well) in triplicates allowed to adhere overnight. Treatment groups
were stimulated by 10 mM FBP for 0.5 h in 5 mM glucose or 1 mM 1-DMeFBP for 24 h in 25 mM glucose. Control groups were treated with H2O. All cell samples were extracted with 500 µL of MeOH:
H2O mixture (8:2, v/v, −80 °C). Samples were centrifuged for 15 min at 20,000 g and 4 °C to settle any particulate matter. Supernatants were dried in a SpeedVac and taken to LC-MS/MS
analysis. Chromatographic separations were carried out on an ACQUITY UPLC BEH Amide (2.1 × 100 mm, 3.5 mm) at an oven temperature of 4 °C. The mobile phase of LC-MS/MS was composed of 10 mM
NH4HCO3 in Milli-Q Water (A) and MeCN (B) in negative ion mode. Maintained at a flow rate of 0.3 mL/min for 2 min in the 5% phase B, the B ratio rose to 23% in 2–3 min, then returned to the
5% B phase to in 3–5 min and remained until 8 min. 3-PG and 2-PG both generate fragments with m/z 79 and 97, but at different ratios. The standard mixtures containing 3-PG and 2-PG (in the
ratio of 100:0, 80:20, 60:40, 40:60, 20:80, and 0:100) were used to generate a standard curve of 97/(79 + 97). The 97/(79 + 97) value from experimental samples was calculated and converted
into the 3-PG/total mono-PG ratio using the standard curve. The absolute concentration of mono-PG in WT cells was measured as described. The ion counts of 3-PG and 2-PG were converted to
absolute concentrations by normalizing to the WT total mono-PG concentration. GLUCOSE CONSUMPTION AND LACTATE PRODUCTION HepG2 cells were cultured in 96 wells overnight. The cells were
treated with H2O or 10 mM FBP for 0.5 h, or treated with H2O or 1 mM 1-DMeFBP for 24 h. Glucose consumption in the culture medium were measured using the Glucose (GO) Assay Kit (Abnova)
whereas lactate levels in the culture medium were determined using a Lactate Assay Kit (Cayman). MICROSCALE THERMOPHORESIS (MST) ANALYSIS Purified PGAM1, PGM1 and PMM2 was labeled on lysine
residues using the Protein Labeling Kit RED-NHS 2nd Generation (NanoTemper Technologies). Measurements were carried out in MST-buffer (50 mM Tris-HCl, pH 7.5, 100 mM NaCl, 0.05% Tween-20).
The labeled protein was mixed with FBP and incubated for 30 min at room temperature in the dark before being loaded into Monolith NT.115 Capillaries (Nano Temper Technologies). Samples were
then transferred into the Monolith NT.115 device and MST experiments were carried out at Nano-red. MST was measured using a Monolith NT.115 instrument (NanoTemper Technologies) at an ambient
temperature of 23.5 °C. Instrument parameters were 20% excitation power and Medium MST power. Error bars = SD from two independent experiments. MS IDENTIFICATION OF PHOSPHORYLATION SITES
INDUCED BY FBP Purified PGAM1 (0.2 μg/μL) was incubated with 10 mM FBP or H2O at 25 °C for 30 min. Then the sample was transferred into a 10-K filter and changed with 6 M urea/100 mM TEAB
buffer for three times to remove FBP. 10 mM 1,4-dithiothreitol (DTT) was added and incubated at 37 °C for 30 min followed by the addition of 20 mM iodoacetamide (IAA) for 30 min at 37 °C in
the dark. The samples were changed with 100 mM TEAB buffer for four times to remove excess urea, DTT and IAA. 1 µg trypsin resuspended in 100 mM TEAB was added into per 50 µg of proteome
samples and digested overnight at 37 °C. Then peptide samples were desalted by a C18 column tip, and elution was dried in a SpeedVac and subjected to LC-MS/MS analysis. LC-MS/MS BASED
PROTEOMIC ANALYSIS LC-MS/MS analysis was performed on an Orbitrap Fusion Lumos Tribrid mass spectrometer (Thermo Fisher Scientific) coupled with an Ultimate 3000 LC system. The peptides were
chromatographically separated by a 90 min gradient from 5% to 40% solvent B (A = 0.1% formic acid in water, B = 0.1% formic acid in 80% MeCN) at a flow rate of 300 nL/min. Under the
positive-ion mode, full-scan mass spectra were acquired over the m/z range from 350 to 1800 using the Orbitrap mass analyzer with mass resolution setting of 70,000. MS/MS fragmentation was
performed in a data-dependent mode, of which the 20 most intense ions were selected from each full-scan mass spectrum for high-energy collision induced dissociation (HCD) and MS/MS analysis.
MS/MS spectra were acquired with a resolution setting of 35,000 using the Orbitrap analyzer. Other parameters in the centroid format: isolation window, 1.2 m/z units; default charge, 2+;
normalized collision energy, 32%; maximum IT, 100 ms; dynamic exclusion, 20.0 s. DATA ANALYSIS For the dimethyl labeling-based experiments, LC-MS/MS data was first analyzed by ProLuCID55
with static modification of cysteine (+57.0215 Da, carbamidomethyl). The isotopic modifications (28.0313, and 34.0757 Da for light and heavy labeling respectively) are set as variable
modifications on the N-terminal of a peptide and lysines. The ratios of reductive dimethylation were quantified by the CIMAGE software56. CHEMICAL COMPOUNDS FBP, F1P, G6P, G1P, M6P and M1P
were purchased from Sigma-Aldrich. FBP analogues (α-MeFBP, β-MeFBP, 4-deoxyFBP, 1,6-DMeFBP, 6-DMeFBP and 1-DMeFBP) were synthesized as described in the Supporting Information. STATISTICS All
statistical analyses were performed using GraphPad Prism 9.0. The respective figure legends provide information on the specific statistical test used for each assay. REPORTING SUMMARY
Further information on research design is available in the Nature Portfolio Reporting Summary linked to this article. DATA AVAILABILITY The mass spectrometry proteomics data have been
deposited to the ProteomeXchange Consortium (https://proteomecentral.proteomexchange.org) via the iProX partner repository57,58 with the dataset identifier PXD048243
[http://proteomecentral.proteomexchange.org/cgi/GetDataset?ID=PXD016640] (2D-TPP experiments in Jurkat cells). Molecular dynamics (MD) simulation data for the process of phosphate transfer
from FBP to PGAM1 are available via https://doi.org/10.5281/zenodo.13836214. All NMR data are available in the Supplementary Information. All remaining data are available in the Article,
Supplementary Information, and Source Data files. Source data are provided with this paper. The data that support the findings of this study are available from the corresponding authors upon
request. Source data are provided with this paper. REFERENCES * Hay, N. Reprogramming glucose metabolism in cancer: can it be exploited for cancer therapy? _Nat. Rev. Cancer_ 16, 635–649
(2016). Article CAS PubMed PubMed Central Google Scholar * Faubert, B., Solmonson, A. & DeBerardinis, R. J. Metabolic reprogramming and cancer progression. _Science_ 368, eaaw5473
(2020). Article CAS PubMed PubMed Central Google Scholar * Warburg, O. On the origin of cancer cells. _Science_ 123, 309–314 (1956). Article ADS CAS PubMed Google Scholar * Vander
Heiden, M. G., Cantley, L. C. & Thompson, C. B. Understanding the Warburg effect: the metabolic requirements of cell proliferation. _Science_ 324, 1029–1033 (2009). Article ADS Google
Scholar * Wang, X. et al. UDP-glucose accelerates SNAI1 mRNA decay and impairs lung cancer metastasis. _Nature_ 571, 127–131 (2019). Article CAS PubMed Google Scholar * Ma, J. et al.
Glycogen metabolism regulates macrophage-mediated acute inflammatory responses. _Nat. Commun._ 11, 1769 (2020). Article ADS CAS PubMed PubMed Central Google Scholar * Ho, P.-C. et al.
Phosphoenolpyruvate is a metabolic checkpoint of anti-tumor T Cell responses. _Cell_ 162, 1217–1228 (2015). Article CAS PubMed PubMed Central Google Scholar * Wang, C. et al.
ENO2-derived phosphoenolpyruvate functions as an endogenous inhibitor of HDAC1 and confers resistance to antiangiogenic therapy. _Nat. Metab._ 5, 1765–1786 (2023). Article PubMed Google
Scholar * Taylor, S. R. et al. Dietary fructose improves intestinal cell survival and nutrient absorption. _Nature_ 597, 263–267 (2021). Article ADS CAS PubMed PubMed Central Google
Scholar * Lin, R. et al. 6-Phosphogluconate dehydrogenase links oxidative PPP, lipogenesis and tumor growth by inhibiting LKB1–AMPK signaling. _Nat. Cell Biol._ 17, 1484–1496 (2015).
Article CAS PubMed PubMed Central Google Scholar * Zhang, W. et al. Lactate is a natural suppressor of RLR signaling by targeting MAVS. _Cell_ 178, 176–189 (2019). Article CAS PubMed
PubMed Central Google Scholar * Cai, X. et al. Lactate activates the mitochondrial electron transport chain independently of its metabolism. _Mol. Cell_ 83, 1–17 (2023). Article Google
Scholar * Griffiths, C. A. et al. Chemical intervention in plant sugar signaling increases yield and resilience. _Nature_ 540, 574–578 (2016). Article ADS CAS PubMed Google Scholar *
Zhang, C. S. et al. Fructose-1,6-bisphosphate and aldolase mediate glucose sensing by AMPK. _Nature_ 548, 112–116 (2017). Article ADS CAS PubMed PubMed Central Google Scholar * Lim,
S.-O. et al. EGFR signaling enhances aerobic glycolysis in triple-negative breast cancer cells to promote tumor growth and immune escape. _Cancer Res._ 76, 1284–1296 (2016). Article CAS
PubMed PubMed Central Google Scholar * Peeters, K. et al. Fructose-1,6-bisphosphate couples glycolytic flux to activation of Ras. _Nat. Commun._ 8, 922 (2017). Article ADS PubMed
PubMed Central Google Scholar * Díaz-Ruiz, R. et al. Mitochondrial oxidative phosphorylation is regulated by fructose 1,6-bisphosphate. _J. Biol. Chem._ 283, 26948–26955 (2008). Article
PubMed Google Scholar * Li, Y. et al. Nuclear fructose-1,6-bisphosphate inhibits tumor growth and sensitizes chemotherapy by targeting HMGB1. _Adv. Sci._ 10, 2203528 (2023). Article ADS
CAS Google Scholar * Piazza, I. et al. A map of protein-metabolite interactions reveals principles of chemical communication. _Cell_ 172, 358–372. e23 (2018). Article CAS PubMed Google
Scholar * Cappelletti, V. et al. Dynamic 3D proteomes reveal protein functional alterations at high resolution in situ. _Cell_ 184, 545–559. e22 (2021). Article CAS PubMed PubMed Central
Google Scholar * Hicks, K. G. et al. Protein-metabolite interactomics of carbohydrate metabolism reveal regulation of lactate dehydrogenase. _Science_ 379, 996–1003 (2023). Article ADS
CAS PubMed PubMed Central Google Scholar * Tian, Y. et al. Chemoproteomic mapping of the glycolytic targetome in cancer cells. _Nat. Chem. Biol._ 19, 1480–1491 (2023). Article CAS
PubMed Google Scholar * Savitski, M. M. et al. Tracking cancer drugs in living cells by thermal profiling of the proteome. _Science_ 346, 1255784 (2014). Article PubMed Google Scholar *
Perrin, J. et al. Identifying drug targets in tissues and whole blood with thermal-shift profiling. _Nat. Biotechnol._ 38, 303–308 (2020). Article CAS PubMed Google Scholar * Huang, J.
X. et al. High throughput discovery of functional protein modifications by Hotspot Thermal Profiling. _Nat. Methods_ 16, 894–901 (2019). Article CAS PubMed PubMed Central Google Scholar
* Smith, I. R. et al. Identification of phosphosites that alter protein thermal stability. _Nat. Methods_ 18, 760–762 (2021). Article CAS PubMed PubMed Central Google Scholar * King,
D. T. et al. Thermal proteome profiling reveals the O‑GlcNAc-dependent meltome. _J. Am. Chem. Soc._ 144, 3833–3842 (2022). Article CAS PubMed PubMed Central Google Scholar * Martinez
Molina, D. et al. Monitoring drug target engagement in cells and tissues using the cellular thermal shift assay. _Science_ 341, 84–87 (2013). Article ADS PubMed Google Scholar * Jurica,
M. S. et al. The allosteric regulation of pyruvate kinase by fructose-1,6-bisphosphate. _Structure_ 6, 195–210 (1998). Article CAS PubMed Google Scholar * Dombrauckas, J. D.,
Santarsiero, B. D. & Mesecar, A. D. Structural basis for tumor pyruvate kinase M2 allosteric regulation and catalysis. _Biochemistry_ 44, 9417–9429 (2005). Article CAS PubMed Google
Scholar * Britton, H. G. & Clarke, J. B. Mechanism of the 2,3-diphosphoglycerate-dependent phosphoglycerate mutase from rabbit muscle. _Biochem. J._ 130, 397–410 (1972). Article CAS
PubMed PubMed Central Google Scholar * Quick, C. B., Fisher, R. A. & Harris, H. A kinetic study of the isozymes determined by the three human phosphoglucomutase loci PGM1, PGM2 and
PGM3. _Eur. J. Biochem._ 42, 511–517 (1974). Article CAS PubMed Google Scholar * Pirard, M. et al. Kinetic properties and tissular distribution of mammalian phosphomannomutase isozymes.
_Biochem. J._ 339, 201–207 (1999). Article CAS PubMed PubMed Central Google Scholar * Vander Heiden, M. G. et al. Evidence for an alternative glycolytic pathway in rapidly proliferating
cells. _Science_ 329, 1492–1499 (2010). Article ADS PubMed Central Google Scholar * Oslund, R. C. et al. Bisphosphoglycerate mutase controls serine pathway flux via 3-phosphoglycerate.
_Nat. Chem. Biol._ 13, 1081–1087 (2017). Article CAS PubMed PubMed Central Google Scholar * Van Schaftingen, E. & Jaeken, J. Phosphomannomutase deficiency is a cause of
carbohydrate-deficient glycoprotein syndrome type I. _FEBS Lett._ 377, 318–320 (1995). Article PubMed Google Scholar * Marín-Hernández, A. et al. Determining and understanding the control
of glycolysis in fast growth tumor cells. Flux control by an overexpressed but strongly product inhibited hexokinase. _FEBS J._ 273, 1975–1988 (2006). Article PubMed Google Scholar *
Park, J. O. et al. Metabolite concentrations, fluxes and free energies imply efficient enzyme usage. _Nat. Chem. Biol._ 12, 482–489 (2016). Article CAS PubMed PubMed Central Google
Scholar * Penhoet, E. E., Rajkumar, T. & Rutter, W. J. Multiple forms of aldolase in mammalian tissues. _Proc. Natl. Acad. Sci. USA_ 56, 1275–1282 (1966). Article ADS CAS PubMed
PubMed Central Google Scholar * Fuhs, S. R. et al. Monoclonal 1- and 3-phosphohistidine antibodies: new tools to study histidine phosphorylation. _Cell_ 162, 198–210 (2015). Article CAS
PubMed PubMed Central Google Scholar * Kinoshita, E., Kinoshita-Kikuta, E. & Koike, T. Separation and detection of large phosphoproteins using Phos-tag SDS-PAGE. _Nat. Protoc._ 4,
1513–1521 (2009). Article CAS PubMed Google Scholar * Li, S. et al. Ultrasensitive determination of sugar phosphates in trace samples by stable isotope chemical labeling combined with
RPLC-MS. _Anal. Chem._ 94, 4866–4873 (2022). Article CAS PubMed Google Scholar * Choi, K. H. & Tolan, D. R. Presteady-state kinetic evidence for a ring-opening activity in
fructose-1,6-(bis)phosphate aldolase. _J. Am. Chem. Soc._ 126, 3402–3403 (2004). Article CAS PubMed Google Scholar * Wang, Y. et al. Crystal structure of human B-type phosphoglycerate
mutase bound with citrate. _Biochem. Biophys. Res. Commun._ 331, 1207–1215 (2005). Article CAS PubMed Google Scholar * Hitosugi, T. et al. Tyr26 phosphorylation of PGAM1 provides a
metabolic advantage to tumors by stabilizing the active conformation. _Nat. Commun._ 4, 1790 (2013). Article ADS PubMed Google Scholar * Ren, F. et al. Quantitative proteomics
identification of phosphoglycerate mutase 1 as a novel therapeutic target in hepatocellular carcinoma. _Mol. Cancer_ 9, 81 (2010). Article PubMed PubMed Central Google Scholar *
Hitosugi, T. et al. Phosphoglycerate mutase 1 coordinates glycolysis and biosynthesis to promote tumor growth. _Cancer Cell_ 22, 585–600 (2012). Article CAS PubMed PubMed Central Google
Scholar * Zhang, D. et al. Phosphoglycerate mutase 1 promotes cancer cell migration independent of its metabolic activity. _Oncogene_ 36, 2900–2909 (2017). Article CAS PubMed Google
Scholar * Li, X., Gianoulis, T. A., Yip, K. Y., Gerstein, M. & Snyder, M. Extensive in vivo metabolite-protein interactions revealed by large-scale systematic analyses. _Cell_ 143,
639–650 (2010). Article CAS PubMed PubMed Central Google Scholar * Moellering, R. E. & Cravatt, B. F. Functional lysine modification by an intrinsically reactive primary glycolytic
metabolite. _Science_ 341, 549–553 (2013). Article ADS CAS PubMed PubMed Central Google Scholar * Sanjana, N. E. et al. Improved vectors and genome-wide libraries for CRISPR screening.
_Nat. Methods_ 11, 783–784 (2014). Article CAS PubMed PubMed Central Google Scholar * Hitosugi, T. et al. Tyr26 phosphorylation of PGAM1 provides a metabolic advantage to tumours by
stabilizing the active conformation. _Nat. Commun._ 4, 1790 (2013). Article ADS PubMed Google Scholar * Huang, K. et al. A novel allosteric inhibitor of phosphoglycerate mutase 1
suppresses growth and metastasis of non-small-cell lung cancer. _Cell Metab._ 30, 1107–1119 (2019). Article CAS PubMed Google Scholar * Iyer, S. et al. Repurposing the aldose reductase
inhibitor and diabetic neuropathy drug epalrestat for the congenital disorder of glycosylation PMM2-CDG. _Dis. Model Mech._ 12, dmm040584 (2019). Article CAS PubMed PubMed Central Google
Scholar * Xu, T. et al. ProLuCID: an improved SEQUEST-like algorithm with enhanced sensitivity and specificity. _J. Proteomics_ 29, 16–24 (2015). Article Google Scholar * Weerapana, E.
et al. Quantitative reactivity profiling predicts functional cysteines in proteomes. _Nature_ 468, 790–795 (2010). Article ADS CAS PubMed PubMed Central Google Scholar * Ma, J. et al.
iProX: an integrated proteome resource. _Nucleic Acids Res._ 47, D1211–D1217 (2019). Article PubMed Google Scholar * Chen, T. et al. iProX in 2021: connecting proteomics data sharing with
big data. _Nucleic Acids Res._ 50, D1522–D1527 (2021). Article PubMed Central Google Scholar Download references ACKNOWLEDGEMENTS We thank Prof. Xing Chen (PKU) for helpful discussions,
Prof. Chu Wang (PKU) for support of chemical proteomics, Dr. Xueshi Mao and Dr. Yue Zhou (IMM) for support of MD simulation, Prof. Jinlan Zhang and Dr. Zhe Wang (IMM) for targeted
metabolomics, Prof. Qin Li and Dr. Qian Wang (SKLNBD) for NMR and MST analysis. This work was funded by National Key Research and Development Plan (Grant No. 2021YFC2102900), National
Natural Science Foundation of China (Grants No. 22377148 and 22207126), CAMS Innovation Fund for Medical Sciences (Grant No. 2021-I2M-1-026), R & D Program of Beijing Municipal Education
Commission (Grant No. KZ202210028043), Non-profit Central Research Institute Fund of Chinese Academy of Medical Sciences (Grant No. 2021-RC350-002), and the Special Research Fund for
Central Universities, Peking Union Medical College (Grant No. 3332022042). Y.G. and H.L. are supported by “1000 Talents Plan” Young Investigator Program respectively. AUTHOR INFORMATION
Author notes * These authors contributed equally: Yanling Zhang, Yafei Cao. AUTHORS AND AFFILIATIONS * State Key Laboratory of Bioactive Substance and Function of Natural Medicines, Beijing
Key Laboratory of Active Substance Discovery of Active Substances Discovery and Druggability Evaluation, Institute of Materia Medica, Chinese Academy of Medical Sciences and Peking Union
Medical College, Beijing, China Yanling Zhang, Yafei Cao, Zhenghui Chen, Bowen Chen, Anhui Wang, Yanshen Guo, Ruolan Xue, Tian Li, Ruiqin Cheng, Ning Zhou, Huixin Luo & Yiqun Geng *
State Key Laboratory of Natural and Biomimetic Drugs, Chemical Biology Center, School of Pharmaceutical Sciences, Peking University, Beijing, China Xia Wu, Wei Chen & Houhua Li *
Synthetic and Functional Biomolecules Center, Beijing National Laboratory for Molecular Sciences, College of Chemistry and Molecular Engineering, Peking University, Beijing, China Zihua Liu,
Yuanpei Li & Yuan Liu * Beijing Key Laboratory of DNA Damage Response and College of Life Science, Capital Normal University, Beijing, China Jing Li * Jinhua Institute and College of
Pharmaceutical Sciences, Zhejiang University, Hangzhou, China Xiaohui Zhao * Department of Cardiology and Institute of Vascular Medicine, Peking University Third Hospital, Peking University,
Beijing, China Ming Xu Authors * Yanling Zhang View author publications You can also search for this author inPubMed Google Scholar * Yafei Cao View author publications You can also search
for this author inPubMed Google Scholar * Xia Wu View author publications You can also search for this author inPubMed Google Scholar * Zhenghui Chen View author publications You can also
search for this author inPubMed Google Scholar * Bowen Chen View author publications You can also search for this author inPubMed Google Scholar * Anhui Wang View author publications You can
also search for this author inPubMed Google Scholar * Yanshen Guo View author publications You can also search for this author inPubMed Google Scholar * Wei Chen View author publications
You can also search for this author inPubMed Google Scholar * Ruolan Xue View author publications You can also search for this author inPubMed Google Scholar * Zihua Liu View author
publications You can also search for this author inPubMed Google Scholar * Yuanpei Li View author publications You can also search for this author inPubMed Google Scholar * Tian Li View
author publications You can also search for this author inPubMed Google Scholar * Ruiqin Cheng View author publications You can also search for this author inPubMed Google Scholar * Ning
Zhou View author publications You can also search for this author inPubMed Google Scholar * Jing Li View author publications You can also search for this author inPubMed Google Scholar *
Yuan Liu View author publications You can also search for this author inPubMed Google Scholar * Xiaohui Zhao View author publications You can also search for this author inPubMed Google
Scholar * Huixin Luo View author publications You can also search for this author inPubMed Google Scholar * Ming Xu View author publications You can also search for this author inPubMed
Google Scholar * Houhua Li View author publications You can also search for this author inPubMed Google Scholar * Yiqun Geng View author publications You can also search for this author
inPubMed Google Scholar CONTRIBUTIONS Y.Z., H.L. and Y.G. conceived the project. Y.Z. conducted most of the experiments unless otherwise specified. Y.C. and R.X. carried out the synthesis of
six FBP analogues, X.W. and N.Z. conducted the expression and purification of target proteins. Z.C. helped with the biochemical validation of FBP targets. Y.C., B.C., and Y.-S.G. carried
out the molecular docking and MD simulations. Y.C., A.W., W.C. and T.L. performed targeted metabolomics experiments. R.C. helped with the MST experiments. Z.L. helped with the construction
of KO cell line, Y.-P.L. synthesized the Phos-tag reagent, Y.L. helped with MS/MS and MD data analysis. M.X., H.-X.L., X.Z. and J.L. helped with data analysis. Y.G. wrote the manuscript with
input from all authors. CORRESPONDING AUTHORS Correspondence to Yanling Zhang, Houhua Li or Yiqun Geng. ETHICS DECLARATIONS COMPETING INTERESTS The authors declare no competing interests.
PEER REVIEW PEER REVIEW INFORMATION _Nature Communications_ thanks Haifeng Chen, Andre Mateus and Ting Wang for their contribution to the peer review of this work. A peer review file is
available. ADDITIONAL INFORMATION PUBLISHER’S NOTE Springer Nature remains neutral with regard to jurisdictional claims in published maps and institutional affiliations. SUPPLEMENTARY
INFORMATION SUPPLEMENTARY INFORMATION REPORTING SUMMARY SUPPLEMENTARY DATA 1 SUPPLEMENTARY DATA 2 SUPPLEMENTARY DATA 3 SUPPLEMENTARY DATA 4 TRANSPARENT PEER REVIEW FILE SOURCE DATA SOURCE
DATA RIGHTS AND PERMISSIONS OPEN ACCESS This article is licensed under a Creative Commons Attribution-NonCommercial-NoDerivatives 4.0 International License, which permits any non-commercial
use, sharing, distribution and reproduction in any medium or format, as long as you give appropriate credit to the original author(s) and the source, provide a link to the Creative Commons
licence, and indicate if you modified the licensed material. You do not have permission under this licence to share adapted material derived from this article or parts of it. The images or
other third party material in this article are included in the article’s Creative Commons licence, unless indicated otherwise in a credit line to the material. If material is not included in
the article’s Creative Commons licence and your intended use is not permitted by statutory regulation or exceeds the permitted use, you will need to obtain permission directly from the
copyright holder. To view a copy of this licence, visit http://creativecommons.org/licenses/by-nc-nd/4.0/. Reprints and permissions ABOUT THIS ARTICLE CITE THIS ARTICLE Zhang, Y., Cao, Y.,
Wu, X. _et al._ Thermal proteome profiling reveals fructose-1,6-bisphosphate as a phosphate donor to activate phosphoglycerate mutase 1. _Nat Commun_ 15, 8936 (2024).
https://doi.org/10.1038/s41467-024-53238-w Download citation * Received: 25 January 2024 * Accepted: 08 October 2024 * Published: 16 October 2024 * DOI:
https://doi.org/10.1038/s41467-024-53238-w SHARE THIS ARTICLE Anyone you share the following link with will be able to read this content: Get shareable link Sorry, a shareable link is not
currently available for this article. Copy to clipboard Provided by the Springer Nature SharedIt content-sharing initiative