- Select a language for the TTS:
- UK English Female
- UK English Male
- US English Female
- US English Male
- Australian Female
- Australian Male
- Language selected: (auto detect) - EN
Play all audios:
Immunotherapy successfully complements traditional cancer treatment. However, primary and acquired resistance might limit efficacy. Reduced antigen presentation by MHC-I has been identified
as potential resistance factor. Here we show that the epigenetic regulator ubiquitin-like with PHD and ring finger domains 1 (UHRF1), exhibits altered expression and aberrant cytosolic
localization in cancerous tissues, where it promotes MHC-I ubiquitination and degradation. Cytoplasmic translocation of UHRF1 is induced by its phosphorylation on a specific serine in
response to signals provided by factors present in the tumor microenvironment (TME), such as TGF-β, enabling UHRF1 to bind MHC-I. Downregulation of MHC-I results in suppression of the
antigen presentation pathway to establish an immune hostile TME. UHRF1 inactivation by genetic deletion synergizes with immune checkpoint blockade (ICB) treatment and induces an anti-tumour
memory response by evoking low-affinity T cells. Our study adds to the understanding of UHRF1 in cancer immune evasion and provides a potential target to synergize with immunotherapy and
overcome immunotherapeutic resistance.
In recent years, immunotherapy has significantly improved the prognosis of patients with certain types of cancer1,2. The anti-cancer immunity process initiates with the priming and
activation of immune cells by antigen-presentation cells. Upon recirculate into the tumor, the activated immune cells recognize cognate antigens presented on MHC molecules of tumor cells,
leading to tumor cell destruction3. However, a majority of patients develop primary and acquired resistance to immunotherapy, with only a subgroup experiencing long-term benefits4.
Resistance is a multifactorial process; as a part of cancer-immune co-evolution, cancer cells develop multiple intrinsic and extrinsic mechanisms to evade anti-cancer immunity5. For
instance, impaired MHC-I antigen processing leads to acquired resistance to immune checkpoint blockade (ICB) treatment6. However, the complex molecular mechanisms whereby cancer cells
restrain MHC-I remain to be further explored.
The tumor microenvironment (TME) plays a critical role in cancer development and progression7. Aberrant features frequently observed in the TME include hypoxia, abnormal vasculature, and
altered metabolism8,9,10. Notably, dynamic intercellular communications occur within the TME7, resulting in biochemical cues that influence behaviors of both tumor and immune cells.
Moreover, through the activities of immune-suppressive cells (such as regulatory T cells and myeloid-derived suppressor cells) and molecules (e.g., TGF-β and IL-10), the TME in solid tumors
maintains an immune cold microenvironment11, effectively shielding tumor cells from immune surveillance12. Through co-evolution with tumor cells, the TME can further inhibit anti-cancer
immunity via hijacking mechanisms for selective advantage for tumor growth. For instance, tumor cells can reduce antigen presentation molecules through genetic or epigenetic regulation13,14,
leading to a suppressive TME. Conversely, a suppressive TME often reduces the production of interferons, potent stimulators of antigen presentation15,16, further constraining anti-tumor
immunity. Therapeutically facilitating the cold-to-hot transition in tumors could promote adequate T cell infiltration and mitigate immune suppression11, thereby enhancing the efficacy of
ICB therapy17. Consequently, developing strategies to overcome TME-induced immune suppression represents a promising avenue for enhancing the effectiveness of immunotherapy.
During cancer progression, tumor cells generally become more heterogeneous18. On the other hand, hosts develop a diverse tumor-reactive T cell repertoire comprised of TCRs with varying
affinities19,20. In contrast to high-affinity T cells, those T cells targeting tumor-associated antigens (TAA) may express low-affinity TCRs as a result of thymic selection19,21.
Functionally, high-affinity T cells against tumor-specific antigens (TSA) have a stronger effector response, whereas low-affinity T cells are more ready to form memory T cells as
demonstrated in the context of infection22,23. However, MHC-I antigen presentation is often compromised in the TME13,14, which may limit the formation of memory T cells critical for long
term tumor control and recurrence. Therefore, restoring MHC-I expression on tumor cells could potentially elicit CD8+ T cell responses to endogenous low-affinity TAAs derived from poorly
immunogenic tumors, thereby overcoming immunosuppression to achieve durable immunotherapy23.
Here, we found that the epigenetic regulator UHRF1 is involved in cancer immune evasion by downregulating MHC-I expression. This process is enabled by UHRF1’s aberrant cytosolic
localization, triggered by phosphorylation in response to factors in the TME. Furthermore, UHRF1 inactivation synergizes with ICB and induces anti-tumor memory responses. These findings
suggest that cytoplasmic UHRF1 could be a potential therapeutic target to enhance immunotherapy efficacy and address resistance in cancer treatment.
Alterations of epigenetic marks have been observed in multiple physiological and pathological conditions, including autoimmune disorders, aging, and cancer24,25. UHRF1, a key epigenetic
regulator, is well-documented to coordinate DNA methylation and histone modifications in the nucleus26. The PHD and SRA domains are critical for UHRF1 to maintain aberrant DNA methylation in
colorectal cancer (CRC) cells27. Analysis of the TCGA database by TIMER 2.028,29,30 revealed that UHRF1 mRNA is markedly upregulated in multiple cancer types, including lung adenocarcinoma
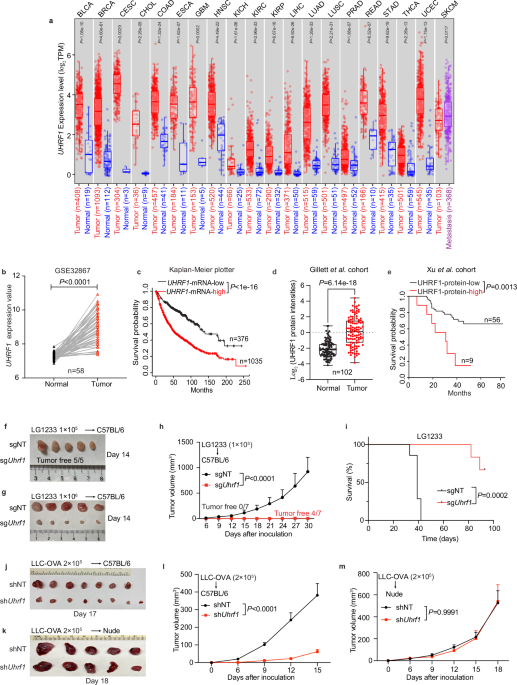
(LUAD) and lung squamous carcinoma (LUSC) (Fig. 1a). Supporting this finding, an independent analysis of LUAD cohort GSE3286731 demonstrated that UHRF1 mRNA levels are upregulated in tumors,
when compared with adjacent nonmalignant tissues (Fig. 1b). Moreover, analysis of an online dataset comprising 17 independent cohorts with 1411 total number of patients32 revealed that high
UHRF1 expression correlates with reduced survival rates in lung cancer patients (Fig. 1c). Notably, analysis of mass spectrometry data from the Gillett et al. cohort33 demonstrated
increased UHRF1 protein expression in non-small cell lung cancer (NSCLC) tumor tissues (Fig. 1d). In addition, result of the Xu et al. cohort34 suggested that higher levels of UHRF1 protein
expression are correlated with poor NSCLC patient prognosis (Fig. 1e), which is consistent with a previous report35. Together, these findings indicate that high expression of UHRF1
correlates with the progression of NSCLC and poor prognosis of those patients.
a UHRF1 expression in cancers versus normal tissues. TPM, transcripts per million. BLCA, bladder urothelial carcinoma; BRCA, breast invasive carcinoma; CESC, cervical squamous cell
carcinoma; CHOL, cholangiocarcinoma; COAD, colon adenocarcinoma; ESCA, esophageal carcinoma; GBM, glioblastoma multiforme; HNSC, head and neck squamous cell carcinoma; KICH, kidney
chromophobe; KIRC, kidney renal clear cell carcinoma; KIRP, kidney renal papillary cell carcinoma; LIHC, liver hepatocellular carcinoma; LUAD, lung adenocarcinoma; LUSC, lung squamous cell
carcinoma; PRAD, prostate adenocarcinoma; READ, rectum adenocarcinoma; STAD, stomach adenocarcinoma; THCA, thyroid carcinoma; UCEC, uterine corpus endometrial carcinoma; SKCM, skin cutaneous
melanoma. b UHRF1 expression in GSE32867 dataset (n = 58). c Survival analysis of lung cancer patients stratified by UHRF1 mRNA expression (n = 376 low, 1035 high). d UHRF1 Protein
expression in Gillett et al. cohort (n = 102). e Survival analysis based on UHRF1 protein expression in Xu et al. cohort (n = 56 low, 9 high). f, g Tumor photos for LG1233 with 1 × 10⁵ (f)
or 1 × 10⁶ (g) cells injected into female C57BL/6 mice. h, i Tumor growth (h) and survival(i) curves for LG1233 cells injected into female C57BL/6 mice. n = 7 per group. j, l Tumor photo (j)
and growth curves (l) for LLC-OVA cells injected into female C57BL/6 mice. n = 7 (shNT), 8 (shUhrf1). k, m Tumor photo (k) and growth curves (m) for LLC-OVA cells injected into male nude
mice. n = 5 per group. Data are mean ± SEM (h, l, m). For box plots, the box limits show the 25th to 75th percentile, the centre line shows the median value and the whiskers show the minimum
to maximum values. n indicates the number of biological replicates. P values were determined using two-sided Wilcoxon signed-rank test (a, b, d), log-rank test (c, e, i), two-way ANOVA test
(h, l, m). Source data are provided as a Source Data file. Data in (h, i, l, m) were repeated independently at least twice with similar results.
To further investigate a possible functional role for UHRF1 in tumor development, we took advantage of CRISPR/Cas9 gene-editing technology to knockout Uhrf1 in LG1233 cells, a murine lung
adenocarcinoma cell line containing K-ras mutation and p53-loss derived from C57BL/6 mice36 (Supplementary Fig. 1a). Following complete UHRF1 depletion, tumor growth was severely
compromised: 1 × 10⁵ LG1233 cells failed to establish tumors in immune-competent C57BL/6 mice; when inoculating 10-fold more tumor cells, UHRF1 inactivation still exhibited a 90% inhibition
rate of tumor growth and longer survival of the animals (Fig. 1f–i). Similar levels of tumor suppression were observed in LG1233 tumors expressing the ovalbumin (OVA) antigen (Supplementary
Fig. 1b, c). Partial loss of UHRF1 was also sufficient to retard tumor growth in vivo, as revealed by CRISPR interference (CRISPRi) technology37,38; moreover, tumor growth could be restored
by reintroducing Uhrf1 expression (Supplementary Fig. 1d, e).
To assess the generalizability of these findings, we genetically silenced Uhrf1 in Lewis lung cancer cells (LLC) expressing the OVA antigen (Supplementary Fig. 1f). As with LG1233 cells,
when transplanting LLC-OVA cells into immune-competent C57BL/6 mice, UHRF1 deficiency significantly slowed tumor growth compared with controls (Fig. 1j, l). Interestingly, UHRF1 inactivation
produced only a mild decrease in tumor cell proliferation in culture (Supplementary Fig. 1g), consistent with previous reports that UHRF1 either promotes39,40,41 or has a negligible impact
on cell proliferation42,43. The growth difference between in vitro and in vivo indicates that the host immune system might be involved in UHRF1 inactivation-induced tumor suppression. In
supporting this notion, we found that UHRF1 deficiency did not impact tumor growth in immune-compromised athymic nude mice (Fig. 1k, m), which lack mature T cells44, demonstrating the
critical role of adaptive immunity in the anti-tumor effect of UHRF1 inactivation. To evaluate the broader role of UHRF1 inactivation in tumor suppression, we also silenced Uhrf1 in mouse
MC38 colon cancer cells and B16 melanoma cells (Supplementary Fig. 1h, j). The absence of UHRF1 markedly inhibited the growth of both colon cancer and melanoma cells in syngeneic mouse hosts
(Supplementary Fig. 1i, k). Taken together, these data demonstrate a general role for UHRF1 in promoting tumor growth across multiple cancer types, which is dependent on the evasion of the
adaptive immune system by the tumor cells.
To investigate UHRF1’s role in immune evasion by tumor cells, we assessed the status of major immune components within the TME. Importantly, flow cytometric analysis revealed increased CD8+
T and NK cells in UHRF1-deficient LLC-OVA tumors (Fig. 2a). We also detected a significant intratumoral enrichment of CD8+ T cells in Uhrf1-knockout (Fig. 2b) or Uhrf1-knockdown
(Supplementary Fig. 2a) LG1233 tumors. These results suggest that CD8+ T cells may be critical for tumor control in both tumor models. To test this possibility, we performed a CD8+ T cell
depletion assay in tumor-bearing immune-competent mice. Indeed, CD8+ T cell ablation completely or partially restored the growth of UHRF1-deficient tumors (Fig. 2c, d, Supplementary Fig. 2b,
c), consistent with the negligible effect of UHRF1 deficiency on tumor growth in athymic nude mice (Fig. 1k, m), pointing to a critical role for CD8+ T cells in restricting UHRF1-deficient
tumor growth.
a, b Flow cytometry analysis of tumor-infiltrating lymphocytes. shNT or shUhrf1 LLC-OVA cells were injected into female C57BL/6 mice, tumors were collected on day 17 for analysis, n = 7
(shNT), 8 (shUhrf1) (a); sgNT or sgUhrf1 LG1233 cells were injected into female C57BL/6 mice, tumors were collected on day 8 for analysis, n = 10 per group (b). c, d Tumor growth curves of
tumor bearing female C57BL/6 mice treated with IgG or anti-CD8 neutralizing antibodies. n = 6 (shNT), 7 (shUhrf1 + IgG, shUhrf1+anti-CD8)(c), n = 7 per group (d). e Flow cytometry assessing
IFNγ+, GzmB+ and Ki67+ CD8+ T cells in shNT or shUhrf1 tumors. n = 5 (shNT), 4 (shUhrf1). f, g Flow cytometry assessing CD69 expression (f) and cytokine production (g) in OT-I T cells
co-cultured with sgNT or sgUhrf1 LG1233-OVA cells. n = 3 per group. h Gene set enrichment analysis (GO molecular function) of upregulated genes in sgUhrf1 tumors compared with sgNT tumors. n
= 3 per group. i Flow cytometry determines the surface level of H2Kb-H2Db in LG1233 sgNT and sgUhrf1 cells. n = 4 per group. j Flow cytometry determines the surface level of HLA-ABC in sgNT
and sgUHRF1 H2170 cells. n = 3 per group. k Flow cytometry measurement of cell surface OVA 257-264 (SIINFEKL) peptide bound to MHC-I complex in LG1233 sgNT and sgUhrf1 cells, with or
without 5 ng/mL IFNγ for 16 h. n = 3 per group. Data are mean ± SEM (a–g, i–k). n indicates the number of biological (a–e, h) or technical (f, g and i–k) replicates. P values were determined
using two-tailed Student’s t test (a, b, e–g, i–k), two-way ANOVA test (c, d) and one sided hypergeometric test then adjusted using multiple-test correction (h). MFI, mean fluorescence
intensity; FDR, false discovery rate. Source data are provided as a Source Data file. All the data except h was repeated independently at least twice with similar results.
To further assess the impact of UHRF1 deficiency in tumor cells on CD8+ T cells, we assessed the cytokine production capacity of tumor-infiltrating CD8+ T cells. More IFNγ- and granzyme B
(GzmB)-producing CD8+ T cells were observed in UHRF1-deficient tumors (Fig. 2e). Moreover, there were more proliferating CD8+ T cells after UHRF1 deprivation (Fig. 2e). Next, we co-cultured
OT-I T cells, which recognize the OVA antigen45, with non-targeting control or UHRF1-deficient LG1233-OVA tumor cells (Supplementary Fig. 2d). Following the co-culture period, OT-I T cells
in the UHRF1-deficient group were more readily activated, as indicated by elevated surface levels of CD69 (Fig. 2f), a well-known T cell activation marker46,47. Meanwhile, the OT-I T cells
in UHRF1-deficient group secreted more effector molecules such as IFNγ, TNFα, and GzmB (Fig. 2g). In line with this, UHRF1-deficient tumor cells were more readily to be killed by OT-I cells
(Supplementary Fig. 2e). Together, these data suggest enhanced T-cell activation in the absent of UHRF1.
To unbiasedly assess the signaling pathways affected by UHRF1, we performed RNA-sequencing on WT and UHRF1-deficient bulk tumor tissues. Interestingly, among the upregulated genes in
UHRF1-deficient tumors, the top-ranked pathways were T cell receptor binding, peptide antigen binding, and MHC-I protein binding (Fig. 2h). Given that impaired tumor antigen processing and
presentation is a principal mechanism by which tumors evade immune recognition and elimination by CD8+ cytotoxic T cells48, we hypothesized that UHRF1 may modulate MHC-I expression,
consequently affecting T cell activation. Indeed, we noticed an increased expression of H2k1 in RNA-seq data (Supplementary Fig. 2f). We further performed flow cytometry to measure the level
of MHC-I molecules on tumor cell surface. The results showed that H2Kb-H2Db and HLA-ABC are significantly increased in UHRF1-deficient mouse and human tumor cells compared with
non-targeting (NT) control cells (Fig. 2i, j, Supplementary Fig. 2g, h). Consequently, when the OVA peptide was loaded onto LG1233 tumor cells, UHRF1-deficient LG1233 tumor cells presented
more OVA peptide on the tumor cell surface (Fig. 2k, Supplementary Fig. 2i). Furthermore, in the presence of IFNγ, which is known to enhance cell surface MHC-I expression in the TME49,
UHRF1-deficient tumor cells exhibited greater levels of OVA antigen presented on cell surface (Fig. 2k). To evaluate the role of UHRF1 on the antigen presentation of endogenous self-antigen,
we expressed full-length OVA protein in LG1233 cells and detected SIINFEKL epitope presentation. As expected, more SIINFEKL epitope was presented on the UHRF1-deficient tumor cell surface
(Supplementary Fig. 2j), indicating enhanced antigen processing and presentation following UHRF1 elimination. These data collectively suggest that UHRF1 may induce immune escape of tumor
cells from recognition by CD8+ T cells, potentially through downregulation of MHC-I. Additionally, we also observed an enhanced type I interferon response, and increased endogenous
retroviruses (ERV) gene expression (Supplementary Fig. 2k), both of which can induce innate immune response50,51.
To systematically identify proteins interacting with MHC-I, which is widely presented on all nucleated cells52, we transfected HEK293T cells with Flag-HLAA, followed by affinity purification
of HLAA-containing protein complexes using anti-Flag antibody and subsequent mass spectrometry analysis. Interestingly, UHRF1 was among the top interacting proteins (Fig. 3a). To confirm
this finding, we co-transfected Flag-Uhrf1 and HA-H2k1 plasmids into HEK293T cells. Co-immunoprecipitation (Co-IP) assays revealed that UHRF1 interacts with H2K1 (Fig. 3b). In addition to
its role as an epigenetic regulator, UHRF1 is also recognized as an E3 ligase capable of ubiquitinating and degrading nuclear substrates, with several reports substantiating this biochemical
function42,53,54,55. Given that proteolytic degradation is a well-known mechanism for restraining MHC-I expression56,57,58, we reasoned that UHRF1 may bind to and ubiquitinate MHC-I,
leading to its subsequent degradation. To test this postulation, we expressed HA-H2k1 in both UHRF1-sufficient and -deficient tumor cells. Subsequent Co-IP assays revealed that
ubiquitination levels of H2K1 were significantly reduced in UHRF1-deficient cells (Fig. 3c), suggesting that UHRF1 possesses the biochemical capability to facilitate MHC-I ubiquitination and
degradation.
a Affinity purification of Flag-HLAA using antibody against Flag-tag. The top hits from mass spectrometry analysis were shown. b Interaction of mouse UHRF1 and H2K1 was determined by
Co-immunoprecipitation (Co-IP). HEK293T cells were transfected with Flag-Uhrf1 in combination with HA-H2k1. c Wild-type and Uhrf1-knockdown LLC-OVA cells were transfected with HA-H2k1.
Ubiquitination of H2K1 was examined by Co-IP. d Representative images of UHRF1 expression by IHC staining from LUSC and LUAD patient samples and corresponding adjacent normal tissues. UHRF1
monoclonal antibody (H-8) from Santa Cruz (Cat# sc-373750) was used for the IHC staining. Scale bars, 25 µm. e Quantification of the cytoplasmic UHRF1 positive cells by Qupath from LUSC (n =
90) and LUAD (n = 86) patients with corresponding adjacent normal tissues. f Representative confocal images showing UHRF1 localization in cultured LG1233 cells (upper panel), LG1233 tumor
tissues developed in C57BL/6 mice (middle panel) and normal spleen tissues (lower panel). Nuclei were stained with DAPI. Scale bars, 10 µm. n indicates the number of biological replicates.
Data are mean ± SEM (e). P values were determined using two-tailed Student’s t test (e). Data in (b, c, f) were repeated independently at least twice with similar results. Source data are
provided as a Source Data file.
However, UHRF1 has been defined to function primarily in the nucleus, and the known substrates of its E3 ligase are nuclear proteins42,53,54,55. To address this intriguing question, we
closely examined the expression pattern of UHRF1 protein in tumor tissue sections derived from NSCLC patients. We were surprised to find that 70% of tumor samples exhibit cytoplasmic UHRF1
staining in cancer cells in contrast to normal cells in the adjacent regions (Fig. 3d, e). To validate this highly unusual observation, we stained tissue samples from another lung cancer
cohort using an independent UHRF1 antibody from a different vendor. Consistently, we observed more than 70% of patient samples from this cohort with cytoplasmic UHRF1 localization
(Supplementary Fig. 3a, b). These results indicate that tumor cells not only highly express UHRF1 but also exhibit aberrant cytoplasmic localization detected in tissue samples derived from
NSCLC patients. To probe this question further, we conducted immunofluorescence analysis in cultured LG1233 cells and found that UHRF1 was primarily located in the nucleus of the tumor
cells; in contrast, UHRF1 was detected predominantly in the cytoplasm of LG1233 tumor tissues isolated from mice (Fig. 3f), consistent with IHC results from human cancer samples. Meanwhile,
UHRF1 was consistently found in the nuclei of normal cells in mouse tissues (Fig. 3f). These observations suggest that cytoplasmic localization of UHRF1 occurs only in tumor cells grown in
the TME, where UHRF1 could interact with MHC-I and cause its degradation.
Previous studies found that phosphorylation of UHRF1 could be linked to its sequestration in the cytoplasm59,60. To test whether the TME-induced cytoplasmic translocation of UHRF1 is
regulated by phosphorylation, we generated an antibody specifically recognizing phosphorylated UHRF1 on a specific serine residue (Ser661 in human and Ser656 in mouse; hereafter termed
pUHRF1), based on findings from a zebrafish study60. We confirmed the specificity of this pUHRF1 antibody using HEK293T cells overexpressing Flag-tagged wild-type (WT) UHRF1 or Flag-tagged
S661A mutant UHRF1, which is non-phosphorylable at this residue60. Western blot analysis showed that, whereas anti-UHRF1 antibody recognized both WT UHRF1 and the S661A mutant, the
anti-pUHRF1 antibody exclusively recognized WT UHRF1 (Supplementary Fig. 4a). Immunofluorescent imaging analysis with the anti-pUHRF1 antibody further revealed a robust signal in the
cytoplasm of tumor samples, in contrast with weak staining in normal lung tissues (Fig. 4a). Consistently, when we overexpressed Flag-UHRF1 (S661A, resistant to phosphorylation) and
Flag-UHRF1 (S661D, mimicking phosphorylation) into A549 human lung cancer cells, significantly higher cytoplasmic Flag signal was detected in Flag-UHRF1 (S661D) overexpressing cells, while
Flag-UHRF1 (S661A) was mainly located in the nuclei (Supplementary Fig. 4b). These findings are consistent with previous reports showing that UHRF1 phosphorylated at Ser661 (mouse Ser656) is
enriched in the cytoplasm59,60. Since we found that UHRF1 physically interacts with the MHC-I molecule (Fig. 3a, b), we next tested whether this interaction is regulated by UHRF1
phosphorylation. To investigate this, we co-transfected HA-HLAA with either wild-type, S661A, or S661D Flag-UHRF1 and performed Co-IP analysis. This revealed that the phosphomimic S661D
mutation significantly enhances the interaction between UHRF1 and MHC-I (Fig. 4b). Furthermore, immunofluorescence staining showed the co-localization of phosphorylated UHRF1 and MHC-I (Fig.
4c). Moreover, MHC-I levels on the surface of Flag-UHRF1 (S661D) overexpressing cells are reduced as compared with Flag-UHRF1 (S661A) overexpressing cells (Fig. 4d). These data suggest that
UHRF1 phosphorylation promotes its interaction with MHC-I to facilitate MHC-I degradation. Functionally, we found that overexpression of Uhrf1 (S656D) in mouse LG1233 tumor cells notably
enhanced tumor growth in immune-competent host, compared with the phosphorylation-resistant form Uhrf1 (S656A) (Fig. 4e, Supplementary Fig 4c), likely through more effective suppression of
MHC-I expression on cell surface. To evaluate the expression profile of pUHRF1 in human lung cancer, we stained patient samples with the antibody against pUHRF1 (S661). The expression
pattern of pUHRF1 (S661) was similar among patients with stage I, II and III lung cancer and colon cancer, suggesting that the pUHRF1-mediated immune evasion may be involved in both early
tumor development and
advanced progression (Supplementary Fig. 4f). We next explored the relationship between pUHRF1 and MHC-I in patient samples. A negative correlation between pUHRF1 and HLA-ABC expression was
observed in both lung cancer and colon cancer patient samples (Fig. 4f, g, Supplementary Fig. 4d, e). Together, these results indicate that phosphorylated UHRF1 localized in the cytoplasm of
tumor cells within the TME suppresses MHC-I to impair antigen presentation and curtail anti-tumor immunity.
a Representative confocal images showing pUHRF1 (green) in LG1233 tumor tissues and normal lung tissues. Scale bars, 25 µm. b The UHRF1-HLAA interaction was examined by Co-IP. HEK293T cells
were co-transfected with HA-HLAA and Flag-UHRF1 (wild-type, S661A or S661D). c Localization of HLA-ABC with pUHRF1. Dashed box regions were magnified. Scale bar, 25 µm. d Surface level of
HLA-ABC in A549 cells with overexpressed Flag-UHRF1 (S661A) or Flag-UHRF1 (S661D), n = 5 per group. e LG1233 cells with S656A or S656D Uhrf1 expression were subcutaneously injected into male
C57BL/6 mice. Tumor volume was monitored. Uhrf1 (S656A), n = 7; Uhrf1 (S656D), n = 8. f Representative IHC images of pUHRF1 and HLA-ABC staining, showing low pUHRF1 with high HLA-ABC
(patient 1) and high pUHRF1 with low HLA-ABC (patient 2). Scale bars, 50 µm. g Pearson correlation of pUHRF1 expression with HLA-ABC level in lung cancer samples (n = 90). h Representative
confocal images showing LG1233 cells treated with or without 200 ng/mL TGF-β1 for 72 h, stained for UHRF1 (green) and DAPI (blue). Scale bars, 25 µm. i Representative confocal images showing
pUHRF1 (red) localization in sgNT and sgTgfbr2 LG1233 tumor tissues. Scale bars, 25 µm. j Tumor growth curves of sgNT or sgTgfbr2 LG1233 cells injected into male C57BL/6 mice. n = 6 per
group. Data are mean ± SD (d) and mean ± SEM (e, j). n indicates the number of biological (e, j) or technical (d) replicates. For (g), n = 18 of biological samples, five technical replicates
in per biological sample were included. P values were determined using two-tailed Student’s t test (d) and two-way ANOVA test (e, j), the correlation coefficient (r) and P value in (g) were
determined using two-tailed Pearson correlation analysis. Data in (a–d, h, i) were repeated independently twice with similar results. MFI, mean fluorescence intensity. Source data are
provided as a Source Data file.
The observation that UHRF1 cytoplasmic translocation happens only when tumor cells are grown in vivo strongly indicate that factors in the TME are responsible to stimulate its
phosphorylation and translocation. In this regard, a previous report indicated that UHRF1 is sequestered outside the nucleus upon TGF-β stimulation during Treg differentiation59. Given the
significant role of TGF-β in the TME across various solid tumor types61,62, we postulated that TGF-β may facilitate UHRF1’s nuclear-to-cytoplasmic translocation. To evaluate this, we treated
LG1233 cells with recombinant mouse TGF-β protein for 72 h, and found a subset of tumor cells to display UHRF1 localization in the cytoplasm (Fig. 4h), which was accompanied by an increased
UHRF1 phosphorylation (Supplementary Fig. 4g). To further confirm TGF-β’s role in regulating UHRF1 cytoplasmic translocation, we employed the CRISPR-Cas9 technology to delete Tgfbr2 in
LG1233 cells (Supplementary Fig. 4h)63. Upon subcutaneous injection into mice, the loss of TGF-β signaling in tumor cells markedly reduced the amount of phosphorylated UHRF1 in the cytoplasm
(Fig. 4i). Furthermore, Tgfbr2-KO in LG1233 tumor cells notably inhibited tumor growth in syngeneic mice compared with NT control cells (Fig. 4j). Collectively, these results suggest that
TGF-β present in the TME could be one of the factors to induce cytoplasmic translocation of UHRF1, likely by initiating its phosphorylation. The phosphorylated UHRF1 then interacts with and
facilitates the degradation of MHC-I, thereby promoting immune evasion and tumor growth. It is possible that other factors present within the TME could also contribute to the aberrant UHRF1
localization, either individually or in concert with TGF-β.
In our earlier study of the LG1233-OVA tumor model, UHRF1 deprivation eradicated a majority of tumors, while 100% mice died of NT control tumor progression (Supplementary Fig. 1b, c).
Importantly, when these tumor-free mice were rechallenged with parental LG1233-OVA cells, 40% of them remained free of tumor initiation; in contrast, all naive mice died of tumor progression
(Fig. 5a, b). This suggests that UHRF1 deprivation alone elicits a robust anti-tumor memory response, likely attributable to T cells with low-affinity TCRs22,23. To determine whether those
T cells were induced by UHRF1 deprivation, we analyzed TCR affinity against OVA alternative peptide ligands64, using the affinity index that we generated recently (Supplementary Fig. 5a)23.
In Uhrf1-KO tumors, while the number of high-affinity OVA antigen-specific T cell clonotypes remained unchanged, we observed a significant increase in low-affinity OVA antigen-specific T
cell clonotypes (Fig. 5c). To probe this further at the mechanistic level, we employed an approach to block the cytoplasmic translocation of UHRF1 by treatment of tumor-bearing mice with
anti-TGF-β antibody. To start, OT-I T cells were primed with SIINFEKL (N4) or its weak avidity antigen variant peptide SIIQFEKL (Q4) from ovalbumin (OVA); their effector populations were
then transferred into LG1233-OVA(N4) or (Q4) tumor-bearing mice presenting the corresponding peptide (Fig. 5d). Interestingly, high-affinity T cell-mediated therapy effectively slowed down
tumor growth irrespective of anti-TGF-β treatment (Fig. 5e); however, treatment with anti-TGF-β antibody significantly increased the anti-tumor efficacy of low affinity T cells (Fig. 5f).
Since inactivation of UHRF1 leads to increased expression of MHC-I on tumor cell surface, these data suggest that levels of MHC-I may determine the engagement of different spectrum of T
cells with varying levels of TCR affinities, resulting with the expansion of low-affinity T cell pool critical for the formation of memory T cells in the presence of high levels of MHC-I.
a, b Survivor mice that rejected Uhrf1-knockout tumors were rechallenged parental LG1233-OVA cells. Tumor growth (a) and survival (b) curves were plotted. n = 5 each group. c Frequency of
high- and low-affinity TCR clonotypes in tumors from mice injected with sgNT or sgUhrf1 LG1233-OVA cells. n = 5 per group. d Schematic representation of T cell therapy. e, f Tumor growth
curves of LG1233-OVA (N4) (e) or LG1233-OVA (Q4) (f) cells injected into male C57BL/6 mice. n = 5 per group. g, h Tumor growth (g) and survival (h) curves of female mice with shNT or shUhrf1
tumors treated with anti-CTLA4 on days 7, 10 and 14. n = 6 per group (g). n = 10 (shNT+IgG), 8 (shNT+anti-CTLA4), 6 (shUhrf1 + IgG), 8 (shUhrf1+anti-CTLA4) (h). g, h were performed
independently. i Rechallenge of survivor mice from (h) with parental LLC-OVA cells. n = 5 (control), 4 (survivor). j–n TCRβ sequencing for LLC-OVA tumors. TCR similarity (j–m) and expanded
TCR clones, constituting >10%, >5%, >2%, >1%, and >0.5% are shown as gradient segments (n). n = 6 (shNT+IgG, shNT+anti-CTLA4 and shUhrf1 + IgG), 5 (shUhrf1+anti-CTLA4). Data are mean ± SEM
(a, c, e–g, i). Box plots (j–m), the horizontal lines indicate the first, second (median) and third quartiles; the whiskers extend to ±1.5× the interquartile range. n indicates the number of
biological replicates. P values were determined using two-way ANOVA test (a, e–g, i), log-rank test (b, h), two-tailed Student’s t test (c, j–m) and Chi-square test (n). AA, amino acid.
Source data are provided as a Source Data file.
Because tumor-intrinsic UHRF1 downregulates MHC-I to establish an immune cold TME, which is associated with resistance to ICB treatment6, we next investigated whether UHRF1 inactivation may
synergize with ICB therapy. Although genetic inactivation of UHRF1 did not enhance the anti-tumor efficacy of PD-1 blockade (Supplementary Fig. 5b), it did synergize with anti-CTLA4
treatment to significantly prolong the survival of tumor-bearing mice (Fig. 5g), so that 50% of mice in the combinational therapy group maintained long-term tumor control (Fig. 5h).
Consistent with results on the LG1233-OVA tumor model shown earlier, all tumor-free survivors were resistant to rechallenge with parental tumor cells (Fig. 5i, Supplementary Fig. 5c),
suggesting that a robust anti-tumor immune memory response was induced by the combined UHRF1 inactivation and anti-CTLA4 treatment.
To further elucidate the mechanistic nature of this combinational strategy, we characterized the intratumoral TCR repertoire, which can be shaped by ICB-based therapy65. Bulk tumor
TCRβ-sequencing revealed that anti-CTLA4 monotherapy only mildly alters the TCR repertoire in NT LLC-OVA tumors (Fig. 5j), while significantly diminishing TCR similarity in Uhrf1-deficient
tumors (Fig. 5k). Notably, UHRF1 inactivation alone results in a robust reduction in TCR similarity (Fig. 5l), which was even more pronounced when combined with anti-CTLA4 (Fig. 5m).
Although the diversity of the entire intratumoral TCR pool was largely unaffected (Supplementary Fig. 5d–g), the size distribution of the TCR repertoire underwent significant changes.
Specifically, while the top 10 most expanded T cell clonotypes comprised 16% of the entire repertoire in the control TME, in the Uhrf1-deficient TME with anti-CTLA treatment, this population
increased to 25% of the entire repertoire (Fig. 5n). This suggests that the combinational therapy selectively expanded oligoclonal T cell populations within the TME. Collectively, these
findings indicate that UHRF1 deficiency reshapes the intratumoral TCR repertoire landscape of tumor-infiltrating T cells and enhances the formation of memory T cells when combined with
anti-CTLA4 treatment.
UHRF1, also known as Inverted CCAAT box Binding Protein of 90 kDa (ICBP90) in humans or nuclear protein of 95 kDa (Np95) in mice, has been extensively studied as a nuclear protein regulating
DNA methylation and histone modifications26. By maintaining genomic integrity, UHRF1 actively participates in various physiological processes including spermatogenesis66, embryonic
development67, interdigital tissue regression68,and tissue repair and regeneration39,69. Under pathogenic conditions, compelling evidence suggests a strong link between UHRF1 overactivity
and tumorigenesis in multiple cancers35,70,71,72.Although extensively studied in malignancy, UHRF1 has been mainly defined as an epigenetic regulator to repress target genes, such as the
tumor suppressors RASSF1, CYGB and CDH13 in human lung adenocarcinoma cells73. In rare instances, UHRF1 has been detected in the cytoplasm, during Treg cell differentiation59 and zebrafish
development60. In this study, we unexpectedly found that UHRF1 exhibits aberrant cytoplasmic localization in tumor cells grown in vivo, as detected in both human patient samples and mouse
tumor xenograft models, indicating that it acquired chromatin-independent activities conferring growth advantage for tumor cells within the TME, primarily through conferring an immune cold
feature via down-regulation of MHC-I. In the meantime, we do not discount its classic role as an epigenetic regulator in this context since UHRF1’s PHD and SRA domains are important for
maintaining DNA methylation levels27, which has been demonstrated to affect tumor development. Structurally, it has been shown that an intramolecular interaction of UHRF1 is important for
its histone association: the complex formation between the N-terminal tandem Tudor domain (TTD) and the C-terminal polybasic region (PBR) blocks UHRF1 binding to H3K9me374. Since the
mutation at human S661 (mouse S656) is located in the PBR domain, it is possible that the S661 mutant may disrupt UHRF1’s ability to bind to histone, which needs further exploration.
In searching for factors in the TME that could induce the cytoplasmic translocation of UHRF1 via phosphorylation, we found that TGF-β, a known immune regulator75, acts as one of such
factors. It is possible that other factors in the TME could trigger the phosphorylation event, which is on a serine residue within a consensus sequence for CDK kinases, leading to the
cytoplasmic translocation of this nuclear protein for the benefit of evading immune surveillance by tumor cells in the TME. The regulation of MHC-I, crucial for tumor immunity, has become a
focal point of research in recent years56,57,58,76,77. Our findings indicate that cytoplasmic UHRF1 is involved in promoting the degradation of MHC-I molecules through ubiquitination at the
post-translational level, which is consistent with its known function as an E3 ligase42,54,78. Considering the critical role of MHC-I and CD8+ T cells in the anti-cancer immunity
process79,80, these data suggest an additional role for UHRF1 in tumor immune surveillance, a notion supported by a recent study in which UHRF1 was identified as one of the top negative
regulators of MHC-I through a targeted peptide-MHC I-guided CRISPR screen56.
Given that nuclear UHRF1 plays a pivotal role in normal cell physiology39, cytoplasmic phosphorylated UHRF1 might provide a rational target for cancer therapeutic drug development in the
future to avoid systemic adverse effects. Here, we demonstrated the feasibility of this approach with genetic UHRF1 inactivation. Targeting UHRF1 combined with anti-CTLA4 ICB therapy
significantly slows tumor growth and extends the survival of tumor-bearing mice. Moreover, this combinational therapy induces a strong anti-tumor memory response with long-term control over
malignancy. Beyond switching an immune cold TME into a T cell-inflamed one, our TCRβ-seq data show that UHRF1 deficiency in combination with anti-CTLA4 therapy expands intratumoral
oligoclonal T cell populations, indicating there are very limited numbers of tumor antigens. From this perspective, comparing with the negated additive effect of anti-PD-1 ICB, facilitating
the antigen priming by CTLA4 blockade may represent a more effective way to enhance anti-tumor immune response. Known ICB resistance mechanisms include a lack of antigenic mutations, loss of
tumor antigen expression, loss of HLA expression, alterations in antigen processing machinery, and constitutive PD-L1 expression4. In this regard, high levels of tumor-cell intrinsic UHRF1
may be used as a biomarker to predict ICB insensitivity, with targeting UHRF1 as a potential strategy to combat resistance to ICB therapy.
Based on our findings, UHRF1 inhibition could enhance anti-tumor immunity by increasing MHC-I presentation. In T cells, TGF-β signaling also induces UHRF1 phosphorylation and sequesters
UHRF1 in the cytoplasm; as a result, DNA methylation of Foxp3 locus is decreased and induced regulatory T cells (iTreg) are generated59. From this perspective, blocking UHRF1 cytoplasmic
localization or its upstream TGF-β signaling may also suppress iTreg cells development, which could alleviate immune suppression. Currently, UHRF1 inhibitors targeting DNA methylation (e.g.,
NSC232003)81 are not yet clinically used. Since nuclear UHRF1 is very important for normal cell activities, it is not a suitable strategy to use inhibitors that can affect functions of
nuclear UHRF1. Based on our results, targeting cytoplasmic UHRF1 in the future may offer a more specific and safer approach to combat cancer. In order to achieve a tumor specific UHRF1
inhibition, strategies may be considered to include 1) targeting TGF-β signaling to alter UHRF1 localization, as revealed by our study and others’ work59; 2) preventing UHRF1 phosphorylation
through CDK2 or CDK9 inhibition42,59,60,82; 3) potentially developing peptide-based inhibitors to disrupt UHRF1-MHC-I interactions.
High-affinity antigen-directed treatments, including CAR-T and TCR-T cell therapies, have had some success against both liquid and solid tumors83,84. However, these therapeutics can have
considerable side effects, including cytokine release syndrome85. Low-affinity T cells are more readily to form memory in the contexts of infection and cancer22,23, and induced by UHRF1
inactivation in tumor cells to elicit anti-tumor immunity. In the context of T cell-based therapies, targeting low-affinity antigens by evoking endogenous T cells has stimulated interest in
TAAs as therapeutic targets86. From a translational point of view, evoking endogenous T cells by targeting UHRF1 would be highly desirable since depletion of tumor-intrinsic UHRF1 increases
MHC-I expression and converts the tumor microenvironment from an immune cold into an immune hot state (Supplementary Fig. 6), representing a promising approach to improve the efficacy of
immunotherapy.
All the animal experiments were approved by the Duke University Institutional Animal Care and Use Committee. Foxn1-null nude (athymic nude) mice (Strain: 007850) and C57BL/6 mice (Strain:
000664) were purchased from Jackson Laboratory. Thy1.1 + OT-I TCR transgenic mice were bred in house. Mice were housed under conditions at 22 °C, with a humidity between 30 and 70%, and a
light cycle of 12h-12h on-off set.
A549, H2170, B16 and HEK293T cell lines were acquired from Duke University Cell Culture Facility, with original sourcing from ATCC. LLC-OVA cells were generated as previously described87.
LG1233 cells were provided by T.Jacks (Massachusetts Institute of Technology). MC38 cells were purchased from Kerafast. Mycoplasma contamination was tested by Universal Mycoplasma Detection
Kit (ATCC, 30-1012 K). A549, B16, MC38, HEK293T, LLC-OVA and LG1233 cells were cultured in Dulbecco’s modified Eagle’s medium (DMEM) supplemented with 10% fetal bovine serum and 100 U/mL
penicillin-streptomycin. H2170 cells were cultured in RPMI-1640 medium supplemented with 10% fetal bovine serum and 100 U/mL penicillin-streptomycin. All cells were cultured at 37 °C in a
humidified atmosphere with 5% CO2.
HEK293T cells with approximately 70% confluency were transfected with vectors together with lentiviral packaging vectors PAX2 and VSV-G using Lipofectamine 2000 (Thermo Fisher Scientific,
11668019). Viral particles were collected and filtered after transfection for 48 h. For infection, lentiviral supernatant was added to cultured cells with 8 µg/mL Polybrene (Sigma-Aldrich,
TR-1003). After incubation for 24 h, infected cells were selected for 3 to 5 days with 2 µg/mL puromycin (Thermo Fisher Scientific, A1113803). To generate Uhrf1 knockdown cell line, shRNA
targeting Uhrf1 was purchased from Sigma-Aldrich. (Mouse-shUhrf1, 5’- CTGTAGCTCCAGTGCCGTTAA-3’). To generate knockout cell lines, sgRNAs were designed based on webtool
(https://chopchop.cbu.uib.no/)88 and cloned according to Dr. Feng Zhang laboratory’s protocol89,90. The sequences of sgRNAs used in this study are:
To generate stable LG1233 cell line with OVA expression, wild-type OVA (N4) and its Q4 mutant were cloned into pWPT (Addgene, #12255), LG1233-OVA(N4)-T2A-GFP cells and
LG1233-OVA(Q4)-T2A-Scarlet cells were sorted by FACS for 2 rounds with purity more than 95%.
In the mouse tumor experiments, 2 × 10⁵ LLC-OVA; 1 × 10⁵, 2 × 10⁵ or 1 × 10⁶ LG1233 (-OVA); 1 × 10⁶ MC38 and 2 × 10⁵ B16 cells were subcutaneously injected into C57BL/6 mice (6 to 8 weeks
old). 2 × 10⁵ LLC-OVA cells were subcutaneously injected into athymic nude mice (6 to 8 weeks old). The specific gender of the mice, along with the number of cells injected for each
experiment, are detailed in the corresponding figure legends. Both male and female mice were used in animal studies. Tumor volumes were calculated using the following formula: 0.52 × a × b2,
where a is the larger diameter and b is the smaller diameter of the tumor mass. The permitted maximal tumor size was 2000 mm3 by Duke University Institutional Animal Use and Care Committee.
Mice were euthanized once tumor size reached 2000 mm3. In some instances, malignant tumors exhibited explosive growth, potentially exceeding 2000 mm3. Mice with oversized tumors were
euthanized with CO2 immediately upon discovery.
Depletion of lymphocytes in C57BL/6 mice was conducted by injection of neutralizing antibodies. In brief, mice were given intraperitoneal injection of antibodies against CD8 (100 µg, twice a
week, Bio X Cell, BE0223) or recommended isotype control (Bio X Cell, BE0088). All deletion assays were initiated one day before tumor cell inoculation. Specific cell deletion was confirmed
by flow cytometry at experimental endpoints. For ICB therapy treatments, tumor-bearing mice were intraperitoneally injected with 200 µg anti-mouse PD-1 antibodies (Bio X Cell, BE0033-2) or
IgG isotype control (Bio X Cell, BE0290); and 30 µg anti-mouse CTLA-4 antibodies (Bio X Cell, BP0164) or IgG isotype control (Bio X Cell, BP0086) on the indicated days.
The coding sequences for mouse Uhrf1 and human UHRF1 were purchased from Horizon. Mutant variants of human UHRF1 (S661A, S661D) were generated by PCR. The coding sequence for HLAA was cloned
from Addgene plasmid (#85162)91. The coding sequence for H2k1 was cloned from cDNA of mouse embryonic fibroblast (MEF) cells. These coding sequences were subsequently cloned into
pSIN-lentiviral vectors using the Gibson Assembly (New England Biolabs). Details of the primers used are listed in Supplementary Table 1.
For the adoptive transfer of OT-I T cells, lymph nodes and spleens from OT-I TCR transgenic mice were mechanically dissociated. Red blood cells were lysed using ACK lysing buffer (Quality
Biological). After isolation, OT-I T cells were activated in vitro for 48 h with 1 µg/mL OVA N4 or Q4 peptide, then cultured with 50 U/mL hIL-2 (Peprotech, 200-02). 2 × 10⁵ LG1233-OVA (N4 or
Q4) tumor cells were subcutaneously injected into male C57BL/6 mice. On day 2, each tumor-bearing mouse received 2 mg cyclophosphamide (Sigma-Aldrich, C7397) for lymphodepletion before T
cell transfer. On day 4, mice were intravenously injected with 1 × 10⁶ OT-I T cells per mouse. 10 days after inoculation, mice were treated with isotype control antibody (10 mg/kg, Bio X
cell, BE0083) or anti-TGF-β (10 mg/kg, Bio X Cell, BE0057) as previously described92. Briefly, antibodies were administered 3 times a week for 3 weeks. The first dose was delivered
intravenously, and subsequent doses were given intraperitoneally.
Total protein was extracted and lysed in RIPA buffer (Thermo Fisher Scientific) with 1% protease and phosphatase inhibitor cocktail (Thermo Fisher Scientific), and protein concentrations
were determined using the BCA protein assay kit (Thermo Fisher Scientific). Equal amounts of protein in the lysates were boiled in SDS loading buffer. Protein samples were loaded and
fractionated on a 4–12% SDS-PAGE gel and then transferred to a polyvinylidene difluoride membrane, which was subsequently blocked in 5% skim milk in Tris-buffered saline with 0.1% Tween-20
(TBST buffer). Primary antibodies against total proteins or phosphorylated forms of protein were applied, followed by secondary antibodies (Thermo Fisher Scientific) incubation and
visualized using an enhanced chemiluminescent horseradish peroxidase substrate (Thermo Fisher Scientific). A protein ladder (Thermo Fisher Scientific) was used to determine molecular mass in
the western blot analysis. The western blot primary antibodies, their source and dilution information as follows. Anti-UHRF1(Santa Cruz Biotechnology, sc-373750, 1:1000); Anti-Flag (Sigma,
F1804, 1:5000); Anti-HA (Sigma, H3663, 1:2000); Anti-TGFBR2 (Santa Cruz Biotechnology, sc-17791, 1:500), Anti-β-Actin (Proteintech, 66009-1-Ig, 1: 5000), anti-Ubiquitin (Cell Signaling
Technology, 43124, 1:1000), GAPDH (Santa Cruz Biotechnology, sc-365062, 1:5000). The polyclonal antibody recognizing human phosphorylated Ser-661(mouse Ser-656) in UHRF1 was generated by
LifeTein, LLC, as previously reported60. The antigen used was a synthetic phosphoserine peptide corresponding to residues 654-659 of human UHRF1, denoted as CGPSRAG(pS)PRRTSKKT-KLH.
Cells were transfected with the indicated constructs for 24 h, washed briefly, and then lysed on ice using lysis buffer (Cell Signaling Technology, 9806) for 1 h. Lysates containing 1 mg of
total protein were precleared with magnetic Protein G Dynabeads (Thermo Fisher, 10003D) and incubated overnight at 4 °C with either 2 μg of the indicated antibodies or with an isotype
control. The immunoprecipitates were collected with magnets, and the pellets were washed with lysis buffer and stored in 2× sample buffer prior to western blot analysis. Mass spectrometry
analysis was conducted at the Proteomics and Metabolomics Core Facility at Duke University. IP samples were analyzed by LC-MS using an Orbitrap Fusion Lumos mass spectrometer. Database
searches were performed against the SwissProt Homo sapiens database. A total of 2 samples were analyzed, including one IgG control and one Flag-HLAA pull down sample.
For in vitro experiments, cultured cancer cells were resuspended and stained with APC anti-mouse H-2Kb/H-2Db (28-8-6) (Biolegend, 114614, 1:100), FITC anti-human HLA-ABC (W6/32) (Biolegend,
311404, 1:100) and APC anti-mouse H-2Kb bound to SIINFEKL (25-D1.16) (Biolegend, 141605, 1:100) at 4 °C for 30 min in the dark. After washing with PBS, the surface expression of MHC-I or the
MHC-I bound endogenous OVA peptide was analyzed on an BD FACS Canto flow cytometer using BD FACS DIVA SOFTWARE (Duke University Flow Cytometry Shared Facility), and data were analyzed using
FlowJo. To analyze tumor-infiltrating lymphocytes, murine tumor tissues were mechanically dissociated and digested with 1 mg/mL collegenase type I (GIBCO, 17100-017) by incubating at 37 °C
for 60 min. The cells were filtered with a 70 µm cell strainer. Red blood cells were removed with ACK lysis buffer. Single cell suspensions were stained with NearIR-LIVE/DEAD fixable dead
cell dye (Invitrogen, 1:2000), followed by incubation with the following cell surface antibodies for 30 min at 4 °C in the dark. After washing with PBS, cells were then subjected to flow
cytometry analysis as described above. The following antibodies were used to identify immune cell populations in TME: FITC anti-mouse CD45 (30-F11) (Biolegend, 103108, 1:100), PE anti-mouse
TCR vβ8.3 (1B3.3) (BioLegend, 156304, 1:100), PE/Cyanine7 anti-mouse CD4 (RM4-5) (Biolegend, 100528, 1:100), PerCP/Cyanine5.5 anti-mouse CD8β (YTS156.7.7) (Biolegend, 126610, 1:100), APC
anti-mouse NK-1.1 (PK136) (Biolegend, 108710, 1:100), PE/Cyanine7 anti-mouse CD69 (H1.2F3) (BioLegend, Cat. 104511, 1:100). For intracellular staining, the Intracellular Fixation &
Permeabilization Buffer Set (eBioscience™, 88-8824-00) was used to fix and permeabilize cells, followed by staining with Pacific Blue anti-mouse IFN-γ (XMG1.2) (Biolegend, 505818, 1:100),
PE/Cyanine7 anti-human/mouse Granzyme B (QA16A02) (Biolegend, 372214, 1:100), APC anti-mouse TNFα (MP6-XT22) (BioLegend, 506308, 1:100), Pacific Blue anti-mouse Ki-67 (16A8) (BioLegend,
652421, 1:100). Flow cytometry gating strategies are shown in Supplementary Fig. 7.
For immunofluorescence analysis, frozen tumor samples were sectioned into 8 µm slices. Cultured cells were seeded on a sterile glass coverslip and maintained in complete medium. LG1233 cells
were treated with or without 200 ng/mL recombinant mouse TGF-β1 protein (R&D, 7666-MB-005/CF) for 72 h prior to IF staining. Briefly, tumor tissues or culture cells were fixed with 4%
paraformaldehyde (PFA) for 15 min at room temperature. After fixation, samples were permeabilized using 0.1% Triton X-100 in PBS for 10 min and then blocked with 5% BSA for 1 h at room
temperature. The cells or tissue sections were incubated with the primary antibodies against UHRF1 (Santa Cruz Biotechnology, sc-373750, 1:200), pUHRF1 (LifeTein, customized, 1:200),
anti-HLA-ABC (Proteintech, Cat. 15240-1-AP, 1:200) and Flag (Sigma, F1804, 1:200) at 4 °C overnight. Subsequently, samples were incubated with fluorescently-labeled secondary antibodies for
1 h at room temperature. Tissues or cells were counterstained with DAPI. Finally, slides were mounted using ProLong Diamond antifade mountant (ThermoFisher, P36965) and images were captured
with a Leica SP5 inverted confocal microscope.
Lung cancer tissue arrays in Fig. 3 were obtained from Shanghai Outdo Biotechnology Company Ltd. Lung cancer tissue arrays in Fig. 4 and colon cancer tissue arrays in Supplementary Fig 4
were purchased from TissueArray.com. Lung cancer tissue sections in Supplementary Fig 3 were obtained from West China Hospital, Chengdu, China, which was approved by the ethics committees of
West China Hospital, Chengdu, China. Briefly, slides were heated until tissue transparency was achieved, followed by sequential xylene and ethanol washes, and a rinse in water. Antigen
retrieval was performed using Rodent Decloaker buffer (Bio Care Medical) in a pressure cooker set to 95 °C for 20 min. Next, 3% hydrogen peroxide solution (VWR, BDH7690-1) was used to block
endogenous peroxidases and subsequently washed with 0.1% TBS-T (Tween-20) wash buffer. Slides were then blocked with 5% BSA for 1 h at room temperature. Primary anti-UHRF1 (Santa Cruz
Biotechnology, sc-373750, 1:100), anti-UHRF1 (Abnova, H00029128-M01, 1:100), anti-pUHRF1 (LifeTein, LLC, customized, 1:100) and anti-HLA-ABC (Proteintech, 15240-1-AP, 1:1000) antibodies were
diluted accordingly in the blocking buffer and incubated overnight at 4 °C. Next day, secondary antibodies were used to incubate at room temperature for 1 h. After wash 4 times with TBST
buffer, DAB chromogen (DAKO, K3468) was added to slides and monitoring for brown color development. After the desired staining intensity was achieved, slides were rinsed with distilled
water. Hematoxylin was applied and slides were then treated with a bluing reagent, dehydrated, and mounted using Cytoseal (Thermo Scientific, 8312-4). The images were captured by using Zeiss
Axio Imager Z2. QuPath was used for quantification, images were analyzed using the H-DAB staining option, with cytoplasmic DAB thresholds set at >0.3. A minimum of 100 cells per slide were
analyzed.
CD8+ T cells were isolated from lymph nodes of OT-I mice. OT-I T cells were co-cultured with sgNT or sgUhrf1 LG1233-OVA cells at a ratio of 1:1. 16 h after co-culture, T cells were stained
with anti-CD69-PE/Cy7 (Biolegend,105512, H1.2F3, 1:100). For intracellular staining, T cells were fixed and permeabilized, followed by staining with Pacific Blue anti-mouse IFN-γ(XMG1.2)
(Biolegend, 505818, 1:100), PE/Cyanine7 anti-human/mouse Granzyme B (QA16A02) (Biolegend, 372214, 1:100), APC anti-mouse TNFα (MP6-XT22) (BioLegend, 506308, 1:100). Cells were acquired by
flow cytometry analysis.
Cytotoxicity was assessed using the LDH release assay (Promega, G1780) according to the manufacturer’s instructions. Briefly, LG1233-OVA target cells were seeded at a density of 6000
cells/well in a 96-well plate. OT-1 T cells were added at effector-to-target (E:T) ratio of 1:1 and the co-cultures were incubated for 8 h. Subsequently, the culture supernatants were
carefully harvested to avoid disturbing the cell pellet. LDH release, indicative of target cell lysis, was quantified using the enzymatic assay provided in the kit. Cytotoxicity percentage
was calculated using % Cytotoxicity = [(Experimental−Effector Spontaneous−Target Spontaneous)/(Target Maximum−Target Spontaneous)] × 100%, where Experimental represents LDH activity in wells
with both effector and target cells, Effector Spontaneous is the background LDH release from effector cells alone, Target Spontaneous from target cells alone, and Target Maximum from target
cells lysed with detergent to determine maximum LDH release. All assays were performed in quadruplicate to ensure reproducibility and statistical reliability.
sgNT and sgUhrf1 LG1233 cells were treated with 5 ng/mL recombinant murine IFNγ protein (Peprotech, 315-05) for 16 h. After treatment, the cells were collected and incubated with 1 µg/mL
OVA(SIINFEKL) peptide in a 37 °C water bath for 1 h. Subsequently, the cells were washed twice with PBS and stained with APC-conjugated anti-mouse SIINFEKL bound H-2Kb (25-D1.16) (Biolegend,
141605, 1:100) at 4 °C for 1 h. After wash with PBS, the samples were proceeded for flow cytometry analysis.
1 × 10⁶ sgNT or sgUhrf1 LG1233-OVA cells were subcutaneously injected into female C57BL/6 mice. Tumor tissues were collected on day 27. Total RNA was extracted using ZYMO RESEARCH kit
(Direct-zol RNA miniprep, cat. No. R2052) and dissolved in RNase-free water. Library construction and RNA sequencing were performed by Novogene. Briefly, mRNA was purified, and first strand
cDNA was synthesized using random hexamer primers followed by the second stand cDNA synthesis. After end repair, A-tailing, adapter ligation, size selection, amplification, and purification,
quantified libraries were pooled and sequenced on Illumina platform (NovaSeq PE150).
For RNA-seq data analysis, fastp v0.20.157 was used for read trimming and STAR v2.7.5a58 for mapping to the Gencode GRCm38 genome. Quality filtering was applied with Samtools v1.1859. Gene
counts were derived using featureCounts v2.0.160 and analyzed with DESeq2 v1.36.061, filtering for genes with >5 reads in >3 samples. P values were adjusted using the Benjamini-Hochberg
method. Significant DEGs (adjusted p