- Select a language for the TTS:
- UK English Female
- UK English Male
- US English Female
- US English Male
- Australian Female
- Australian Male
- Language selected: (auto detect) - EN
Play all audios:
ABSTRACT The development of computational tools for the systematic prediction of metabolic vulnerabilities of cancer cells constitutes a central question in systems biology. Here, we present
gmctool, a freely accessible online tool that allows us to accomplish this task in a simple, efficient and intuitive environment. gmctool exploits the concept of genetic Minimal Cut Sets
(gMCSs), a theoretical approach to synthetic lethality based on genome-scale metabolic networks, including a unique database of synthetic lethals computed from Human1, the most recent
metabolic reconstruction of human cells. gmctool introduces qualitative and quantitative improvements over our previously developed algorithms to predict, visualize and analyze metabolic
vulnerabilities in cancer, demonstrating a superior performance than competing algorithms. A detailed illustration of gmctool is presented for multiple myeloma (MM), an incurable
hematological malignancy. We provide in vitro experimental evidence for the essentiality of _CTPS1_ (CTPS synthase) and _UAP1_ (UDP-N-Acetylglucosamine Pyrophosphorylase 1) in specific MM
patient subgroups. SIMILAR CONTENT BEING VIEWED BY OTHERS SYNTHETIC LETHALITY IN LARGE-SCALE INTEGRATED METABOLIC AND REGULATORY NETWORK MODELS OF HUMAN CELLS Article Open access 15 July
2023 SL-SCAN IDENTIFIES SYNTHETIC LETHAL INTERACTIONS IN CANCER USING METABOLIC NETWORKS Article Open access 22 September 2023 TUMORMET: A REPOSITORY OF TUMOR METABOLIC NETWORKS DERIVED FROM
CONTEXT-SPECIFIC GENOME-SCALE METABOLIC MODELS Article Open access 07 October 2022 INTRODUCTION With the increasing coverage and accuracy of reference human genome-scale metabolic
networks1,2, the development of Constraint-based Modeling (CBM) approaches for different biomedical questions has significantly grown in the last years. One of the central topics in CBM has
been cancer metabolism2,3,4, as it constitutes an attractive strategy to gain insights into the underlying metabolic dependencies of tumor cells and systematically predict vulnerabilities.
We can find a plethora of methods in the literature5 that first construct context-specific metabolic models (CS-models) based on cancer -omics data and, subsequently, computationally predict
gene knockout perturbations that sufficiently decrease growth rate or disrupt a key metabolic task for cellular viability (gene essentiality analysis)6,7. These methods have been
successfully applied to identify cancer-specific essential genes in different tumors; however, there is still substantial room for improvement, as recently shown in Robinson et al.1. In this
direction, we released a conceptually different approach based on genetic Minimal Cut Sets (gMCSs), which does not require the construction of CS-models and more generally exploits the
concept of synthetic lethality8,9. In particular, gMCSs define a minimal set of genes whose knockout would render the functioning of a given metabolic task impossible. When applied to cancer
studies, we focus on metabolic tasks that compromise cellular viability and, thus, gMCSs convert into metabolic essential genes (gMCSs of size 1) and synthetic lethals (gMCSs of size
greater than 1). In our previous work8, we developed a mixed-integer linear programming (MILP) model able to search for gMCSs that predict the essentiality of a target gene based on
transcriptomic data. Using microarray expression data and the reference metabolic network Recon210, we reported a superior performance than other algorithms in the literature to predict gene
essentiality, according to knock-down genetic screens of 30 cancer cell lines from Project Achilles11. After 7 years of the release of our early gMCS approach8, different challenges must be
addressed to make it more powerful and attractive for cancer researchers. First, our previous MILP approach was designed for targeted gene essentiality analyses, as the one shown for RRM1
inhibition in MM. This approach becomes computationally infeasible for untargeted large-scale studies, typically found in functional cancer studies. In addition, it was restricted to single
gene knockout perturbations, being unable to predict higher-order gene knockout strategies. Hence, a different gMCS strategy must be followed to overcome these issues. Second, we need to go
beyond Recon210 and integrate our gMCS approach with Human1, the most recent reference human genome-scale metabolic network1. Human1 defines multiple basic metabolic tasks for cell
viability, leading to a multi-target problem that makes the computation of gMCSs even more demanding. Third, our previous methodology to identify cancer-specific essential genes relied on
microarrays data and must be adapted to RNA-seq data. Finally, there is a need for automatization of the application and visualization of the gMCS approach in a more intuitive environment,
which enables access and use to wet-lab researchers. In order to face these challenges, we present here gmctool, an automated computational tool that makes use of the gMCS approach to
predict metabolic vulnerabilities in cancer based on Human1 and RNA-seq data. We first show that gmctool is more accurate, informative and efficient than previous approaches to predict
metabolic essential genes in cancer. gmctool takes the next step and efficiently calculates lethal double gene knockouts (DKOs) strategies in cancer with metabolic networks. A detailed
illustration of gmctool is presented for MM, an incurable hematological malignancy. Using different sources of RNA-seq data, which include samples from healthy donors, MM patients and cell
lines, we identify metabolic liabilities of MM with gmctool. In vitro experimental work is presented for the inhibition of CTP synthase 1 (_CTPS1_) and UDP-N-Acetylglucosamine
Pyrophosphorylase 1 (_UAP1_). Finally, we extend the application of gmctool to 3 different solid tumors: bladder, breast and colorectal cancer. RESULTS gmctool
(https://biotecnun.unav.es/app/gmctool) is a freely accessible web tool for the calculation of metabolic vulnerabilities in cancer that uses genome-scale metabolic networks and RNA-seq data
from human cells as input data. gmctool exploits the concept of genetic Minimal Cut Set (gMCS), previously reported in Apaolaza et al.8. However, the gMCS approach implemented in gmctool is
different from the one presented in this early work, where we searched for gMCSs that explained the essentiality of a specific gene in a particular cancer sample based on expression data.
This targeted search required to solve a complex MILP problem, which can hardly be implemented for untargeted studies involving a large number of samples. To overcome this issue, gmctool
follows a more general strategy: (1) to compute a large and representative database of gMCSs, and (2) map gene expression data and identify essential genes for the requested samples. gmctool
includes a unique database of gMCSs, obtained with a simpler MILP approach that extends the work of Apaolaza et al.9, as well as an efficient method to identify essential genes in cancer.
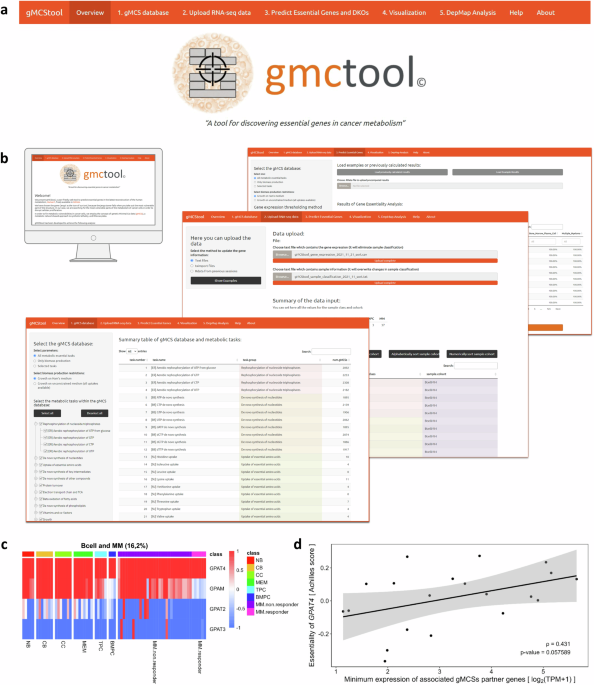
This approach allows us to transcend essential genes and calculate lethal DKOs. Full details can be found in the “Methods” section. gmctool is organized into 5 different modules (Fig. 1a):
(1) gMCS database, (2) Upload RNA-seq data, (3) Predict Essential Genes and DKOs, (4) Visualization and (5) DepMap analysis. A detailed illustration of the utilization of gmctool can be
found in the Help tab. In summary, the first 3 modules incorporate the basic functions to calculate essential genes and lethal DKOs (Fig. 1b). The last two modules allow us to visualize
essential genes or lethal DKOs and their companion biomarkers in the samples analyzed (Fig. 1c), as well as to conduct the correlation analysis of our gene essentiality predictions with data
from the Cancer Dependency Map (DepMap) (Fig. 1d)11,12. A full description of these 5 modules can be found in the Help tab of gmctool. We describe below the most relevant improvements of
gmctool at the algorithmic level. GENERATION OF A DATABASE OF GMCSS FOR GMCTOOL Genetic Minimal Cut Sets (gMCSs) are minimal subsets of genes whose simultaneous removal directly blocks a
particular metabolic task8,9. In cancer studies, this target metabolic task has been typically the biomass reaction, whose flux represents the proliferation rate, a key phenotype to disrupt
in cancer. However, the authors of Human1 consider not only biomass production but also other metabolic tasks that are essential for cellular viability1,13, such as the production of vitamin
and cofactors or activity of electron transport chain, which expands the scope of in silico predicted metabolic vulnerabilities. As detailed in the “Methods” section, we modified our
previous algorithm for the computation of gMCSs, presented in the work of Apaolaza et al.9, to consider the 57 basic metabolic tasks defined in Human1, including the biomass production (Fig.
2a). As a result of our calculations, we enumerated more than 160,000 gMCSs for Human1 (see “Methods” section). A great part of them corresponds to biomass production (57,717); however, we
also have gMCSs implicated in other relevant metabolic tasks: de novo synthesis of key intermediates (32,062), beta-oxidation of fatty acids (25,889) or de novo synthesis of nucleotides
(15,774) (Fig. 2b), among others. Due to its simplicity or the existence of spontaneous alternative reactions, we could not find gMCSs in 5 metabolic tasks (see Supplementary Table 1). The
length of computed gMCSs ranges from 1 gene to more than 15 genes, with 7 genes being the most repeated solution (Fig. 2c). This illustrates the high degree of metabolic flexibility of human
cells. Some of them are shared across the different metabolic tasks, obtaining a total of 97,607 unique gMCSs, which overall involve 1244 metabolic genes (Supplementary Data 1). This
database of gMCSs was stored in gmctool for further analysis. Supplementary Fig. 1 shows the tab of gmctool where the database of gMCSs, under the selected input parameters, can be
downloaded. Note here that for biomass production, we fixed the Ham’s growth medium, which is the one provided by default in Human1 for this basic metabolic task. However, gmctool provides
an additional database of gMCSs for Human1 under an unconstrained growth medium (all uptakes available in Human1). Importantly, our database of gMCSs contains a unique compendium of
metabolic essential genes and synthetic lethals of different sizes: pairs, triplets, quadruplets, etc. In particular, gmctool involves 1555 pairs of synthetic lethal genes (gMCSs of size 2),
20 of them being paralog pairs. Considering the full set of pairs of genes that can be obtained from Human1, where 14,128 out of 6,579,378 are paralogue pairs of genes (according to the
Ensemble annotation), this is a highly significant result (Hypergeometric test _p_-value: 7.28 × 10⁻¹¹), in line with previous studies suggesting that the fraction of synthetic lethal pairs
is significantly higher between paralogue gene pairs compared to the pairs of randomly selected genes14. This result reinforces the level of confidence in our database of gMCSs and synthetic
lethals. INTEGRATION OF RNA-SEQ DATA INTO GMCTOOL FOR PREDICTING METABOLIC VULNERABILITIES Following the concept of synthetic lethality, it is possible to predict cancer-specific essential
genes by combining our database of gMCSs and gene expression data, as demonstrated in Apaolaza et al.8. This can be done by searching for gMCSs in which all genes are lowly expressed except
one of them that is highly expressed and essential for the situation under study. Note here that gMCSs of size 1 directly correspond to essential genes for any cell type under the growth
medium considered, in this case, the Ham’s medium. A similar strategy can be followed to identify cancer-specific lethal DKOs, which can be obtained from gMCSs where all genes are lowly
expressed except two of them that are highly expressed and are not predicted as essential for the situation under study. Analogously, gMCSs of size 2 directly correspond to lethal DKOs for
any cell type under the growth medium considered; obviously, cancer-specific lethal DKOs come from synthetic lethals of higher order than 2. A summary of our gMCS pipeline for predicting
metabolic vulnerabilities can be found in Box 1. To calculate essential genes and lethal DKOs, we developed an efficient method based on our database of gMCSs and gene expression data
(“Methods” section). The definition of highly and lowly expressed genes is a crucial step here. In our previous work, Apaolaza et al.8, we relied on The Gene Expression Barcode tool15, which
is available for microarray data but not for RNA-seq data. For this reason, we developed our own threshold technique for RNA-seq data in gmctool, which can be applied independently to each
sample (cohort-independent). Our threshold strategy exploits the fact that at least one of the genes involved in every gMCS has to be highly expressed to guarantee the proper functioning of
its associated metabolic task. With this in mind, we infer for each sample a potential population of highly expressed genes by extracting the maximum expressed gene for each gMCS. Once
duplicated genes are eliminated, we build an empirical probability function of the expression of highly expressed genes for each sample and fixed the X% quantile threshold of expression for
them, referred to as gmcsTHX, to alleviate possible inconsistencies and incomplete metabolic pathways in Human1 (see “Methods” section, Box 1). We also implemented localT2, a
cohort-dependent methodology developed by Richelle et al.16, which defines a threshold for each gene based on the observed expression distribution across the samples of the cohort. In
summary, gmctool incorporates these 2 thresholding approaches to categorize RNA-seq data, which is then integrated with our database of gMCSs to predict essential genes and lethal DKOs. BOX
1 GMCS PIPELINE FOR THE CALCULATION OF METABOLIC VULNERABILITIES Credits: genome sequencer and sequencing flow cell icons were taken from obtained from bioicons.com. * 1. GENERATION OF A
DATABASE OF GMCSS Compute a list of gMCSs that targets every available metabolic task in Human1 using the _calculateGeneMCS_ function from the COBRA toolbox. * 2. GENE CATEGORIZATION BASED
ON RNA-SEQ DATA A potential population of highly expressed genes is obtained by extracting the maximum expressed gene of each gMCS. The X% quantile threshold (gmcsTHX) of this empirical
probability distribution is determined to discriminate between highly and lowly expressed genes. By default, we fixed this threshold to 5% (gmcsTH5) * 3. COMPUTATION OF ESSENTIAL GENES AND
LETHAL DKOS For essential genes, in addition to gMCSs of size 1, we efficiently search for gMCSs which contain only one highly expressed gene. A gene is considered essential if it is
essential in at least one metabolic task in Human1. Similarly, for lethal DKOs, in addition to gMCSs of size 2, we efficiently search for gMCSs which contain two highly expressed genes. A
DKO is considered lethal if it is lethal in at least one metabolic task in Human1. A summary list of essential genes and lethal DKOs is provided for each metabolic task and across them.
BENCHMARK OF NETWORK-BASED ALGORITHMS FOR PREDICTING CANCER-SPECIFIC ESSENTIAL GENES With the aim of assessing the prediction power of gmctool, we performed a benchmark study of gene
essentiality in cancer. We conducted the same analysis as the one found in Robinson et al.1, based on the DepMap database, which integrates RNA-seq gene expression data12 and CRISPR
essentiality screening experiments11 for a total of 621 cell lines. To avoid bias in the comparison, we used the same release of DepMap than the original analysis. As in Robinson et al., the
genes in DepMap with Achilles score lower than −0.6 were defined as the gold-standard reference set of essential genes. We used gmctool to upload RNA-seq and sample information data
(Supplementary Fig. 2) and to conduct gene essentiality analysis (Supplementary Fig. 3). In our analysis, we considered the list of gMCSs from the 57 basic metabolic tasks (biomass
production included) and predicted essential genes with both gene expression thresholding approaches separately: gmcsTH5 and localT2 (Supplementary Data 2). We compared our predicted
essential genes with those resulting from DepMap (gold standard). As in Robinson et al.1, we calculated the accuracy, sensitivity, specificity, and Matthew’s correlation coefficient (MCC).
Note here that MCC is a more adequate performance metric than accuracy for cases where there is an unbalance between true positives and true negatives, as we have over 90% of non-essential
genes. We also included the results presented in the publication of Human11, which used tINIT to reconstruct 621 cell-specific GEMs and predict essential genes with single gene knockout
perturbations (referred to here as tINIT). Results can be found in Fig. 3a. In the light of the MCC obtained, it can be observed that our gMCS approach overperforms tINIT with both
thresholding approaches considering all metabolic tasks (unpaired one-sided Wilcoxon test _p_-value ≤ 0.0001). The same result was found if we exclusively consider the essential tasks
related to biomass production (Supplementary Fig. 4). In addition, our gmcsTH5 thresholding approach seems more accurate and conservative than localT2, which obtains the highest results in
sensitivity but includes too many false negatives (unpaired one-sided Wilcoxon test _p_-value ≤ 0.0001). Thus, gmctool is more accurate than the state-of-the-art approach in the literature
for predicting essential genes in cancer. With respect to computation time, using a standard processor with 4 cores (see “Methods” section), gmctool took 82 s with gmcsTH5 and 79 s with
localT2 for the above analysis (Fig. 3b and Supplementary Table 2 for more specific details). In contrast, tINIT required several days, as the construction of CS-models is time-consuming
(between 16 and 83 min per sample), and the calculation of essential genes in each of the CS-models required 36 min on average. With our previous gMCS approach8, this analysis would have
taken several weeks. This computational improvement makes gmctool a practical tool for researchers in cancer metabolism. LETHAL DKOS IN CANCER RESEARCH AND GMCTOOL The identification of
lethal DKOs is a challenging task in cancer functional genomics. Combinatorial CRISPR screenings are becoming more available in cancer research17,18; however, different studies and
technologies show limited agreement for predicting lethal DKOs19. Recently, based on double-knockout CRISPR screens and molecular profiles, an innovative statistical method was developed to
identify robust synthetic lethals for pairs of paralog genes19, which have been more widely explored with CRISPR studies. We compared paralog pairs that are predicted synthetic lethal via
gmctool and the robust approach presented in that study. Since robust synthetic lethals are not context-specific but refer to general synthetic lethals, we only considered in our analysis
gMCSs of size 2. We found a statistically significant association between the results obtained with gmctool and this robust SL approach (Fisher test _p_-value: 0.0001). Moreover, gmctool
opens the possibility to analyze higher-order gene knockout strategies and predict context-specific lethal DKOs. Here, we calculated essential genes and lethal DKOs for the same 621 cell
lines analyzed in the previous subsection under the same computational conditions (Supplementary Data 3). The complete analysis took us 140 s with gmcsTH5 and 139 s with localT_2_ (Fig. 3b
and Supplementary Table 2 for more details), which constitutes an impressive result considering that: (1) all existing approaches require days to perform this study and (2) it was infeasible
with our previous approach8. Based on the above analysis, we can easily investigate previously identified pairs of synthetic lethal genes in different cancer cell lines. We focus here on
_ENO1_-_ENO2_, which has been hypothesized as a synthetic lethal pair20, but without a clear outcome from different combinatorial CRISPR screenings17,18. gmctool integrates _ENO1_ and _ENO2_
in higher-order synthetic lethals involving _ENO3_ and other genes. In particular, we found that they participate in 638 gMCSs (Supplementary Data 4). Considering these gMCSs and gene
expression data, gmctool predicted that _ENO1_-_ENO2_ constitutes a lethal DKO only in 109 out of the 621 considered cancer cell lines. Figure 3c shows a relevant gMCS that explains the
lethality of the double-knockout of _ENO1_-_ENO2_ in a subset of CCLE samples due to low expression of _ENO3_, _AMT_, _PDHA2_ and _ABAT_. Note here that we also found a subset of CCLE
samples where _ENO1_ was essential and _ENO1_-_ENO3_ were a lethal DKO (Fig. 3c). In consequence, gmctool defines a more general framework to contextualize and understand lethal DKOs in
cancer metabolism. Finally, due to the limitations of current double-knockout CRISPR studies, we complemented the above analysis using single-gene CRISPR screening from DepMap. We observed
that the essentiality of _ENO1_ presents a higher correlation with the genes involved in our gMCSs than exclusively with _ENO2_ (Supplementary Fig. 5), which provides evidence for the
hypothesis generated by gmctool. As shown in Fig. 3c, we observe cell lines where the gene with the highest expression (across gMCSs involving _ENO1_) is not _ENO2_ but _ENO3_ or other
genes, which allows us to better explain the lethality of _ENO1_. APPLICATION OF GMCTOOL TO MULTIPLE MYELOMA To illustrate the use of gmctool, we performed a screening prediction of
metabolic vulnerabilities in MM. We used a previous dataset generated in our group that includes RNA-seq data from different B-cell subpopulations from healthy individuals21 and bone marrow
plasma cells from MM patients22,23. We also considered data from the MMRF-CoMMpass project, funded by the Multiple Myeloma Research Foundation (MMRF), which includes RNA-seq data for 767 MM
patients at diagnosis. Finally, we obtained RNA-seq data for 8 MM cell lines available in Cancer Cell Line Encyclopedia (CCLE)12. We projected the RNA-seq expression profiles of the three
datasets onto our database of gMCSs, obtaining a table that indicates the number of samples for which a gene is considered as essential in each tissue type in at least one of the basic
metabolic tasks (Supplementary Data 5). We selected the MM-specific essential genes according to the following criteria: (1) to be essential in more than 10% of MM samples from our cohort;
(2) to be non-essential in all the samples from healthy B-cell subpopulations and bone marrow plasma cells, the healthy counterpart of myeloma cells; (3) to be essential in more than 10% of
CoMMpass samples and (4) to be essential in one or more MM cell lines. Table 1 shows the 4 MM-specific essential genes identified in our analysis, including the percentages of samples in
which the gene is considered as essential. Furthermore, we extracted the 6 gMCSs that explained the essentiality of these 4 genes in MM and did not affect samples of B-cell subpopulations
(Supplementary Figs. 6–11). We followed a similar procedure for identifying MM-specific lethal DKOs, but none of the candidates satisfied the 4 criteria (Supplementary Data 6). Considering
the length of the gMCSs associated with the essential genes in Table 1 (Supplementary Figs. S6–S11), we focused on _CTPS1_ and _UAP1_ for further analysis. CTPS1 INHIBITION IN MULTIPLE
MYELOMA _CTPS1_ has been previously identified as a drug target in different hematological malignancies but not in MM24. In fact, different selective compounds have been developed for
_CTPS1_ inhibition25, and they are currently undergoing clinical trials in relapsed/refractory B or T Cell Lymphoma26. However, the synthetic lethal interactions involving _CTPS1_ remain
elusive, and available double-knockout CRISPR screenings exhibit contradictory results17,18. Figure 4a shows the gMCS that involves _CTPS1_ and _CTPS2_ and indicates the essentiality of
_CTPS1_ in a subgroup of MM samples but not in the healthy tissues from different B-cell subpopulations. Similarly, the patients from CoMMpass that could be responders and non-responders to
_CTPS1_ inhibition, based on the expression of _CTPS2_, can be observed. The same result is seen for the 8 MM cell lines considered, where only one of them (KMS-12) is non-responder to
_CTPS1_ inhibition. In addition, Fig. 4b shows that the expression of _CTPS2_ decreases for the subgroup of MM samples that potentially could respond to _CTPS1_ inhibition (MM responders).
Note here that we used gmctool to automatically generate these figures (Supplementary Fig. 12). Interestingly, gmctool provides the associated metabolic task for each gMCS. In this
particular case, the inhibition of _CTPS1_ and _CTPS2_ blocks several tasks: de novo CTP (_cytidine triphosphate_) synthesis, de novo dCTP (_deoxycytidine triphosphate_) synthesis and
biomass production, which disrupts the production of CTP, dCMP (_deoxycytidine monophosphate_), DNA and RNA. Based on this information, we performed an in silico simulation for the addition
of cytidine to the growth medium, showing a rescue of proliferation after the inhibition of _CTPS1_ and _CTPS2_, which illustrates how gmctool provides further evidence for predicted
synthetic lethals (Supplementary Table 3). The core of the hypothesis is that _CTPS1_ and _CTPS2_ are synthetic lethal and, thus, the essentiality of _CTPS1_ depends exclusively on _CTPS2_,
namely when _CTPS2_ is lowly expressed, _CTPS1_ becomes essential. We assessed this hypothesis with DepMap data available in gmctool, finding a significant correlation between the _Achilles_
score of _CTPS1_ and the expression of _CTPS2_ (rho = 0.247, _p_-value = 2.5e-13), as detailed in Fig. 4c. A similar significant correlation was found with proteomic data (rho = 0.207,
_p_-value = 5.6e-4), which is also available in DepMap and it is included in the ‘Visualization’ module of gmctool (Supplementary Fig. 13). Despite these positive results, Fig. 4c also shows
cell lines with low _CTPS2_ level but limited _CTPS1_ Achilles score, which might hide context-specific compensatory mechanisms (beyond metabolism) that overcome the depletion of CTP after
the knockout of _CTPS1_. We carried out in vitro experimental validation of the essentiality of _CTPS1_ in four MM cell lines. For three of them, NCI-H929, RPMI-8226 and KMS-11, gmctool had
predicted their sensitivity to _CTPS1_ inhibition due to their low expression of _CTPS2_, while for one of them, KMS-12, gmctool had predicted its resistance to _CTPS1_ inhibition due to its
high expression of _CTPS2_ (Fig. 4d, Supplementary Table 4). First, we examined the effect of three different CRISPR/Cas9 single guides RNA (sgRNA) specific to _CTPS1_ on cell proliferation
for these cell lines. All _CTPS1_ sgRNAs efficiently decreased _CTPS1_ expression in the cell lines analyzed as detected by Western Blot (Supplementary Fig. 14). Downregulation of _CTPS1_
expression with any of the three sgRNAs significantly reduced cell proliferation in KMS-11 and RPMI-8226, but not in KMS-12 (Fig. 4e). Moreover, we synthesized a _CTPS1_ inhibitor,
previously developed by Rao and colleagues27, and assessed its effect in the proliferation of the three cell lines mentioned above. As a result, NCI-H929 and KMS-11 reduced their
proliferation by more than 50% after 4 days of culture, and no alterations were obtained for KMS-12 (Fig. 4f). These positive results support the relevance of _CTPS1_ in MM. UAP1 INHIBITION
IN MULTIPLE MYELOMA We conducted a similar analysis for _UAP1_. Figure 5a shows the gMCS that involves _UAP1_ and _UAP1L1_ and explains the essentiality of _UAP1_ in a subgroup of MM samples
but not in the healthy tissues from different B-cell subpopulations. Interestingly, the expression of _UAP1_ increases along the B-cell differentiation, whereas the _UAP1L1_ expression
decreases along the B-cell differentiation until reaching the MM stage (Fig. 5b). The same result can be observed for the CoMMpass cohort and the subset of MM cell lines considered (Fig. 5a,
b). Of note, it can be observed from the CoMMpass cohort a significant association between MM patients responding to _UAP1_ inhibition and those harboring the t(4;14) translocation (odds
ratio = 16.79, Fisher’s test _p_-value < 2.2e-16), a poor prognosis biomarker in MM. As in _CTPS1_-_CTPS2_, we assessed the synthetic lethality of _UAP1_-_UAP1L1_ with DepMap, finding a
positive and significant correlation between the CERES Achilles score of _UAP1_ and the expression of _UAP1L1_ (rho = 0.443, _p_-value < 2.2e-16) (Fig. 5c). The same outcome was obtained
with proteomics data (rho = 0.370, _p_-value = 2.72e-10). These results are in line with previous large-scale combinatorial CRISPR screenings in the literature that hypothesize the synthetic
lethality of _UAP1_-_UAP1L1_17,18. According to gmctool, the synthetic lethal interaction of _UAP1_ and _UAP1L1_ disrupts the production of UDP-N-acetylglucosamine (UDP-GlcNAc), a
metabolite in the biomass reaction that is required for the biosynthesis of glycoproteins and glycoconjugates. Recent studies propose that UDP-GlcNAc is essential in B-cell homeostasis,
showing that cells that present a lack of this metabolite have greater apoptosis levels28. As MM is a B-cell-derived malignancy, this early work provides further evidence of the synthetic
lethality of _UAP1_-_UAP1L1_. We carried out in vitro experimental validation of the essentiality of _UAP1_ in two MM cell lines. For one of them, OPM-2, gmctool had predicted their
sensitivity to _UAP1_ inhibition due to the low expression of _UAP1L1_, while for the other one, JJN-3, gmctool had predicted the opposite outcome due to the high expression of _UAP1L1_
(Fig. 5d, Supplementary Table 5). We assessed the effect of two different short interfering RNA (siRNA) for _UAP1_ on the proliferation of OPM-2 and JJN-3. Both _UAP1_ siRNAs efficiently
decreased _UAP1_ expression in the cell lines analyzed as detected by qPCR (Supplementary Fig. 15). Downregulation of _UAP1_ expression with both siRNAs significantly reduced cell
proliferation in OPM-2, but not in JJN-3 (Fig. 5e), as predicted by gmctool. Note here that only OPM-2 presents the t(4;14) translocation29, in line with the results observed from the
CoMMpass cohort. APPLICATION OF GMCTOOL TO SOLID TUMORS Finally, we conducted a similar computational analysis with gmctool for 3 different solid tumors: bladder, breast and colorectal
cancer, for which we obtained transcriptomic data for tumor and healthy counterpart samples from TCGA30. For each cancer type, a potential list of essential genes was derived (Supplementary
Data 7) following similar criteria as in MM: (1) to be essential in more than 10% of tumor samples and (2) to be non-essential in all the samples from the healthy counterpart. It is
interesting to note the diversity found across tested tumors, as we observed limited overlap at the gene essentiality level. We found 2 essential genes in bladder cancer, one of them is
stearoyl CoA desaturase‐1 (_SCD_), whose inhibition has been recently proved to reduce cellular proliferation in bladder cancer cells31. In breast cancer, gmctool predicted 2 essential
genes, including Acetyl-CoA Carboxylase α (_ACACA_), previously validated as essential for the survival of breast cancer cells32. Finally, 6 essential genes were identified for colorectal
cancer. As in breast cancer, gmctool also predicted the essentiality of _ACACA_ in this tumor, which is again supported by the literature33. Full details of gMCSs involved in the
essentiality of _SCD_ and _ACACA_ in these tumors can be found in Supplementary Figs. 16–18. These results show the predictive capacity of gmctool and its wide possibility of use in cancer
research. DISCUSSION In this work, we present gmctool, a computational tool for the prediction of metabolic vulnerabilities in cancer based on gMCSs, a network-based approach to synthetic
lethality, Human1 and RNA-seq data. gmctool makes use of an improved gMCS approach that overcomes the computational limitations of our previous algorithm8 and enables the efficient and
accurate calculation of essential genes and lethal DKOs in a simple and intuitive environment. As a result, gmctool constitutes a unique research tool to study and target cancer metabolism
in the context of personalized medicine. Importantly, gmctool stores a unique database of more than 160,000 gMCSs that block at least one basic metabolic task of Human1, the most recent
genome-scale metabolic network of human cells. The computation of this database of gMCSs substantially simplifies the process of identifying cancer-specific essential genes and lethal DKOs,
which can be now extracted by correctly mapping gene expression data onto them. Moreover, this strategy makes our gMCS approach more accessible and natural to researchers less familiar with
the field of constraint-based modeling. In addition, gmctool allows us to predict metabolic vulnerabilities more efficiently than other algorithms in the literature, as we avoid the step of
constructing context-specific metabolic models, which makes use of time-consuming optimization techniques. For example, gmctool required less than 3 min to calculate essential genes and
lethal DKOs for all the 621 cancer cell lines available in DepMap, whereas tINIT needs between 30 and 60 min to reconstruct the metabolic model of one single cell line using RNA-seq data.
Accordingly, gmctool substantially reduces the computational requirements to predict metabolic vulnerabilities in cancer using network-based algorithms. Specifically, we could analyze the
samples in the “Results” section, which add up to more than 1400 samples, considering DepMap and different MM cohorts, in less than 5 min with a standard computer. This study would be
unfeasible with our previous gMCS methodology8. We also extended our previously developed algorithms in order to: (1) consider that Human1 involves different basic metabolic tasks beyond
biomass production, typical target in network-based gene essentiality analysis; (2) predict metabolic vulnerabilities based on RNA-seq data, namely by proposing a different approach to
discriminate between highly and lowly expressed genes (gmcsTHX). These advances allowed us to compare the accuracy of gmctool with tINIT1,13,34, the approach developed by the authors of
Human1 with a view to build CS metabolic models of cancer cells and conduct gene essentiality analysis. Importantly, this study shows that gmctool is significantly more accurate than tINIT
when compared with gene essentiality screens available in DepMap. For the same cell lines considered in our gene essentiality benchmark with DepMap data, we efficiently computed
cancer-specific lethal DKOs and illustrated with _ENO1_-_ENO2_ the predictive capacity of gmctool. Our study emphasizes the importance of considering higher-order genetic interactions to
define synthetic lethals and predict lethal DKOs. Given the statistically significant association between gMCSs of size 2 and synthetic lethal paralog pairs of genes19, we expect that
gmctool can contribute to contextualize conflicting experimental data from double-knockout CRISPR screens. Another advantage of gmctool is its visualization capabilities, as it exploits the
fact that essential genes are derived from specific gMCSs, where one gene is highly expressed and the rest genes are lowly expressed. Consequently, genes involved in gMCSs do not only allow
us to predict essential genes or lethal DKOs but also response biomarkers for their inhibition. This idea lies beneath the different plots that can be extracted from gmctool, which
facilitates the interpretation of our computational predictions. In this direction, gmctool also outputs essential tasks and metabolite biosynthesis that are disrupted by gMCSs, which are
particularly informative to construct testable hypotheses about the mechanism behind predicted synthetic lethals. This additional output of the tool might be of interest due to the fact that
the composition of the human biomass is typically defined as universal for all cells, but some authors think that this might be an incorrect assumption35,36,37,38,39, suggesting that it
could be context-specific and some metabolites are more relevant than others for different tumors. We performed gene essentiality analysis in the different B-cell differentiation
subpopulations and MM samples from several cohorts, aiming to identify candidates that maximize the number of MM samples affected but, at the same time, minimize the toxicity of the
treatment, which is simulated here as the number of healthy tissue samples affected by such target. Despite the large number of gMCSs stored in gmctool, we only spot 4 metabolic enzymes
whose inhibition is selectively toxic for MM cells, which illustrates the difficulty of identifying cancer-specific metabolic processes. Among them, we focused on _CTPS1_ and _UAP1_.
Although further experimental work is required to validate the synthetic lethality of _CTPS1_-_CTPS2_ and _UAP1_-_UAP1L1_ in a wider setting, in vitro experiments confirmed the predictions
of gmctool in 3 MM cell lines for _CTPS1_ inhibition (2 positives for _CTPS1_ inhibition and 1 negative for _CTPS1_ inhibition) and 2 MM cell lines for _UAP1_ inhibition (1 positive for
_UAP1_ inhibition and 1 negative for _UAP1_ inhibition). Interestingly, from the CoMMpass cohort, we found a significant association between MM patients harboring the t(4;14) translocation
and those responding to _UAP1_ inhibition. This finding potentially unveils a promising therapeutic strategy for this subset of patients with a poor prognosis in MM. While our study
demonstrates the potential of gmctool to identify metabolic vulnerabilities in different types of tumors, it can also be easily applied to individual patients. Certainly, gmctool can make
use of RNA-seq data from a specific patient to uncover tailored vulnerabilities with the goal of creating true personalized medicine programs. The availability of panels of approved
compounds would be instrumental to achieve this goal. Finally, despite the advance of gmctool over existing tools, there is still a long way to achieve the desired performance in predicting
cancer-specific vulnerabilities using genome-scale metabolic networks. The extension and update of existing reference genome-scale metabolic networks is obviously a critical task to improve
further accuracy metrics. In this respect, Human1 has established an open and active community that provides a successful and integrative response to that need. Moreover, the definition of
cancer-specific metabolic tasks, beyond common basic metabolic tasks, such as biomass production40, expands current strategies to identify essential genes and increase sensitivity. We
recently illustrated the relevance of polyamines in different hematological tumors, and these metabolites are not typically considered in standard biomass reactions41. The development of
systematic methods to extract these essential metabolites in different contexts constitutes a challenging issue. Finally, the integration of metabolic and regulatory networks is a difficult
but relevant task that has a great impact on predicting metabolic vulnerabilities, particularly when the proxy for activity is gene expression data that could be modified due to compensatory
regulatory pathways. Making progress in all these challenges will help not only gmctool but all methods in the literature to predict more accurately vulnerabilities and response biomarkers
in order to address unmet clinical needs and reach our goal of providing patients more personalized treatments. METHODS Our research complies with all relevant ethical regulations and has
been approved by the committee of ethics of the research of the University of Navarra and follows their prescribed ethical guidelines. Written informed consent was obtained from each
participant. Men and women were included in the analyses. CALCULATION OF GENETIC MINIMAL CUT SETS (GMCSS) IN HUMAN1 The reference metabolic network Human1 (version 1.4.0)1 was obtained from
https://github.com/SysBioChalmers/Human-GEM. Human1 encompasses 13,416 reactions, 8458 metabolites and 3628 genes. Importantly, Human1 defines 56 basic metabolic tasks for any human cell in
addition to biomass production, typically included in other genome-scale metabolic reconstructions10,42,43. Each of these basic metabolic tasks is defined by a list of output metabolites
that must be produced from a list of input metabolites, and if necessary, an artificial equation is included in the task in order to support this transformation, e.g., a reaction that
simulates the energy expenditure (ATP) by reactions involved in the task. Lower and upper bounds are also fixed for a specific subset of reactions involved in each metabolic task. With this
information, a different metabolic model for each basic task can be built and used to assess the effect of genetic perturbations via linear programming, specifically by assuming the mass
balance condition and thermodynamic constraints44. Essential genes correspond to those single gene knockouts leading to an infeasible linear problem (at least one of the required lower/upper
bounds in the metabolic task is violated). However, this strategy is not efficient in calculating higher-order essential gene knockout perturbations (synthetic lethals) due to the
combinatorial nature of the problem. Fortunately, the gMCS approach is suitable for this task9. For the calculation of gMCSs, we used the calculateGeneMCS function available in the COBRA
Toolbox45, available at https://github.com/opencobra/cobratoolbox/. This function requires a metabolic model and a single target reaction to be blocked as input data. We constructed this
input data for each metabolic task following its associated information about inputs, outputs, artificial equations and lower bounds. A detailed illustration as to how the target reaction
was derived for each metabolic task can be found in Supplementary Note 1. The adaptation of Human1 to the calculateGeneMCS function from COBRA leads to slightly different metabolic models to
the ones originally built Human1. However, we checked for each metabolic task that the essential genes in our metabolic models, obtained with the _singleGeneDeletion_ function available in
COBRA, and the original models in Human1, derived from the checkTasksGenes function from RAVEN46, were the same. In order to reduce the computational cost of calculating gMCSs, the resulting
metabolic models for each essential task were simplified using the fastFVA function from COBRA (without any requirement in the objective function). Finally, all calculated gMCSs were
checked using the checkTasks function available in RAVEN using the original metabolic models in Human1. This task was performed to remove possible false positive gMCSs that could arise due
to the time limit being fixed in the Mixed-Integer Linear Programming solver used in the calculateGeneMCS function9. The database of gMCSs was computed with the University Navarra cluster,
using Intel(R) Xeon(R) Silver 4110 CPU @ 2.10 GHz processors, limiting to 8 cores and 8 GB of RAM computer. A time limit of 120–300 s was set for each solution derived from the function
calculateGeneMCS. GENE CATEGORIZATION BASED ON RNA-SEQ DATA In our computational approach, we denote a gene as essential in a given sample when it is the only gene expressed in at least one
gMCS. Thus, as a means to identify essential genes for each sample, we need to systematically decide which genes are highly (ON) or lowly (OFF) expressed. The same logic was systematically
applied to lethal DKOs. To that end, we developed our own methodology using RNA-seq expression data. Our approach exploits our database of gMCSs by assuming that all of them should involve
at least one highly expressed gene to guarantee that their associated metabolic tasks are feasible. In particular, we assume that the gene with the highest expression in each gMCS is the one
that should be highly expressed. Consequently, we extracted the maximum expression level in every gMCS and every essential task and generated an empirical distribution of highly expressed
genes for each sample (XH). Note here that repetitions are not taken into account, and each gene contributes exactly one value to the distribution. We considered as highly expressed those
genes expressed above the Xth percentile, referred to here as gmcsTHX, and lowly expressed otherwise. We fixed the threshold of expression at the 5th percentile (gmcsTH5) to alleviate
possible inconsistencies and incomplete metabolic pathways in Human1. In addition, to compare our innovative thresholding method with a literature standard, we used the localT2
methodology16. Briefly, it considers a gene as MAYBE ON in a specific sample whenever its expression level is greater than its mean expression level across the samples of the cohort, MAYBE
OFF otherwise. Additionally, two global expression thresholds are applied in localT2: genes whose expression is below the 25th percentile of the distribution of expression for all samples
and genes are considered as OFF, whereas those above the 75th percentile of the same distribution are considered as ON. This global expression threshold dominates the categorization obtained
from the relative expression threshold based on the mean expression value. Remarkably, our gmcsTH5 approach is independently applied to each sample, i.e., we identified gmcsTH5 for each
sample and defined the subset of highly and lowly expressed genes as those having an expression value higher and lower than gmcsTH5, respectively. Instead, localT2 is dependent on the cohort
to categorize genes, as they consider all samples to establish global and relative thresholds. Both thresholding methods are available in gmctool, and they can be applied to categorize the
1244 genes that participate in all the calculated gMCSs. A sensitivity analysis was performed in Supplementary Fig. 19, which shows the same analysis presented in Fig. 3 for DepMap data with
several percentiles of gmcsTHX (gmcsTH0, gmcsTH1, gmcsTH5, gmcsTH10), finding robust results for lower expression thresholds. Moreover, we also tested the implication of normalization of
TPM for localT2 and the effect of the gene-set selection for the 25th-75th threshold of localT2. Overall, we found more accurate results using gmcsTHX than with localT2. EFFICIENT
CALCULATION OF ESSENTIAL GENES USING GMCSS AND GENE EXPRESSION DATA Once all gMCS have been calculated and gene expression values are classified as highly or lowly expressed, gene
essentiality analysis can be carried out. In particular, we search for gMCSs that have exclusively one gene defined as highly expressed, and the rest of genes lowly expressed. This can be
easily accomplished with the following procedure. Assume that _L_ is an \({nxg}\) binary matrix that defines for each row _i_ (_i_ = 1,…,_n_) whether a gene _j_ (_j_ = 1,…,_g_) is involved
in a particular gMCS, being _n_ the number of gMCSs and _g_ the number of genes involved in the complete list of gMCSs. In addition, the binary vector X of dimensions \({gx}1\) defines
whether the gene is highly expressed in a particular sample _s_. Finally, the integer vector Y of dimension \({nx}1\) defines the number of highly expressed genes for each gMCS _i (i_ =
_1,…,n)_, and it can be calculated as follows: $${{\bf{L}}}\cdot {{\bf{x}}}={{\bf{y}}}$$ (1) Essential genes can be extracted from those rows in L where only one gene is highly expressed.
The indices of these rows from L are denoted as L1, namely: $${{{\rm{L}}}}_{1}{{=}}\left\{{i}\, |{{{\rm{y}}}}_{{{\rm{i}}}}{{=}}{1}\right\}$$ (2) Essential genes are obtained by conducting
the intersection between X and each row of L whose indexes are in L1, leading to the binary vector of essential genes K1 of dimension \({gx}1\). gmctool can create a list of essential genes
and associated gMCSs for each basic metabolic task in Human1. Note here that gMCSs that comprise only one gene are essential genes in all human cells. EFFICIENT CALCULATION OF LETHAL DKOS
USING GMCSS AND GENE EXPRESSION DATA To calculate lethal DKOs, we search for gMCSs that have two genes defined as highly expressed, and the rest of genes lowly expressed for a particular
sample. However, we need to ensure that essential genes are not part of these gMCSs. Starting from L and K1 from the previous subsection, the binary vector _u_ of dimension \({nx}1\) defines
whether (or not) a gMCS involves an essential gene, namely: $${{\bf{L}}}{{\cdot }}{{{\rm{K}}}}_{1}{{=}}{{\bf{u}}}$$ (3) Thus, lethal DKOs can be extracted from those rows in L where two
genes are highly expressed and essential genes are not involved, denoted here _L__2_, namely: $${{\rm{L}}}_{2}{=}\left\{{{\boldsymbol{\ {i}}}} | {{\rm{y}}}_{{\rm{i}}}=2 \, {{\rm{and}}} \,
{{\rm{u}}}_{{\rm{i}}}={0}\right\}$$ (4) Lethal DKOs are obtained by conducting the intersection between X and each row of L whose index is in L2, leading to the binary vector of lethal DKOs
K2 of dimension (_g*(g_-1_))x_1. gmctool can create a list of lethal DKOs and associated gMCSs for each basic metabolic task in Human1. Note here that gMCSs that comprise only two genes are
lethal DKOs in all human cells. Note here that for the study of essential genes and lethal DKOs in CCLE cell lines, detailed in the “Results” section and Fig. 3b, an Intel(R) Xeon(R) CPU
E3-1270 v6 @ 3.80 GHz (8 CPUs), ~3.8 GHz processor was used. MULTIPLE MYELOMA CASE STUDY RNA-seq data from our group consists of 37 MM patients (GSE151063)22,23 and 35 samples from different
B-cell subpopulations (GSE114816)21. Sample 57802 was removed from the study for being detected as an outlier in a PCA analysis. RNA-seq from the MMRF-CoMMpass has 767 samples from MM
patients at diagnosis time, available in IA18 release. RNA-seq from 7 MM cell lines was obtained from DepMap, release 21Q112. These cell lines are NCI-H929, JJN-3, KMS-11, KMS-12-BM,
KMS-28-BM, MM.1S, RPMI-8226 and OPM-2. RNA-seq data was downloaded in TPM and binarized using the gmcsTH5 thresholding approach. METABOLITE ESSENTIALITY PREDICTION In order to identify
essential metabolites whose production is disrupted through gMCSs, we only focused on the biomass production task, due to its underlying complexity. The rest of the basic metabolic tasks are
well-defined and highly specific, depending only on a reduced number of metabolites. To that end, we first defined a list of metabolites directly related to the biomass production. As in
the biomass reaction of Human1 there are several metabolite pools, we also included their precursors in such target list. Then, we created a sink exchange reaction for each target metabolite
and assessed their production through an FBA analysis44 after the removal of genes involved in each gMCS. We extracted for each gMCS the essential metabolites whose production is disrupted
(maximal production is zero). Q-PCR The expression of _CTPS1_ and _CTPS2_ were analyzed by Q-PCR in MM KMS-11, KMS-12 and NCI-H929 cell lines. Similarly, the expression of _UAP1_ and
_UAP1L1_ were analyzed by Q-PCR in OPM-2 and JJN-3 cell lines. RNA was extracted with TRIzol Reagent (Invitrogen) according to the manufacturer’s instructions. First, cDNA was synthesized
from 1 µg of total RNA using the PrimeScript RT reagent kit (Perfect Real Time) (Cat No RR037A, TaKaRa) following the manufacturer’s instructions. The quality of cDNA was checked by a
multiplex PCR that amplifies _PBGD_, _ABL_, _BCR_ and _β2-MG_ genes. Q-PCR was performed in a QuantStudio 5 Real-Time PCR System (Applied Biosystems), using 20 ng of cDNA in 2 µL, 1 µL of
each specific primer at 10 µM (_CTPS1_ F: TTATTGAGGCCTTCCGTCAG; _CTPS1_ R: GGGAAAGCCCAAGTCCTCTA; _CTPS2_ F: GCTGTCCAGGAGTGGGTTAT; _CTPS2_ R: CGCCTTAAACTGGAATTGTCT; _UAP1_ F:
GGGATCAAGATCAGCTCCAG; _UAP1_ R: GATATGCAACGCCGAGTCTT; _UAP1L1_ F: TGCTGTACAATGCAGGCAAC; _UAP1L1_ R: AGCGGCTTTACCAGATTCC), 5 µL of SYBR Green PCR Master Mix 2X (Cat No 4334973, Applied
Biosystems) in 10 µL reaction volume. The following program conditions were applied for Q-PCR running: 50 °C for 2 min, 95 °C for 60 s following by 45 cycles at 95 °C for 15 s and 60 °C for
60 s; melting program, one cycle at 95 °C for 15 s, 40 °C for 60 s and 95 °C for 15 s. The relative expression of each gene was quantified by the Log 2(−ΔΔCt) method using the gene _GUS_ as
an endogenous control. CELL CULTURE KMS-11, KMS-12, NCI-H929 and OPM-2 cell lines were maintained in culture in RPMI1640 medium (Gibco, Grand Island, NY) supplemented with 10% fetal bovine
serum (Gibco, Grand Island, NY) and penicillin/streptomycin (BioWhitaker, Walkersville, MD) at 37 °C in a humid atmosphere containing 5% CO2. JJN-3 cell line was cultured in 40% IMDM (Gibco,
Grand Island, NY), 40% DMEM (Gibco, Grand Island, NY) and 20% fetal bovine serum (Gibco, Grand Island, NY) supplemented with penicillin/streptomycin (BioWhitaker, Walkersville, MD). All
cells were obtained from the DSMZ or the American Type Culture Collection (ATCC) or from the Japanese Collection of Research Bioresources Cell Bank. All cell lines were authenticated by
performing a short tandem repeat allele profile and were tested for mycoplasma (MycoAlert Sample Kit, Cambrex), obtaining no positive results. SMALL MOLECULE SYNTHESIS OF CTPS1 INHIBITOR
Synthesis of compound 1 from Rao et al.27 was performed by Wuxi Apptec and consisted of three steps. First, to a solution of EDCI (172.07 mg, 897.57 µmol, 1.5 eq) and DMAP (73.10 mg, 598.38
µmol, 1 eq) in DCM (5 mL) were added 3-methoxyaniline (110.54 mg, 897.57 µmol, 100.49 µL, 1.5 eq). This solution was then added to 3-nitrobenzoic acid (0.1 g, 598.38 µmol, 1 eq), and the
solution was stirred at 25 °C for 3 h. TLC (Petroleum ether: Ethyl acetate = 0:1) indicated the reaction was completed and one new spot formed. The reaction was clean according to TLC. The
reaction mixture was quenched by the addition of water 5 mL. The organic layer was separated and washed with 1 M aqueous HCl 5 mL, dried over Na2SO4, filtered and concentrated under reduced
pressure to give a residue. Compound N-(3-methoxyphenyl)-3-nitro-benzamide (150 mg, 550.95 µmol, 92.07% yield) was obtained as a yellow solid. Second, a solution of
N-(3-methoxyphenyl)-3-nitro-benzamide (150 mg, 550.95 µmol, 1 eq) in THF (8 mL) was added Pd/C (50 mg, 5% purity) under N2. The suspension was degassed under vacuum and purged with H2
several times. The mixture was stirred under H2 (15 psi) at 25 °C for 2 h. TLC (Petroleum ether/Ethyl acetate = 3:1) showed the starting material was consumed completely. The reaction
mixture was filtered, and the filtrate was concentrated. Compound 3-amino-N-(3-methoxyphenyl) benzamide (100 mg, 412.76 µmol, 74.92% yield) was obtained as a white solid. Finally, to a
solution of 3-amino-N-(3-methoxyphenyl) benzamide (100 mg, 412.76 µmol, 1 eq) in DCM (5 mL) was added DIEA (106.69 mg, 825.52 µmol, 143.79 µL, 2 eq) and 2-chloroacetyl chloride (46.62 mg,
412.76 µmol, 32.83 µL, 1 eq). The mixture was stirred at 0 °C for 1 h. LC-MS showed the reaction was completed, and one main peak with the desired m/z was detected. The reaction mixture was
quenched by the addition of H2O 10 mL, and extracted with DCM 10 mL (5 mL × 2). The combined organic layers were washed with brine 10 mL, dried over Na2SO4, filtered and concentrated under
reduced pressure to give a residue, which was washed by MeCN (10 mL), then filtered to collect the solid. Compound 3-[(2-chloroacetyl)amino]-N-(3-methoxyphenyl) benzamide (50.49 mg, 155.04
µmol, 37.56% yield, 97.879% purity) was obtained as an off-white solid. ESI-MS m/z: calcd for C16H15ClN2O3 318.08, m/z found 319.1 [M + H]+. 1H-NMR (DMSO, 400 MHz): δ ppm 10.50 (br s, 1H),
10.25 (br s, 1H), 8.09 (br s, 1H), 7.82 (br d, _J_ = 8.4 Hz, 1H), 7.66 (br d, _J_ = 7.2 Hz, 1H), 7.54–7.42 (m, 2H), 7.36 (br d, _J_ = 8.0 Hz, 1H), 7.30–7.21 (m, 1H), 6.69 (br d, _J_ = 8.0
Hz, 1H), 4.28 (s, 2H), 3.75 (s, 3H). CTPS1 INHIBITOR TREATMENT AND CELL PROLIFERATION ASSAY KMS-11, KMS-12 and NCI-H929 cell lines were treated with 2 µM of the _CTPS1_ inhibitor for 24, 48,
72 and 96 h. After the indicated times of treatment, cell proliferation was analyzed using the CellTiter 96 Aqueous One Solution Cell Proliferation Assay (Promega, Madison, W) following the
manufacturer’s instructions. This is a colorimetric method for determining the number of viable cells in proliferation. For the assay, 100,000 cells by triplicate were plated in 96 wells
plates after _CTPS1_ inhibitor treatment. Plates were centrifuged at 800×_g_ for 10 min, and the medium was removed. Then, cells were incubated with 100 μL per well of medium and 20 μL per
well of CellTiter 96 Aqueous One Solution reagent. After 1–3 h of incubation at 37 °C, the plates were incubated for 1–4 h, depending on the cell line, at 37 °C in a humidified, 5% CO2
atmosphere. The absorbance was recorded at 490 nm and at 650 nm as a reference wavelength using 96-well plate readers until the absorbance of control cells without treatment was around 0.8.
The background absorbance was measured in wells with only cell line medium and solution reagent. First, the average of the absorbance from the control wells was subtracted from all other
absorbance values. Data were calculated as the percentage of total absorbance of treated cells/absorbance of non-treated cells. CRISPR-CAS9 CTPS1 KNOCKOUT To perform CRISPR-Cas9 experiments,
we first generated three stable Cas9 cell lines: KMS-11, RPMI-8226 and KMS-12, infecting them with lentiviruses carrying the Cas9-2A-Blasticidin expressing cassette (Lenti-Cas9-2A-Blast
plasmid, Addgene #73310) following standard protocol, described before, and selecting them with 17.5 μg/mL blasticidin (Invitrogen) for 7 days. For _CTPS1_ knockout, we designed three
different gRNAs (sgCTPS1-1 F: GCTGATGAAATGGAAAGAGA, sgCTPS1-1 R: TCTCTTTCCATTTCATCAGC; sgCTPS1-3 F: CCTCGAACACCAAATCCTCC, sgCTPS1-3 R: GGAGGATTTGGTGTTCGAGG; sgCTPS1-4 F:
ACTTGGGCTTTCCCCAGATC, sgCTPS1-4 R: GATCTGGGGAAAGCCCAAGT), and we cloned them into CRISPseq-BFP-backbone (Addgene #85707) harboring a BFP reporter gene. Corresponding lentiviruses were
produced for all the constructs and constitutively Cas9 expressing cell lines were infected. BFP+ cells in the case of single gRNAs were determined by flow cytometry (FACS Canto II, BD
Biosciences) 72 h after infection. As a control, cells infected with empty CRISPseq-BFP-backbone were used (scramble, Scr). To assess efficiency in the _CTPS1_ knockout experiment, we
checked _CTPS1_ protein level by western blot 7 days after lentiviruses infection. The detailed gating strategy for flow cytometry is shown in Supplementary Fig. 20a. WESTERN BLOT Cells
protein extracts were obtained by lysis buffer containing 1% Triton X-100, 150 mM NaCl, 50 mM Tris [pH 8], supplemented with 1x protease inhibitor cocktail (Complete Mini, Roche), 10 mM NaF
and 1 mM sodium orthovanadate for 30 min at 4 °C and quantified using BCA (Thermo Fisher Scientific) colorimetric assays. A 30-µg amount of protein was separated on 10% sodium dodecyl
sulfate-polyacrylamide gel electrophoresis and transferred to a nitrocellulose membrane. The membrane, after being blocked with Tropix I-block blocking reagent (Cat No AI300, Tropix) in PBS
with 0.1% Tween 20 and 0.02 NaN3 was incubated with the primary antibody against _CTPS1_ (rabbit polyclonal antibody, Cat No 98287, Cell Signaling) diluted 1:1000 o/n at 4 °C. Bound
antibodies were revealed by a chemiluminescent reagent (Tropix) and visualized using the Chemidoc Imaging Systems (Bio-Rad Laboratories). β-actin was used as a loading control (diluted
1:4000 o/n at 4 °C or for 1 h at room temperature) (Anti-β-actin, A5441; Sigma). CELLS TRANSFECTION Cells were passaged 24 h before nucleofection. The transfection of siRNAs was done with
the Nucleofector II device (Amaxa GmbH, Köln, Germany) following the Amaxa guidelines. Briefly, 1 × 10⁶ of JJN-3 and OPM-2 were resuspended in 100 µL of supplemented culture medium with 100
nM of _UAP1_ siRNAs or Silencer Select Negative Control-1 siRNA (Ambion, Austin, TX) and nucleofected with the Amaxa nucleofector apparatus using programs A-033, A-020 and G-016,
respectively. We used two different siRNAs against _UAP1_ target (siUPA1 A: GUACUUUGGUUUAAAAAAA; siUPA1 B: AGAGCAUUAUGAACAUUAA) to demonstrate that the results obtained with _UAP1_ siRNA
nucleofection are not due to a combination of inconsistent silencing and sequence-specific off-target effects. Silencer Select Negative Control-1 siRNA was used to demonstrate that the
nucleofection did not induce non-specific effects on gene expression. Nucleofection was performed twice with a 24 h interval. After 48 h of the second nucleofection, the _UAP1_ mRNA
expression was analyzed by q-PCR (GUS was employed as the reference gene). Cell proliferation was analyzed 0, 2, 4 and 6 days after two repetitive transfections using the CellTiter 96
Aqueous One Solution Cell Proliferation Assay (Promega, Madison, W) as described above. Transfection efficiency was determined by flow cytometry using the BLOCK IT Fluorescent Oligo
(Invitrogen Life Technologies, Paisley, UK). The detailed gating strategy for flow cytometry is shown in Supplementary Fig. 20b. STATISTICS AND REPRODUCIBILITY Statistical analyses were
performed in R (v4.0.5). Each statistical method used is specified in the “Results” section, including correlation tests for DepMap Analysis, the hypergeometric test for assessing the
association of gene paralogous pairs with synthetic lethality, unpaired one-sided Wilcoxon tests for comparing mean differences of variables without normal distribution and Fisher’s test for
the validation of predicted lethal DKOs with paralogous genes. The number of human samples or cells analyzed in each figure is indicated in their associated legends. For in vitro
experiments, no statistical method was used to predetermine sample size, and no data were excluded from the analyses performed. All experiments and measures were made in triplicate obtaining
in all of the cases similar results. IMPLEMENTATION AND AVAILABILITY gmctool has been developed using R47 and Shiny48. gmctool is hosted using the Amazon Web Services cloud environment
service, and it can be publicly accessed at: https://biotecnun.unav.es/app/gmctool. A full tutorial and example of our own cohort of samples corresponding to B-cell differentiation and MM
can be found on the ‘Help’ tab of gmctool. REPORTING SUMMARY Further information on research design is available in the Nature Portfolio Reporting Summary linked to this article. DATA
AVAILABILITY The authors declare that all data supporting the findings of this study are available within the article, in the supplementary material or in other studies. In addition, the
source data of Figs. 1d, a, b, 4c–f, 5c–e, Supplementary Figs. 4, 5, 7c, 8c, 9c, 10c, 11c, 14, 15, 16c, 17c, 18c and 19 are provided as a Source Data file. Raw data of Fig. 2b, c can be
found in Supplementary Data 1. Referenced accession: B-cell and MM RNA-seq data was obtained from GEO under accession codes GSE15106322,23
[https://www.ncbi.nlm.nih.gov/geo/query/acc.cgi?acc=GSE101063] and GSE11481621 [https://www.ncbi.nlm.nih.gov/geo/query/acc.cgi?acc=GSE114816]. MMRF-CoMMpass data were generated as part of
the Multiple Myeloma Research Foundation Personalized Medicine Initiatives (https://research.themmrf.org and www.themmrf.org). Cancer cell line data, including RNA-seq, proteomics and
large-scale CRISPR genetic screens, was obtained from www.depmap.org11,12 (release 21Q2). Raw data of Figs. 1c, 3c, 4a, b, 5a, b, Supplementary Figs. 7a, b, 8a, b, 9a, b, 10a, b, 11a, b,
16a, b, 17a, b and 18a, b can be found in the referenced accessions detailed above. Exact _p_-values found in panel b of Figs. 4, 5, Supplementary Figs. 7–11, 16–18 can be found in the
Source Data file. Source data are provided with this paper. CODE AVAILABILITY The code for gmctool is available on GitHub (https://github.com/lvalcarcel/gmctool) and Zenodo
(https://doi.org/10.5281/zenodo.13285245)49. Using this tool, it is possible to generate all the results presented in this article. Gene expression data should be a matrix which has genes
(in ENSEMBL annotation) for rows and samples for columns. REFERENCES * Robinson, J. L. et al. An atlas of human metabolism. _Sci. Signal._ 13, 1–12 (2020). Article Google Scholar * Cook,
D. J. & Nielsen, J. Genome-scale metabolic models applied to human health and disease. _Wiley Interdiscip. Rev. Syst. Biol. Med._ 9, e1393 (2017). Article Google Scholar * Lewis, N. E.
& Abdel-Haleem, A. M. The evolution of genome-scale models of cancer metabolism. _Front. Physiol._ 0, 237 (2013). Google Scholar * Ghaffari, P., Mardinoglu, A. & Nielsen, J. Cancer
metabolism: a modeling perspective. _Front. Physiol._ 0, 382 (2015). Google Scholar * Lewis, N. E., Nagarajan, H. & Palsson, B. O. Constraining the metabolic genotype–phenotype
relationship using a phylogeny of in silico methods. _Nat. Rev. Microbiol._ 10, 291–305 (2012). Article CAS PubMed PubMed Central Google Scholar * Tobalina, L., Pey, J., Rezola, A.
& Planes, F. J. Assessment of FBA based gene essentiality analysis in cancer with a fast context-specific network reconstruction method. _PLoS ONE_ 11, e0154583 (2016). Article PubMed
PubMed Central Google Scholar * Folger, O. et al. Predicting selective drug targets in cancer through metabolic networks. _Mol. Syst. Biol._ 7, 501 (2011). Article CAS PubMed PubMed
Central Google Scholar * Apaolaza, I. et al. An in-silico approach to predict and exploit synthetic lethality in cancer metabolism. _Nat. Commun._ 8, 1–9 (2017). Article CAS Google
Scholar * Apaolaza, I., Valcarcel, L. V. & Planes, F. J. GMCS: fast computation of genetic minimal cut sets in large networks. _Bioinformatics_ 35, 535–537 (2019). Article CAS PubMed
Google Scholar * Thiele, I. et al. A community-driven global reconstruction of human metabolism. _Nat. Biotechnol._ 31, 419–425 (2013). Article CAS PubMed Google Scholar * Meyers, R.
M. et al. Computational correction of copy number effect improves specificity of CRISPR-Cas9 essentiality screens in cancer cells. _Nat. Genet._ 49, 1779–1784 (2017). Article CAS PubMed
PubMed Central Google Scholar * Ghandi, M. et al. Next-generation characterization of the Cancer Cell Line Encyclopedia. _Nature_ 569, 503–508 (2019). Article ADS CAS PubMed PubMed
Central Google Scholar * Agren, R. et al. Identification of anticancer drugs for hepatocellular carcinoma through personalized genome-scale metabolic modeling. _Mol. Syst. Biol._ 10, 721
(2014). Article PubMed PubMed Central Google Scholar * Costanzo, M. et al. A global genetic interaction network maps a wiring diagram of cellular function. _Science_ 353, aaf1420 (2016).
Article PubMed PubMed Central Google Scholar * McCall, M. N. et al. The Gene Expression Barcode 3.0: improved data processing and mining tools. _Nucleic Acids Res._ 42, D938–D943
(2014). Article CAS PubMed Google Scholar * Richelle, A., Joshi, C. & Lewis, N. E. Assessing key decisions for transcriptomic data integration in biochemical networks. _PLoS Comput.
Biol._ 15, e1007185 (2019). Article ADS PubMed PubMed Central Google Scholar * Gonatopoulos-Pournatzis, T. et al. Genetic interaction mapping and exon-resolution functional genomics
with a hybrid Cas9-Cas12a platform. _Nat. Biotechnol._ 38, 638–648 (2020). Article CAS PubMed Google Scholar * Thompson, N. A. et al. Combinatorial CRISPR screen identifies fitness
effects of gene paralogues. _Nat. Commun._ 12, 1302 (2021). Article ADS CAS PubMed PubMed Central Google Scholar * De Kegel, B., Quinn, N., Thompson, N. A., Adams, D. J. & Ryan, C.
J. Comprehensive prediction of robust synthetic lethality between paralog pairs in cancer cell lines. _Cell Syst._ 12, 1144–1159.e6 (2021). Article PubMed Google Scholar * Muller, F. L.
et al. Passenger deletions generate therapeutic vulnerabilities in cancer. _Nature_ 488, 337–342 (2012). Article ADS CAS PubMed PubMed Central Google Scholar * Agirre, X. et al. Long
non-coding RNAs discriminate the stages and gene regulatory states of human humoral immune response. _Nat. Commun._ 10, 821 (2019). Article ADS CAS PubMed PubMed Central Google Scholar
* Ordoñez, R. et al. Chromatin activation as a unifying principle underlying pathogenic mechanisms in multiple myeloma. _Genome Res._ 30, 1217–1227 (2020). Article PubMed PubMed Central
Google Scholar * Carrasco-Leon, A. et al. Characterization of complete lncRNAs transcriptome reveals the functional and clinical impact of lncRNAs in multiple myeloma. _Leukemia_ 35,
1438–1450 (2021). Article CAS PubMed PubMed Central Google Scholar * Martin, E. et al. CTP synthase 1 deficiency in humans reveals its central role in lymphocyte proliferation. _Nature_
510, 288–292 (2014). Article ADS CAS PubMed PubMed Central Google Scholar * Lynch, E. M. et al. Structural basis for isoform-specific inhibition of human CTPS1. _Proc. Natl Acad. Sci.
USA_ 118, e2107968118 (2021). Article CAS PubMed PubMed Central Google Scholar * Chiron, D. et al. STP938, a selective CTPS1 inhibitor, shows single agent activity and synergy with
BCL2 inhibition in preclinical models of mantle cell lymphoma. _Blood_ 140, 6014–6015 (2022). Article Google Scholar * Rao, Y. et al. Targeting CTP synthetase 1 to restore interferon
induction and impede nucleotide synthesis in SARS-CoV-2 infection. Preprint at _bioRxiv_ https://doi.org/10.1101/2021.02.05.429959 (2021). * Wu, J. L. et al. O-GlcNAcylation is required for
B cell homeostasis and antibody responses. _Nat. Commun._ 8, 1–10 (2017). Article ADS Google Scholar * Chesi, M. et al. Frequent translocation t(4;14)(p16.3;q32.3) in multiple myeloma is
associated with increased expression and activating mutations of fibroblast growth factor receptor 3. _Nat. Genet._ 16, 260–264 (1997). Article CAS PubMed PubMed Central Google Scholar
* Colaprico, A. et al. TCGAbiolinks: an R/Bioconductor package for integrative analysis of TCGA data. _Nucleic Acids Res._ 44, e71–e71 (2016). Article PubMed Google Scholar * Piao, C. et
al. Inhibition of stearoyl CoA desaturase-1 activity suppresses tumour progression and improves prognosis in human bladder cancer. _J. Cell. Mol. Med._ 23, 2064–2076 (2019). Article CAS
PubMed Google Scholar * Chajès, V., Cambot, M., Moreau, K., Lenoir, G. M. & Joulin, V. Acetyl-CoA carboxylase α is essential to breast cancer cell survival. _Cancer Res._ 66, 5287–5294
(2006). Article PubMed Google Scholar * Li, S. et al. Acetyl-CoA-carboxylase 1-mediated de novo fatty acid synthesis sustains Lgr5+ intestinal stem cell function. _Nat. Commun._ 13, 3998
(2022). Article ADS CAS PubMed PubMed Central Google Scholar * Agren, R. et al. Reconstruction of genome-scale active metabolic networks for 69 human cell types and 16 cancer types
using INIT. _PLoS Comput. Biol._ 8, e1002518 (2012). Article CAS PubMed PubMed Central Google Scholar * Dikicioglu, D., Kırdar, B. & Oliver, S. G. Biomass composition: the “elephant
in the room” of metabolic modelling. _Metabolomics_ 11, 1690–1701 (2015). Article CAS PubMed PubMed Central Google Scholar * Lachance, J. C. et al. BOFdat: generating biomass objective
functions for genome-scale metabolic models from experimental data. _PLoS Comput. Biol._ 15, e1006971 (2019). Article PubMed PubMed Central Google Scholar * Moscardó García, M.,
Pacheco, M., Bintener, T., Presta, L. & Sauter, T. Importance of the biomass formulation for cancer metabolic modeling and drug prediction. _iScience_ 24, 103110 (2021). Article ADS
PubMed PubMed Central Google Scholar * Hernández Patiño, C. E., Jaime-Muñoz, G. & Resendis-Antonio, O. Systems biology of cancer: moving toward the integrative study of the metabolic
alterations in cancer cells. _Front. Physiol._ 3, 481 (2013). Article PubMed PubMed Central Google Scholar * Zielinski, D. C. et al. Systems biology analysis of drivers underlying
hallmarks of cancer cell metabolism. _Sci. Rep._ 7, 1–14 (2017). Article CAS Google Scholar * Hanahan, D. & Weinberg, R. A. Hallmarks of cancer: the next generation. _Cell_ 144,
646–674 (2011). Article CAS PubMed Google Scholar * Pey, J. et al. In-silico gene essentiality analysis of polyamine biosynthesis reveals APRT as a potential target in cancer. _Sci.
Rep._ 7, 1–10 (2017). Article CAS Google Scholar * Duarte, N. C. et al. Global reconstruction of the human metabolic network based on genomic and bibliomic data. _Proc. Natl Acad. Sci.
USA_ 104, 1777–1782 (2007). Article ADS CAS PubMed PubMed Central Google Scholar * Swainston, N. et al. Recon 2.2: from reconstruction to model of human metabolism. _Metabolomics_ 12,
1–7 (2016). Article CAS Google Scholar * Orth, J. D., Thiele, I. & Palsson, B. Ø. What is flux balance analysis? _Nat. Biotechnol._ 28, 245–248 (2010). Article CAS PubMed PubMed
Central Google Scholar * Heirendt, L. et al. Creation and analysis of biochemical constraint-based models using the COBRA Toolbox v.3.0. _Nat. Protoc._ 14, 639–702 (2019). Article CAS
PubMed PubMed Central Google Scholar * Wang, H. et al. RAVEN 2.0: a versatile toolbox for metabolic network reconstruction and a case study on _Streptomyces coelicolor_. _PLoS Comput.
Biol._ 14, 1–17 (2018). Article ADS Google Scholar * R Core Team. R: a language and environment for statistical computing (R Foundation for Statistical Computing, Vienna, Austria, 2021).
https://www.R-project.org/. * Chang, W. et al. shiny: web application framework for R (2021). https://shiny.rstudio.com/, https://shiny.posit.co * Valcarcel, L. V. et al. Scripts and code
for ‘gmctool: automated network-based tool to search for metabolic vulnerabilities in cancer’. _Zenodo_ https://doi.org/10.5281/zenodo.13285245 (2024). Download references ACKNOWLEDGEMENTS
This work was supported by the Minister of Economy and Competitiveness of Spain [PID2019-110344RB-I00 and PID2022-143298OB-I00], PIBA Programme of the Basque Government [PIBA_2020_01_0055],
Elkartek programme of the Basque Government [KK-2020/00008], Fundación Ramon Areces [PREMMAM] to F.J.P.; Instituto de Salud Carlos III (ISCIII) [PI16/02024, PI17/00701, PI19/01352,
PI20/01306], CIBERONC (Co-financed with European Union FEDER funds) [CB16/12/00489], ERANET program ERAPerMed [MEET-AML], MINECO Explora [RTHALMY], Cancer Research UK and AECC under the
Accelerator Award Programme [C355/A26819]. to F.P., Instituto de Salud Carlos III (ISCIII) [FI17/00297] to L.V.V. and Basque Government predoctoral grant [PRE_2021_2_0025] to N.B. AUTHOR
INFORMATION AUTHORS AND AFFILIATIONS * University of Navarra, Tecnun School of Engineering, Manuel de Lardizábal 13, 20018, San Sebastián, Spain Luis V. Valcárcel, Iñigo Apaolaza, Danel
Olaverri-Mendizabal, Naroa Barrena & Francisco J. Planes * Hemato-Oncology Program, Center for Applied Medical Research (CIMA), Universidad de Navarra, IDISNA, CCUN, Avenida Pío XII 55,
31008, Pamplona, Spain Luis V. Valcárcel, Edurne San José-Enériz, Raquel Ordoñez, Ana Valcárcel, Leire Garate, Jesús San Miguel, Antonio Pineda-Lucena, Xabier Agirre & Felipe Prósper *
CIBERONC Centro de Investigación Biomédica en Red de Cáncer, 28029, Madrid, Spain Edurne San José-Enériz, Raquel Ordoñez, Leire Garate, Jesús San Miguel, Antonio Pineda-Lucena, Xabier Agirre
& Felipe Prósper * Departmento de Hematología, Clínica Universidad de Navarra and CCUN, Universidad de Navarra, Avenida Pío XII 36, 31008, Pamplona, Spain Jesús San Miguel & Felipe
Prósper * Biomedical Engineering Center, University of Navarra, 31008, Pamplona, Navarra, Spain Francisco J. Planes * University of Navarra, Instituto de Ciencia de los Datos e Inteligencia
Artificial (DATAI), Campus Universitario, 31008, Pamplona, Spain Francisco J. Planes Authors * Luis V. Valcárcel View author publications You can also search for this author inPubMed Google
Scholar * Edurne San José-Enériz View author publications You can also search for this author inPubMed Google Scholar * Raquel Ordoñez View author publications You can also search for this
author inPubMed Google Scholar * Iñigo Apaolaza View author publications You can also search for this author inPubMed Google Scholar * Danel Olaverri-Mendizabal View author publications You
can also search for this author inPubMed Google Scholar * Naroa Barrena View author publications You can also search for this author inPubMed Google Scholar * Ana Valcárcel View author
publications You can also search for this author inPubMed Google Scholar * Leire Garate View author publications You can also search for this author inPubMed Google Scholar * Jesús San
Miguel View author publications You can also search for this author inPubMed Google Scholar * Antonio Pineda-Lucena View author publications You can also search for this author inPubMed
Google Scholar * Xabier Agirre View author publications You can also search for this author inPubMed Google Scholar * Felipe Prósper View author publications You can also search for this
author inPubMed Google Scholar * Francisco J. Planes View author publications You can also search for this author inPubMed Google Scholar CONTRIBUTIONS X.A., F.P., and F.J.P. conceived this
study. L.V.V., I.A. and F.J.P. developed the conceptual approach, and N.B., D.O. and L.V.V. performed the computational analysis. E.S.J.-E., R.O., A.V., L.G., A.P.-L. and X.A. performed the
experiments. F.P., X.A., E.S.J.-E. and J.S.-M. analyzed and provided access to multiple myeloma data. All authors wrote, read, and approved the manuscript. CORRESPONDING AUTHORS
Correspondence to Felipe Prósper or Francisco J. Planes. ETHICS DECLARATIONS COMPETING INTERESTS The authors declare no competing interests. PEER REVIEW PEER REVIEW INFORMATION _Nature
Communications_ thanks Niels Weinhold and the other anonymous reviewer(s) for their contribution to the peer review of this work. A peer review file is available. ADDITIONAL INFORMATION
PUBLISHER’S NOTE Springer Nature remains neutral with regard to jurisdictional claims in published maps and institutional affiliations. SUPPLEMENTARY INFORMATION SUPPLEMENTARY INFORMATION
PEER REVIEW FILE DESCRIPTION OF ADDITIONAL SUPPLEMENTARY INFORMATION SUPPLEMENTARY DATA 1 SUPPLEMENTARY DATA 2 SUPPLEMENTARY DATA 3 SUPPLEMENTARY DATA 4 SUPPLEMENTARY DATA 5 SUPPLEMENTARY
DATA 6 SUPPLEMENTARY DATA 7 REPORTING SUMMARY SOURCE DATA SOURCE DATA RIGHTS AND PERMISSIONS OPEN ACCESS This article is licensed under a Creative Commons
Attribution-NonCommercial-NoDerivatives 4.0 International License, which permits any non-commercial use, sharing, distribution and reproduction in any medium or format, as long as you give
appropriate credit to the original author(s) and the source, provide a link to the Creative Commons licence, and indicate if you modified the licensed material. You do not have permission
under this licence to share adapted material derived from this article or parts of it. The images or other third party material in this article are included in the article’s Creative Commons
licence, unless indicated otherwise in a credit line to the material. If material is not included in the article’s Creative Commons licence and your intended use is not permitted by
statutory regulation or exceeds the permitted use, you will need to obtain permission directly from the copyright holder. To view a copy of this licence, visit
http://creativecommons.org/licenses/by-nc-nd/4.0/. Reprints and permissions ABOUT THIS ARTICLE CITE THIS ARTICLE Valcárcel, L.V., San José-Enériz, E., Ordoñez, R. _et al._ An automated
network-based tool to search for metabolic vulnerabilities in cancer. _Nat Commun_ 15, 8685 (2024). https://doi.org/10.1038/s41467-024-52725-4 Download citation * Received: 22 June 2022 *
Accepted: 18 September 2024 * Published: 11 October 2024 * DOI: https://doi.org/10.1038/s41467-024-52725-4 SHARE THIS ARTICLE Anyone you share the following link with will be able to read
this content: Get shareable link Sorry, a shareable link is not currently available for this article. Copy to clipboard Provided by the Springer Nature SharedIt content-sharing initiative