- Select a language for the TTS:
- UK English Female
- UK English Male
- US English Female
- US English Male
- Australian Female
- Australian Male
- Language selected: (auto detect) - EN
Play all audios:
ABSTRACT Monitoring real-world battery degradation is crucial for the widespread application of batteries in different scenarios. However, acquiring quantitative degradation information in
operating commercial cells is challenging due to the complex, embedded, and/or qualitative nature of most existing sensing techniques. This process is essentially limited by the type of
signals used for detection. Here, we report the use of effective battery thermal conductivity (_k__eff_) as a quantitative indicator of battery degradation by leveraging the strong
dependence of _k__eff_ on battery-structure changes. A measurement scheme based on attachable thermal-wave sensors is developed for non-embedded detection and quantitative assessment. A
proof-of-concept study of battery degradation during fast charging demonstrates that the amount of lithium plating and electrolyte consumption associated with the side reactions on the
graphite anode and deposited lithium can be quantitatively distinguished using our method. Therefore, this work opens the door to the quantitative evaluation of battery degradation using
simple non-embedded thermal-wave sensors. SIMILAR CONTENT BEING VIEWED BY OTHERS NON-DESTRUCTIVE CHARACTERIZATION TECHNIQUES FOR BATTERY PERFORMANCE AND LIFE-CYCLE ASSESSMENT Article 09 July
2024 _OPERANDO_ ACOUSTIC EMISSION MONITORING OF DEGRADATION PROCESSES IN LITHIUM-ION BATTERIES WITH A HIGH-ENTROPY OXIDE ANODE Article Open access 03 December 2021 WIRELESS TRANSMISSION OF
INTERNAL HAZARD SIGNALS IN LI-ION BATTERIES Article 14 May 2025 INTRODUCTION Rechargeable batteries play an essential role in the ongoing development of renewable energy1,2,3. Battery
operation under certain conditions (e.g., extreme temperatures4 and/or rates5) can cause early degradation and thermal safety issues. Probing and understanding the real-world degradation are
key to the improvement of battery lifetime, safety, and reliability in practical applications. The two main origins of battery degradation are lithium plating and solid-electrolyte
interphase (SEI) growth, which lead to aging phenomena such as the loss of lithium-ion inventory6 and electrolyte dry out7. For example, lithium plating dominates the capacity fade during
battery operation at high rates and/or low temperatures, while high operation temperature accelerates the growth of SEI and the consumption of electrolyte, leading to rapid capacity loss.
Various sensing techniques using different signals (temperature8,9; pressure10; electrochemical11,12, acoustic13,14,15,16, and optical signals17,18,19,20) have been developed to monitor the
internal change and aging of batteries. Among these methods, acoustic and optical sensing techniques have received the most attention because of their capability to detect various types of
degradation21. Acoustic sensing is a highly sensitive nonintrusive technique that relies on the propagation velocity and amplitude attenuation of acoustic waves across the battery. These
features are beneficial for investigating a specific effect in controlled experiments, e.g., electrolyte wetting and drying15. However, the high sensitivity to many coupled
physical–thermal–chemical parameters is unfavorable for distinguishing and quantifying the exact sources in commercial systems. Recently, optical sensors have been used to decipher the
conjoined information, e.g., temperature and pressure can be decoupled using multiple sensors with different sensitivities to these parameters18. Optical sensing provides clear physical,
thermal, and chemical information for battery R&D that was previously inaccessible. Nevertheless, the embedded nature of optical sensors (i.e., the preparation of customized cells)
raises issues for their use in commercial batteries21. The sensor lifetime is far below the cycle life of commercial batteries due to the poor chemical stability of optical fibers in a harsh
corrosive electrochemical environment. The other major concern regarding embedded sensors is their incompatibility with existing battery manufacturing technique and the additional
manufacturing cost4,21. Thus, neither of these sensing techniques can provide long-term monitoring of battery degradation or obtain quantitative chemical information for commercial cells in
complex practical scenarios. To monitor the degradation in real-world systems, an ideal sensing technique should be nonintrusive (i.e., non-embedded) and the signal should be selectively
sensitive to the key parameters related to various types of battery degradation6,7 such as lithium plating, electrolyte dry out, and loss of active material. Recently, we linked the amount
of intercalated lithium ions to the electrode thermal conductivity, which led to the first-time use of embedded thermal-conductivity measurement for spatial mapping of lithium concentration
across battery electrodes22. In this work, we demonstrate a non-embedded thermal-wave sensing technique (also known as 3 omega sensors22) for accurately tracking the evolution of various
degradation sources from the measured effective battery thermal conductivity (_k__eff_). We developed a measurement scheme to calibrate and leverage the quantitative relationship between
_k__eff_ and battery degradation (e.g., Li plating and electrolyte consumption). Simple attachable thermal-wave sensors were fabricated for the _k__eff_ measurement, leading to completely
non-embedded detection. Controlled experiments and in-situ characterization using X-ray tomography were performed to validate our approach. Further, a case study of commercial lithium-ion
batteries (LIBs) during fast charging demonstrates the use of our technique in quantitatively distinguishing the degradation sources. RESULTS AND DISCUSSION THERMAL CONDUCTIVITY OF
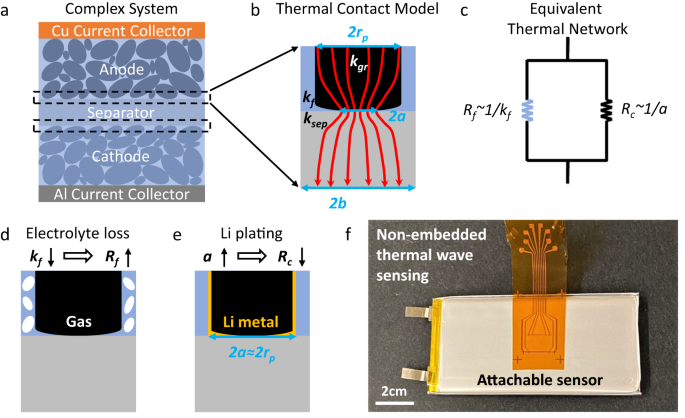
LITHIUM-ION BATTERIES A unit cell of a battery consists of current collectors, a porous separator, and electrodes (Fig. 1a). The total thermal impedance of a unit cell is
\({R}_{{tot}}=\mathop{\sum }\nolimits_{i=1}^{5}\frac{{L}_{i}}{{k}_{L,i}}+{TC}{R}_{{sep}-a}+{TC}{R}_{{sep}-c}\), where _L__i_, _k__L,i_, _TCR__sep-a_, and _TCR__sep-c_ are the thickness and
thermal conductivity of the _i__th_ layer and the thermal contact resistance (_TCR_) between the separator and electrodes (anode and cathode), respectively. The effective battery thermal
conductivity depends on both the layer and interface properties and is given by $${k}_{{eff}}=\mathop{\sum }\limits_{i=1}^{5}{L}_{i}/{R}_{{tot}}.$$ (1) During battery operation, the
components in _k__eff_ that vary as a function of time are 1) the thermal conductivity of the electrodes and separator (_k__L,i_) and 2) _TCR_. Thermal conductivity of the layers: The
thermal conductivities of the collectors are known as they are composed of Al and Cu. For the porous separator and electrode layers, the thermal conductivity is a function of the bulk
porosity and the thermal conductivity of the solid material (_k__s_) and fluid part (_k__f_). The _k__s_ is either known from the literature or can be obtained by measuring the thermal
conductivity of the electrolyte-wetted or dry electrodes and applying effective medium theory (e.g., the Bruggeman model23), as described in Methods. As the changes of the porosity and
_k__s_ are negligible compared to the change of _k__f_, the decrease in the thermal conductivity of the porous layers is dominated by the drop of _k__f_ due to electrolyte dry out (mixture
of liquid and gas), i.e., 0.23 W/m-K for pure electrolyte and 0.025 W/m-K for pure gas. The thermal contact resistance between the separator and electrodes (_TCR_): Physics and the model for
_TCR_ between the solid surface and particles, with interstitial fluid, is very well described in many previous works24,25,26. _TCR_ depends on the thermal conductivity of the solid
particles, fluid, and solid substrate as well as the constriction radius (_a_), as shown in Fig. 1b. Figure 1c shows the thermal-resistance network near the interface. The constriction
radius depends on the particle size of the electrode materials such as NMC or graphite. Because the particle size in real batteries has a wide range (Fig. 1a), the constriction radius will
also vary accordingly. For simplicity, an average constriction radius is used in our thermal model. Details on the calculation of the constriction resistance (_R__c_) can be found in
Methods. Note that _R__c_ varies inversely with the constriction radius (1/_a_). The fluidic resistance near the interface depends on surface porosity, \(1-\pi {r}_{p}^{2}/4{b}^{2}\), where
_b_ represents the average size of an equivalent unit cell near the interface (Fig. 1b). The corresponding thermal resistance (_R__f_) can be given as
\({R}_{f}=\frac{{r}_{p}}{{k}_{f}(4{b}^{2}-\pi {r}_{p}^{2})}\), where _r__p_ is the average electrode particle radius (available from the supplier or can be measured). The two parameters _a_
and _b_ are obtained from a calibration experiment. From the known _a_ and _b_, the _TCR_ can be calculated as \({TCR}=4{b}^{2}/(1/{R}_{c}+1/{R}_{f})\). From the thermal model, the effective
_k__f_ decreases with electrolyte consumption, which will increase _TCR_ and the thermal resistance of the porous layers (Fig. 1d) and thus decrease _k__eff_ (Eq. (1)). In contrast, the
deposition of thermally conductive lithium metal (~85 W/m-K) on anode particles can be approximated as high-thermal-conductivity fillers between the anode and separator (Fig. 1e), which
effectively increases the constriction radius _a_ and reduces _TCR_, causing an increase of _k__eff_. Besides, cycling induced cathode cracking may result in loss of contact inside the
cathode particles, and thus increases thermal constriction resistance and degrades the interfacial thermal transport. However, this effect proved to be weak in our case studies as discussed
later. We speculate that the impact of cathode change could be significant in certain extreme conditions (e.g., severe pulverization) and should be studied in the future. These opposing
trends present an opportunity to quantitatively distinguish the degradation mechanisms (e.g., Li plating and electrolyte consumption) via thermal-conductivity measurement. CALIBRATION AND
VALIDATION OF THE THERMAL MODEL The two fit parameters, _a_ and _b_, were obtained through calibration experiments, which could be obtained from embedded or non-embedded _k__eff_
measurement. For both calibration and validation, analogous to our previous work22, we prepared batteries of single unit cells using NMC/Gr electrodes (see Supplementary Table 1 for material
properties and Supplementary Table 2 for a summary of the thermal properties) with embedded thermal sensors. The sensor fabrication (see Supplementary Fig. 1) and thermal-conductivity
measurement procedure has been detailed in Methods. The calibration consists of measuring _k__eff_ in fully dry and wet conditions, where _k__f_ is known (0.025 W/m-K for gas and 0.23 W/m-K
for the electrolyte), and fitting the measured _k__eff_ vs. _k__f_ to Eq. (1). For the battery considered in this study, these two fit parameters were determined to be _a_/_r__p_ = 0.28 and
_b_/_r__p_ = 1.18 (see raw data and representative fit in Supplementary Fig. 2). The robustness of the thermal model (Eq. 1) with parameters _a_ and _b_ obtained from the calibration
experiments was evaluated by comparing the measured and calculated _k__eff_ associated with different fluid thermal conductivity and lithium coverage. First, we measured _k__eff_ when the
cell was completely wetted using other fluids of different _k__f_, e.g., isopropanol (IPA) with _k__f_ = 0.14 W/m-K and a mixture of IPA:H2O = 1:1 with _k__f_ = 0.35 W/m-K. Figure 2a shows
the good agreement between the measured _k__eff_ and the _k__eff_ calculated using Eq. 1 and a and b obtained from the calibration experiments for a broad range of _k__f_, which proves the
accuracy of our thermal model for different _k__f_. In real LIBs, the calibrated model predicts that _k__eff_ decreases from ~0.4 to ~0.2 W/m-K as _k__f_ decreases due to electrolyte
consumption (Supplementary Fig. 3). As _k__eff_ can be measured from experiments, the effective fluid conductivity (_k__f,eff_) for the corresponding _k__eff_ can be back calculated using
our thermal model (Supplementary Fig. 3). Once _k__f,eff_ is known, the amount of electrolyte consumption (\({\phi }_{{dry}}\)) can be calculated. Because the fluid is a mixture of liquid
and gas bubbles when electrolyte dry out occurs, composite mixing model (Bruggeman model, see Methods) can be used to extract \({\phi }_{{dry}}\) by fitting the model to _k__f,eff_. In
addition, we verified the accuracy of the thermal model in assessing the fraction of anode particles that are covered with Li metal (\({\phi }_{{Li}}\)), as Li plating does not occur
uniformly (Fig. 2b). During battery aging, we assume that _b_ will remain the same as the variation of electrode area with aging is negligible, whereas only _a_ will change with Li plating.
For a surface anode particle covered with Li metal, its constriction radius becomes the same as the particle radius (_a_ = _r__p_), as shown in Fig. 1e. For partial Li deposition coverage
with \({\phi }_{{Li}}\, < \,100\%\) (Fig. 2b), only the surface anode particles covered with Li metal have _a_ = _r__p_, whereas the surface particles without Li plating maintain the same
constriction radius, as determined from calibration experiments. Because the surface anode particles have two different constriction resistances due to partial Li coverage, the thermal
resistance of the unit cell can be split into two parallel paths weighted by \({\phi }_{{Li}}\), i.e., \({R}_{{tot}}^{-1}={{\phi }}_{{Li}}{R}_{{tot},{Li}}^{-1}+(1-{\phi
}_{{Li}}){R}_{{tot},0}^{-1}\), and the effective thermal conductivity of the unit cell (Fig. 1a) becomes \({k}_{{eff}}={\phi }_{{Li}}{k}_{{Li}}+(1-{\phi }_{{Li}}){k}_{0}\), where
_R__tot,Li_, _R__tot,0_, _k__Li_, and _k__0_ are the thermal resistance and conductivity of the region with and without Li deposition, respectively. Note that _k__Li_ and _k__0_ are obtained
using the calibrated thermal model (Eq. (1)) with different constriction radius due to Li plating. Therefore, the lithium coverage (\({\phi }_{{Li}}\)) can be determined using the measured
_k__eff_ and calculated _k__Li_ and _k__0_. To validate the thermal model for Li plating as discussed above, an in-situ cell was built to quantify the lithium coverage using X-ray
microtomography. Supplementary Fig. 4 displays the schematics of our customized polyether ether ketone (PEEK) cell holder and the components inside the cell27,28 (see Methods for details).
After three formation cycles, we charged the cell at 6 C to 50% SOC and 80% SOC with a high cutoff voltage of 4.6 V (Supplementary Fig. 5), which resulted in a sufficient amount of lithium
plating. Correspondingly, we measured the thermal conductivity under the same charge conditions (Supplementary Fig. 6) and back calculated \({\phi }_{{Li}}\) using our thermal model. Note
that the electrolyte consumption effect is assumed to be negligible as the experiments were finished in a few hours. Figure 2c demonstrates the good agreement between the Li coverage
visualized by tomography (Fig. 2d–f) and that estimated using our approach, with a deviation of <5% (4.6% and 1.3%). This validation proves the effectiveness of our method for assessing
the severe coverage of Li metal. DIAGNOSTIC PROTOCOL AND DATA ANALYSIS The calibrated model quantifies the dependence of _k__eff_ on the amount of electrolyte consumption (\({\phi
}_{{dry}}\)) and lithium coverage (\({\phi }_{{Li}}\)), which can be used for battery sensing. Our diagnostic protocol consists of monitoring the evolution of _k__eff_ and extracting the
quantitative degradation information from the measured _k__eff_, as summarized in Fig. 3. For nonembedded _k__eff_ measurement, we fabricated thermal-wave sensors on flexible polyimide
films, which could be easily attached onto the surface of batteries (Fig. 1f). Details on the preparation of the sensors, thermal-conductivity measurement, and analysis can be found in
Methods. The evolution of _k__eff_ was continuously monitored during cycling. We assumed that only one phenomenon (electrolyte consumption or lithium coverage) dominates between two
consecutive measurements, which leads to a conservative estimate of \({\phi }_{{dry}}\) and \({\phi }_{{Li}}\). Apparently, the deviation related to this assumption depends on the capacity
loss (∆Q) or cycle number (N) between the measurements and can be negligible for continuous monitoring with sufficiently small ∆Q and N in between. Figure 3 summarizes the process used to
distinguish and quantify the degradation sources during cycling. The quantitative degradation information was updated after each _k__eff_ measurement for continuous observation until 20%
capacity loss. Comparing the measured _k__eff_ for cycle N and N − 1 (_k__eff,N_ vs. _k__eff,N-1_), the increase of _k__eff_ indicates severe lithium plating, and the coverage of Li can be
quantified. Otherwise, the change is attributed to electrolyte consumption. Further, the exact degradation source can be determined from the monitored \({\Delta \phi }_{{dry}}/\Delta Q\). As
a reference, the rate of electrolyte consumption associated with the SEI growth on graphite, (\({\Delta \phi }_{{dry}}/\Delta Q\))gr, is calibrated with battery operation at slow rates and
early stages where lithium plating rarely occurs. Compared to the reaction on graphite, the growth of the SEI layer on Li metal is much faster due to the poor stability of the SEI and the
high reactivity of Li metal29,30,31. Further, the rate of electrolyte loss due to the reaction between Li metal and the electrolyte reflects the morphology of Li deposition (e.g., dense or
porous Li deposits) as the reaction rate largely depends on the surface area to volume ratios of Li deposits32,33. PROOF-OF-CONCEPT STUDY ON FAST-CHARGING COMMERCIAL LIBS The non-embedded
nature of our attachable thermal-wave sensor is very advantageous for continuous monitoring of cycle-life battery degradation. As a proof of concept, we demonstrate that our attachable
sensor can be used to quantitatively distinguish the degradation sources for fast-charging commercial LIBs. Fast charging can cause lithium plating and early battery degradation due to a
complicated combination of lithium plating and side reactions. Recent studies revealed that lithium plating can be mitigated by charging at an elevated temperature34,35,36,37. However, the
high charging temperature also accelerates the reaction with the electrolyte and may result in rapid electrolyte consumption and, hence, speed up battery degradation. Understanding and
quantifying the exact degradation sources is thus critical for the design of fast-charging strategies. The 3-Ah commercial batteries using the same NMC/Gr electrodes and electrolyte as those
used in the calibration experiments were charged at 6 C to 80% SOC under various thermal conditions, leading to an average charging temperature (\({\bar{T}}_{ch}\)) of 25 °C, 30 °C, and 40
°C, respectively (Supplementary Fig. 7; see Methods for details on the charging protocol). For ensuring the test repeatability, 3 cells were tested for each thermal condition (Supplementary
Fig. 8). Figure 4 summarizes the measurement results of representative cells. The high charging temperature resulted in high coulombic efficiency (CE) and extended cycle life compared with
the lower charging temperatures (Fig. 4a, b). Figure 4c shows the variation of _k__eff_ with capacity loss under distinct thermal conditions. In both the low \({\bar{T}}_{ch}\) cases (i.e.,
25 °C and 30 °C), an increase of _k__eff_ at the initial stage indicates different levels of lithium plating. In contrast, no severe lithium coverage was observed for high
\({\bar{T}}_{ch}\). After this stage, the decrease of _k__eff_ in all cases reveals the consumption of electrolyte with capacity loss. For the two low \({\bar{T}}_{ch}\) cases, such a
decrease does not indicate the disappearance of Li deposition. Instead of increasing the lithium coverage and _k__eff_, Li plating can continue in this stage and tends to appear in the
region where Li deposition already exists based on the classical nucleation theory38. The rapid reaction between the deposited Li metal and electrolyte results in fast electrolyte
consumption, which dominates the observed decrease of _k__eff_ (see Fig. 3 for the process flow). In addition, the measured _k__eff_ can be used to detect cell swelling by comparing the
_k__eff_ with that of dry cells. When _k__eff_ is lower than the dry condition, it reflects the loss of contact inside batteries due to swelling (see Supplementary Fig. 9 for the aged cell
for \({\bar{T}}_{ch}\) = 30 °C). Figure 4d–f summarize the quantitative assessment of degradation sources in representative cells using our approach (see Supplementary Fig. 8 for the
degradation trend observed in all the cells). For the lowest \({\bar{T}}_{ch}\) case, the lithium coverage increases to 32.5% with 7.6% capacity loss. Compared to the calibrated (\({\Delta
\phi }_{{dry}}/\Delta Q\))gr obtained at low C-rate (e.g., 1 C) for electrolyte consumption due to SEI growth on graphite (Supplementary Fig. 10), a combination of SEI growth on graphite and
Li metal results in a higher electrolyte-consumption rate. Note that this rate decreases with the capacity loss due to the continuous growth of SEI and the reduction of exposed surface area
for side reactions. With \({\bar{T}}_{ch}\) = 30 °C, the maximum Li coverage increases to 9.5%. Increasing the charging temperature benefits the mitigation of severe Li deposition. However,
the effective surface area to volume ratio of Li deposits increases as the amount or volume of deposited Li decreases. The higher ratio associated with the mild lithium plating causes the
faster electrolyte consumption due to the larger surface area for the reaction with the electrolyte32,33 compared with the \({\bar{T}}_{ch}\) = 25 °C case (Fig. 4d)). As a result, more
electrolyte is consumed for the same capacity loss (Fig. 4e), resulting in more gas formation and the observed cell swelling (Supplementary Fig. 9). Increasing the charging temperature to 40
°C further reduces the amount of lithium plating, and no clear lithium coverage is observed (Fig. 4f). A comparison with the calibrated (\({\Delta \phi }_{{dry}}/\Delta Q\))gr reveals the
consumption of electrolyte due to a small amount of lithium plating at the initial stage, which is consistent with the relatively low CE in the initial cycles (Fig. 4a). After the initial
stage, the consumption rate decreases with the capacity loss and SEI growth. As a certain amount of electrolyte is consumed (e.g., ~30%), a large lithium concentration gradient is developed
across the electrolyte and electrodes. This can trigger lithium plating and accelerate the electrolyte consumption due to the reaction between Li metal and the electrolyte, as shown in Fig.
4f. This interaction explains the transition of capacity fade from the linear stage to nonlinear regime (Fig. 4b). Further, we disassembled the aged cells in an Ar-filled glovebox and
measured the mass evolution until complete electrolyte evaporation. The \({\phi }_{{dry}}\) can be back calculated from the measured mass difference (see Methods), which verifies the
accuracy of our method in quantifying the amount of electrolyte consumption (Supplementary Table 3). In addition, the level of lithium coverage was qualitatively verified using the images of
aged anodes (Fig. 4g–i and Supplementary Fig. 11). A large portion of the aged anode associated with \({\bar{T}}_{{ch}}\) = 25 °C is covered with shiny Li metal (Fig. 4h), whereas this
effect does not exist for \({\bar{T}}_{{ch}}\) = 40 °C (Fig. 4i). We also performed chemical titration experiments (see Methods) and relaxation voltage analysis to validate the mitigation of
Li plating at high temperatures (Supplementary Table 4 and Supplementary Fig. 12). Besides, the impact of the changes in the cathode on _k__eff_ proved to be trivial in these studies. The
variation of _k__eff_ associated with cathode aging is only 0.57% (Supplementary Fig. 13), which is within the uncertainty of our non-embedded thermal measurement as analyzed below. Thus,
the degradation sources during fast charging at different temperatures are quantitatively distinguished using our measurement scheme, and the accuracy is verified via post-mortem
characterizations. APPLICATION OF THE THERMAL-WAVE SENSOR IN VARIOUS BATTERY TYPES AND OPERATING CONDITIONS In this proof-of-concept study, the efficacy of our sensor and approach was
evaluated using single pouch cells. We further validated the long-term stability of the sensor (Supplementary Fig. 14) and the bonding reliability across a wide temperature range
(Supplementary Fig. 15). As for the detection limit of the sensor, the relative uncertainty of _k__eff_ is ±0.75% based on the measured relative standard deviation of thermal-wave signals
(Supplementary Fig. 16). With the calibrated _k__eff_ vs. \({\phi }_{{dry}}\) and _k__eff_ vs. \({\phi }_{{Li}}\), the sensitivity threshold of our method in measuring \({\phi }_{{dry}}\)
and \({\phi }_{{Li}}\) is estimated to be 1% and 2%, respectively. Further, the sensor and methodology developed here can be applied to various battery types, e.g., prismatic and cylindrical
cells. Since the measurement accuracy relies on the sensitivity to the structural change of unit cells, an essential prerequisite for this approach is that the total thermal resistance of
all unit cells should dominate over that of case, i.e., \({R}_{{uc},{tot}}\gg {R}_{{case}}\). In common commercial cells, this condition can be easily met in different battery formats as the
total thermal resistance of all unit cells (i.e., electrodes, separators, and current collectors) is much higher than that of the case (Supplementary Table 5). In addition, the
frequency-dependent nature of thermal waves allows for controllable penetration depth (see Methods), which is advantageous for the use of our sensor in a battery stack or pack of multiple
cells. By controlling the frequency (_ω_) and penetration depth (\(\propto 1/\sqrt{\omega }\)), thermal waves can be localized near the sensor or extended to the bottom of the single cell or
battery stack. The information of the intermediate battery can be obtained using a sensor attached to its surface, as demonstrated in our case study of the single battery. Noteworthily, we
only detect the signals at precisely the frequency at which we are operating the sensor. Thus, the sensor operation is not influenced by other thermal signals or events when they are at
different frequencies. DISCUSSION Understanding battery degradation typically relies on laboratory-based techniques and/or extremely limited resources at large-scale photon-based user
facilities. However, battery degradation is known to be a complicated phenomenon that depends on many factors such as the electrochemical systems, temperatures, and operating conditions. The
widespread application of batteries in extreme and varying conditions can cause battery degradation and safety issues that are unexpected in the laboratory. Obtaining such quantitative
information using a simple and non-embedded technique is crucial for improving the safety and reliability of batteries in the real world. With the sensor and methodology developed in this
work, we quantified the evolution of lithium coverage and electrolyte consumption during fast charging of commercial batteries under various thermal conditions. At low charging temperatures
(e.g., 25 °C and 30 °C), sluggish kinetics induced lithium plating dominates the initial rapid capacity fade, and the reaction between the Li deposits and electrolyte further accelerates the
aging process. The byproduct of this side reaction could result in cell swelling and safety issues in certain conditions (e.g., 30 °C). Charging at an elevated temperature (e.g., 40 °C)
mitigates the Li plating and extends the fast-charging cycle life. Eventually, the improved performance depends on the rate of electrolyte consumption at high temperatures. As a result of
the increased consumption rate, the insufficient amount of remaining electrolyte causes a large lithium concentration gradient across the electrode during fast charging, which triggers
lithium plating and accelerates the capacity fade. Thus, our operando measurement provides real-time battery status as valuable feedback for battery management in various conditions.
Further, the quantitative assessment of degradation sources could help to guide the design of advanced batteries, e.g., the need of optimal thermal condition and thermally stable electrolyte
for fast-charging batteries. In summary, our non-embedded thermal-wave sensor enables continuous monitoring of real-world battery degradation as well as quantification of the exact
degradation sources. METHODS BRUGGEMAN MODEL For a mixture of two materials, the Bruggeman model23 describes the relationship between the mixture and single-phase property as \({\varphi
}_{1}(\frac{{k}_{1}-{k}_{mix}}{{k}_{1}+2{k}_{mix}})+(1-{\varphi }_{1})(\frac{{k}_{2}-{k}_{mix}}{{k}_{2}+2{k}_{mix}})=0\), where \({\varphi }_{1}\) is the volume fraction of one material and
_k__1_ is the corresponding thermal conductivity. _k__2_ and _k__mix_ are the thermal conductivity of the other material and mixture, respectively. Based on this model, the fourth parameter
can be determined with the other three parameters known or measured. We use the Bruggeman model twice. 1) The model is first used to extract the thermal conductivity of the anode and cathode
solid particles using the experimentally measured thermal conductivity of wet porous electrodes. In this case, _k__mix_ (electrode conductivity), _k__2_ (electrolyte conductivity), and ϕ1
are known due to the known porosity of the electrodes. 2) The model is then used to extract _k__f,eff_ by applying the model to experimentally obtained _k__eff_ from the thermal-wave sensor
during various electrolyte dryout experiments. Once _k__f,eff_ is obtained, this model is applied again to extract the fraction of gas present in the aged cell with electrolyte dry out. In
this case, _k__mix_ is replaced by _k__f,eff_, _k__1_ (i.e., the thermal conductivity of the gas) is known, and _k__2_ (i.e., the thermal conductivity of the electrolyte) is also known.
Thus, _ϕ_ (i.e., the volume fraction of gas) can be calculated. THERMAL CONSTRICTION RESISTANCE We approximate the electrode particles as cylinders of radius _r__p_ and height 2_r__p_. The
thermal interface resistance of the solid (i.e., electrode particles and separator) consists of the thermal constriction resistance due to constriction of conduction areas and the thermal
boundary resistance due to phonon mismatch. The latter term (~10−8 m2K/W39) is negligible compared to _R__c_, i.e., 1/1000 to 1/10 of _R__c_. To calculate the thermal contact resistance,
Cooper et al. 24 proposed the simple formula as \({R}_{c}={\left(1-\frac{a}{{r}_{p}}\right)}^{1.5}/4{k}_{p}a+{\left(1-\frac{a}{b}\right)}^{1.5}/4{k}_{{sep}}a\), where _a_, _b_, _k__p_, and
_k__sep_ are the contact radius, lattice width, particle thermal conductivity, and separator thermal conductivity, respectively. CELL PREPARATION Supplementary Table 1 summarizes the
property information (e.g., thickness, loading, and porosity) of electrodes, separator, and electrolyte used in this study. The electrode area for the sensor-embedded pouch cell is 12 cm2 (3
cm × 4 cm), with embedded-sensors of 150 μm × 4.5 mm. Circular electrodes (area: 1.267 cm2; diameter: 1.27 cm) were used in the in situ cell for X-ray microtomography. For the 3-Ah
commercial cells, the electrode size is 5.1 cm × 10.25 cm (area: 52.275 cm2) and the size of the non-embedded sensor is 300 μm × 9 mm. The volume of added electrolyte is ~1.6 and ~1.2 times
that of the pore volume of the cell components for the customized single-layer cells and the 3-Ah commercial multilayer cells (thickness: 6 mm), respectively. The difference comes from the
large dead volume in the customized cells compared to that in the commercial cells. THERMAL-CONDUCTIVITY MEASUREMENT AND ANALYSIS 100-nm Cr/Au layers were deposited onto thin Kapton films
(25.4 μm) using a shadow mask and CHA e-beam evaporator. The sensors were then bonded with batteries using epoxy (e.g., SU-8 used in our work) for the thermal-conductivity measurement. A
Keithley 6221 AC current source was used to provide the current of frequency _ω_ passing through the sensors and generate the temperature rise of 2_ω_ frequency (_∆T_). The temperature rise
was determined from the corresponding voltage fluctuation of 3_ω_ frequency (_V__3ω_) using an Amtek 7279 Lock-in amplifier. The measurement procedure has been detailed in prior
works40,41,42 and is thus not repeated. Here, we used the low-frequency slope method of 3_ω_ data analysis to determine the battery thermal conductivity, i.e., the slope _∂∆T_/∂_ln_(_ω_) is
inversely proportional to the effective thermal conductivity (_k__eff_). The cross-plane battery thermal conductivity is obtained as \(k={k}_{eff}^{2}/{k}_{in}\), where _k__in_ is the
in-plane battery thermal conductivity. Note that _k__in_ is dominated by the high-thermal-conductivity current collector layers and the change with degradation is negligible, e.g., the
decrease of _k__in_ is less than 0.4% as the battery is fully dried-out. Thus, we use the cross-plane thermal conductivity (i.e., _k_ in the main text) as the indicator of battery
degradation. The low frequency range of interest is estimated based on the cell thickness and thermal penetration depth \(\propto 1/\sqrt{\omega }\), i.e., the penetration depth should be
comparable to the cell thickness. For the 6-mm cells used in this study, the thermal conductivity was extracted using the data in the frequency range of 25 mHz to 0.5 Hz (Supplementary Fig.
16). For consistency, we collected the data when the cell was discharged to the cutoff voltage. In fact, the SOC has a negligible effect on _k_ for battery detection as it is very weak
compared to the degradation effect (Supplementary Fig. 17). IN SITU CELL AND X-RAY MICROTOMOGRAPHY NMC/Gr cells were assembled using a custom cell holder for an in situ study. The main body
of the cell holder was machined from polyether ether ketone (PEEK) for the transmission of X-rays using a design adapted from Ho et al. 27 and Finegan et al. 28. PTFE ferrule was used to
keep the cell airtight. The contact between the cell and stainless-steel pins was adjusted using a hard spring. Electrode property information is summarized in Supplementary Table 1. Before
exposure to the beam, three formation cycles were performed at 0.1 C in the range of 3–4.1 V. After the formation, the cell was charged to 50% and 80% SOC, and the morphology change related
to Li deposition was monitored. X-ray microtomography was performed at beamline 8.3.2 at the Advanced Light Source (ALS) at Lawrence Berkeley National Laboratory. Details on the 3D
reconstructions and visualizations can be found in prior works27,28,43,44,45. CYCLING EXPERIMENTS Commercial 3-Ah LIBs were used in the cycling experiments. According to the manufacturer,
the recommended maximum charge rate is 1 C and the nominal energy density is 180 Wh/kg. The cycle life associated with 20% capacity loss is greater than 500 times. The batteries were charged
to 80% SOC using a standard constant current–constant voltage (CCCV) charge protocol. Charge rates of 1 C and 6 C were used for slow and fast charging, respectively. After a standard 10-min
rest, the cell was discharged at 1 C and then at C/3 with a cutoff voltage. The recommended cutoff voltage for charging and discharging is 4.25 and 2.75 V, respectively. The rest time after
discharge ranges from 15 to 30 min depending on the thermal condition and time required to reach an approximate thermal equilibrium before the next cycle. To monitor the capacity fade, the
capacity is calibrated by C/3 charging and discharging after a certain number of cycles. All the cycling experiments were performed with an 8-channel Arbin Laboratory battery testing system
(LBT21084), and the thermal conditions and temperature were controlled using a TestEquity thermoelectric temperature chamber (TEC1). ESTIMATION OF \({{{{{{\BOLDSYMBOL{\PHI
}}}}}}}_{{{{{{\BOLDSYMBOL{DRY}}}}}}}\) This analysis relies on the volatile nature of EMC solvent in the Gen2 electrolyte, i.e., 1.2 M LiPF6 in EC:EMC (3:7). We disassembled the cells in an
Ar-filled glovebox and recorded the evolution of mass until complete electrolyte evaporation. The mass of evaporated EMC, i.e., remaining EMC in the cell before disassembly
(\({m}_{{EMC}}\)), is known from the mass difference between the initial and final states. With \({m}_{{EMC},0}\) calibrated for the pristine cell and \({m}_{{EMC},1}\) measured for the aged
cell, the mass of consumed EMC in the aged cell is given by \(({m}_{{EMC},0}-{m}_{{EMC},1})\). The consumption of EMC by volume is calculated based on the ratio of EC and EMC in the
electrolyte. The range of electrolyte consumption can be further estimated by assuming 0 to 100% consumption of EC, which explains the relatively large uncertainty of \({\phi }_{{dry}}\)
calculated from the mass difference (Supplementary Table 3). Note that the \({\phi }_{{dry}}\) measured using our method is within this uncertainty range, with a relative deviation of 4.52%
and 2.41%, respectively. TITRATION MASS SPECTROMETRY The fully discharged 3-Ah pouch cells were disassembled in an Ar-filled glovebox. The graphite electrodes were cut into 16 cm2 pieces,
rinsed with dimethyl carbonate (Gotion), and dried under vacuum at room temperature to remove the residual electrolyte from the surface and the pores. Then, the dried graphite electrode was
placed into a custom-made three-neck glass vessel46. The vessel was attached to the mass spectrometry apparatus and purged with continuous Ar to remove any residual contaminants inside the
vessel and the line. When the mass spectrometer stabilized, 3.5 M H2SO4 was injected through the injection port by using a gas-tight syringe (VICI, Series C syringe with Pressure-Lok side
port needle). The gas was accumulated into the 2 mL sample loop and sampled every 4 min. H2SO4 reacts with dead Li and lithiated graphite (LixC6), solid carbonates species, and lithium
acetylide, and evolves H2, CO2, and C2H247,48, respectively. Evolved gases (H2, CO2, and C2H2) were quantified with the calibrated data based on the mass spectrometer ion current, and the
total amounts of Li-containing species were determined, as summarized in Supplementary Table 4. DATA AVAILABILITY The data supporting the findings of this study are available from the
corresponding author on reasonable request, and are provided in the Supplementary Code. CODE AVAILABILITY The code used in this study can be downloaded from Supplementary Code. REFERENCES *
Davies, D. M. et al. Combined economic and technological evaluation of battery energy storage for grid applications. _Nat. Energy_ 4, 42–50 (2019). Article ADS Google Scholar * Dunn, B.,
Kamath, H. & Tarascon, J. M. Electrical energy storage for the grid: a battery of choices. _Science_ 334, 928–935 (2011). Article ADS CAS PubMed Google Scholar * Grey, C. P. &
Tarascon, J. M. Sustainability and in situ monitoring in battery development. _Nat. Mater._ 16, 45–56 (2016). Article ADS CAS PubMed Google Scholar * Zeng, Y., Chalise, D., Lubner, S.
D., Kaur, S. & Prasher, R. S. A review of thermal physics and management inside lithium-ion batteries for high energy density and fast charging. _Energy Storage Mater._ 41, 264–288
(2021). Article Google Scholar * Keyser, M. et al. Enabling fast charging – battery thermal considerations. _J. Power Sources_ 367, 228–236 (2017). Article ADS CAS Google Scholar *
Birkl, C. R., Roberts, M. R., McTurk, E., Bruce, P. G. & Howey, D. A. Degradation diagnostics for lithium ion cells. _J. Power Sources_ 341, 373–386 (2017). Article ADS CAS Google
Scholar * Palacín, M. R. & De Guibert, A. Batteries: why do batteries fail? _Science_ 351, 1253292 (2016). Article PubMed Google Scholar * Mutyala, M. S. K. et al. In-situ
temperature measurement in lithium ion battery by transferable flexible thin film thermocouples. _J. Power Sources_ 260, 43–49 (2014). Article ADS CAS Google Scholar * Raijmakers, L. H.
J., Danilov, D. L., Eichel, R.-A. & Notten, P. H. L. A review on various temperature-indication methods for Li-ion batteries. _Appl. Energy_ 240, 918–945 (2019). Article CAS Google
Scholar * Louli, A. J., Ellis, L. D. & Dahn, J. R. Operando pressure measurements reveal solid electrolyte interphase growth to rank li-ion cell performance. _Joule_ 3, 745–761 (2019).
Article CAS Google Scholar * Andre, D. et al. Characterization of high-power lithium-ion batteries by electrochemical impedance spectroscopy. I. Experimental investigation. _J. Power
Sources_ 196, 5334–5341 (2011). Article ADS CAS Google Scholar * Iurilli, P., Brivio, C. & Wood, V. On the use of electrochemical impedance spectroscopy to characterize and model the
aging phenomena of lithium-ion batteries: a critical review. _J. Power Sources_ 505, 229860 (2021). Article CAS Google Scholar * Hsieh, A. G. et al. Electrochemical-acoustic time of
flight: In operando correlation of physical dynamics with battery charge and health. _Energy Environ. Sci._ 8, 1569–1577 (2015). Article CAS Google Scholar * Bommier, C. et al. In
operando acoustic detection of lithium metal plating in commercial LiCoO2/graphite pouch cells. _Cell Rep. Phys. Sci._ 1, 100035 (2020). Article Google Scholar * Deng, Z. et al. Ultrasonic
scanning to observe wetting and “unwetting” in li-ion pouch cells. _Joule_ 4, 2017–2029 (2020). Article CAS Google Scholar * Chang, W. & Steingart, D. Operando 2D acoustic
characterization of lithium-ion battery spatial dynamics. _ACS Energy Lett._ 6, 2960–2968 (2021). Article CAS Google Scholar * Yang, G., Leitão, C., Li, Y., Pinto, J. & Jiang, X.
Real-time temperature measurement with fiber Bragg sensors in lithium batteries for safety usage. _Meas. J. Int. Meas. Confed._ 46, 3166–3172 (2013). Article Google Scholar * Huang, J. et
al. Operando decoding of chemical and thermal events in commercial Na(Li)-ion cells via optical sensors. _Nat. Energy_ 5, 674–683 (2020). Article ADS MathSciNet CAS Google Scholar *
Gervillié-Mouravieff, C. et al. Unlocking cell chemistry evolution with operando fibre optic infrared spectroscopy in commercial Na(Li)-ion batteries. _Nat. Energy_ 7, 1157–1169 (2022).
Article ADS Google Scholar * Gao, T. et al. Interplay of lithium intercalation and plating on a single graphite particle. _Joule_ 5, 393–414 (2021). Article CAS Google Scholar * Huang,
J., Boles, S. T. & Tarascon, J.-M. Sensing as the key to battery lifetime and sustainability. _Nat. Sustain_ 5, 194–204 (2022). Article Google Scholar * Zeng, Y. et al. Operando
spatial mapping of lithium concentration using thermal-wave sensing. _Joule_ 5, 2195–2210 (2021). Article CAS Google Scholar * Bruggeman, D. A. G. Berechnung verschiedener physikalischer
Konstanten von heterogenen Substanzen. III. Die elastischen Konstanten der quasiisotropen Mischkörper aus isotropen Substanzen. _Ann. Phys._ 421, 160–178 (1937). Article Google Scholar *
Cooper, M. G., Mikic, B. B. & Yovanovich, M. M. Thermal contact conductance. _Int. J. Heat. Mass Transf._ 12, 279–300 (1969). Article Google Scholar * Prasher, R. S. & Phelan, P.
E. Microscopic and macroscopic thermal contact resistances of pressed mechanical contacts. _J. Appl. Phys_. 100, 063538 (2006). * Lubner, S. D., Kaur, S., Fu, Y., Battaglia, V. &
Prasher, R. S. Identification and characterization of the dominant thermal resistance in lithium-ion batteries using operando 3-omega sensors. _J. Appl. Phys._ 127, 105104 (2020). Article
ADS CAS Google Scholar * Ho, A. S. et al. 3D detection of lithiation and lithium plating in graphite anodes during fast charging. _ACS Nano_ 15, 10480–10487 (2021). Article CAS PubMed
Google Scholar * Finegan, D. P. et al. Spatially resolving lithiation in silicon-graphite composite electrodes via in situ high-energy X-ray diffraction computed tomography. _Nano Lett._
19, 3811–3820 (2019). Article ADS CAS PubMed Google Scholar * Heiskanen, S. K., Kim, J. & Lucht, B. L. Generation and evolution of the solid electrolyte interphase of lithium-ion
batteries. _Joule_ 3, 2322–2333 (2019). Article CAS Google Scholar * Lin, D., Liu, Y. & Cui, Y. Reviving the lithium metal anode for high-energy batteries. _Nat. Nanotechnol._ 12,
194–206 (2017). Article ADS CAS PubMed Google Scholar * Cheng, X. B. et al. A review of solid electrolyte interphases on lithium metal anode. _Adv. Sci._ 3, 1–20 (2015). ADS Google
Scholar * He, X. et al. The passivity of lithium electrodes in liquid electrolytes for secondary batteries. _Nat. Rev. Mater._ 6, 1036–1052 (2021). Article ADS CAS Google Scholar *
Boyle, D. T. et al. Corrosion of lithium metal anodes during calendar ageing and its microscopic origins. _Nat. Energy_ 6, 487–494 (2021). Article ADS CAS Google Scholar * Yang, X. G. et
al. Asymmetric temperature modulation for extreme fast charging of lithium-ion batteries. _Joule_ 3, 3002–3019 (2019). Article CAS Google Scholar * Liu, Y., Zhu, Y. & Cui, Y.
Challenges and opportunities towards fast-charging battery materials. _Nat. Energy_ 4, 540–550 (2019). Article ADS Google Scholar * Yang, X. G., Liu, T. & Wang, C. Y. Thermally
modulated lithium iron phosphate batteries for mass-market electric vehicles. _Nat. Energy_ 6, 176–185 (2021). Article ADS CAS Google Scholar * Zeng, Y. et al. Extreme fast charging of
commercial Li-ion batteries via combined thermal switching and self-heating approaches. _Nat. Commun._ 14, 1–9 (2023). Article ADS CAS Google Scholar * Kalikmanov, V. I. Classical
nucleation theory. _Nucleation Theory._ 17–41, https://doi.org/10.1007/978-90-481-3643-8_3 (2013). * Monachon, C., Weber, L. & Dames, C. Thermal boundary conductance: a materials science
perspective. _Annu. Rev. Mater. Res._ 46, 433–463 (2016). Article ADS CAS Google Scholar * Cahill, D. G. Thermal conductivity measurement from 30 to 750 K: The 3ω method. _Rev. Sci.
Instrum._ 61, 802–808 (1990). Article ADS CAS Google Scholar * Borca-Tasciuc, T., Kumar, A. R. & Chen, G. Data reduction in 3ω method for thin-film thermal conductivity
determination. _Rev. Sci. Instrum._ 72, 2139–2147 (2001). Article ADS CAS Google Scholar * Dames, C. & Chen, G. 1Ω, 2Ω, and 3Ω methods for measurements of thermal properties. _Rev.
Sci. Instrum._ 76, 1–14 (2005). Article Google Scholar * Pietsch, P. et al. Quantifying microstructural dynamics and electrochemical activity of graphite and silicon-graphite lithium ion
battery anodes. _Nat. Commun._ 7, 1–11 (2016). Article Google Scholar * Finegan, D. P. et al. Quantifying bulk electrode strain and material displacement within lithium batteries via
high-speed operando tomography and digital volume correlation. _Adv. Sci._ 3, 1–11 (2015). Google Scholar * Shen, F., Jonson, R. A., Parkinson, D. Y. & Tucker, M. C. Preparing Li-garnet
electrodes with engineered structures by phase inversion and high shear compaction processes. _J. Am. Ceram. Soc._ 105, 90–98 (2022). Article CAS Google Scholar * Huang, T. Y. et al.
Quantitative decoupling of oxygen-redox and manganese-redox voltage hysteresis in a cation-disordered rock salt cathode. _Adv. Energy Mater._ 13, 1–14 (2023). Article Google Scholar *
McShane, E. J. et al. Quantification of inactive lithium and solid-electrolyte interphase species on graphite electrodes after fast charging. _ACS Energy Lett._ 5, 2045–2051 (2020). Article
CAS Google Scholar * McShane, E. J. et al. Multimodal quantification of degradation pathways during extreme fast charging of lithium-ion batteries. _J. Mater. Chem. A_ 367, 23927–23939
(2022). Article Google Scholar Download references ACKNOWLEDGEMENTS The authors acknowledge the support received from the Energy Efficiency and Renewable Energy, Vehicle Technologies
Program, of the US Department of Energy under contract no. DEAC0205CH11231 (R.P.). This work used beamline 8.3.2 at ALS, a DOE Office of Science User Facility under contract no.
DEAC0205CH11231 (M.C.T.). The authors thank Dr. Dilworth Y. Parkinson for help on tomography data collection. AUTHOR INFORMATION AUTHORS AND AFFILIATIONS * School of Microelectronics,
Southern University of Science and Technology, Shenzhen, 518055, China Yuqiang Zeng * Energy Storage and Distributed Resources Division, Lawrence Berkeley National Laboratory, Berkeley, CA,
94720, USA Yuqiang Zeng, Fengyu Shen, Buyi Zhang, Jaeheon Lee, Divya Chalise, Qiye Zheng, Yanbao Fu, Sumanjeet Kaur, Sean D. Lubner, Vincent S. Battaglia, Bryan D. McCloskey, Michael C.
Tucker & Ravi S. Prasher * Department of Mechanical Engineering, University of California, Berkeley, CA, 94720, USA Buyi Zhang, Divya Chalise & Ravi S. Prasher * Department of
Chemical and Biomolecular Engineering, University of California, Berkeley, CA, 94720, USA Jaeheon Lee & Bryan D. McCloskey * Mechanical and Aerospace Engineering Department, The Hong
Kong University of Science and Technology, Hong Kong, China Qiye Zheng Authors * Yuqiang Zeng View author publications You can also search for this author inPubMed Google Scholar * Fengyu
Shen View author publications You can also search for this author inPubMed Google Scholar * Buyi Zhang View author publications You can also search for this author inPubMed Google Scholar *
Jaeheon Lee View author publications You can also search for this author inPubMed Google Scholar * Divya Chalise View author publications You can also search for this author inPubMed Google
Scholar * Qiye Zheng View author publications You can also search for this author inPubMed Google Scholar * Yanbao Fu View author publications You can also search for this author inPubMed
Google Scholar * Sumanjeet Kaur View author publications You can also search for this author inPubMed Google Scholar * Sean D. Lubner View author publications You can also search for this
author inPubMed Google Scholar * Vincent S. Battaglia View author publications You can also search for this author inPubMed Google Scholar * Bryan D. McCloskey View author publications You
can also search for this author inPubMed Google Scholar * Michael C. Tucker View author publications You can also search for this author inPubMed Google Scholar * Ravi S. Prasher View author
publications You can also search for this author inPubMed Google Scholar CONTRIBUTIONS Y.Z. and R.P. conceived the idea. Y.Z. developed the methodology and conducted the cycling
experiments. F.S., B.Z., J.L., Y.Z., B.D.M. and M.C.T. performed the postmortem characterization. Y.Z., D.C., Q.Z., Y.F., S.K., S.D.L. and V.B. contributed to the sensor design and
fabrication. Y.Z. and R.P. wrote the manuscript with feedback from all the authors. CORRESPONDING AUTHOR Correspondence to Ravi S. Prasher. ETHICS DECLARATIONS COMPETING INTERESTS The
authors declare no competing interests. PEER REVIEW PEER REVIEW INFORMATION _Nature Communications_ thanks Hong Yuan, Maha Yusuf and the other, anonymous, reviewer for their contribution to
the peer review of this work. A peer review file is available. ADDITIONAL INFORMATION PUBLISHER’S NOTE Springer Nature remains neutral with regard to jurisdictional claims in published maps
and institutional affiliations. SUPPLEMENTARY INFORMATION SUPPLEMENTARY INFORMATION PEER REVIEW FILE DESCRIPTION OF ADDITIONAL SUPPLEMENTARY FILES SUPPLEMENTARY CODE RIGHTS AND PERMISSIONS
OPEN ACCESS This article is licensed under a Creative Commons Attribution 4.0 International License, which permits use, sharing, adaptation, distribution and reproduction in any medium or
format, as long as you give appropriate credit to the original author(s) and the source, provide a link to the Creative Commons licence, and indicate if changes were made. The images or
other third party material in this article are included in the article’s Creative Commons licence, unless indicated otherwise in a credit line to the material. If material is not included in
the article’s Creative Commons licence and your intended use is not permitted by statutory regulation or exceeds the permitted use, you will need to obtain permission directly from the
copyright holder. To view a copy of this licence, visit http://creativecommons.org/licenses/by/4.0/. Reprints and permissions ABOUT THIS ARTICLE CITE THIS ARTICLE Zeng, Y., Shen, F., Zhang,
B. _et al._ Nonintrusive thermal-wave sensor for operando quantification of degradation in commercial batteries. _Nat Commun_ 14, 8203 (2023). https://doi.org/10.1038/s41467-023-43808-9
Download citation * Received: 29 June 2023 * Accepted: 21 November 2023 * Published: 11 December 2023 * DOI: https://doi.org/10.1038/s41467-023-43808-9 SHARE THIS ARTICLE Anyone you share
the following link with will be able to read this content: Get shareable link Sorry, a shareable link is not currently available for this article. Copy to clipboard Provided by the Springer
Nature SharedIt content-sharing initiative