- Select a language for the TTS:
- UK English Female
- UK English Male
- US English Female
- US English Male
- Australian Female
- Australian Male
- Language selected: (auto detect) - EN
Play all audios:
ABSTRACT Extracellular matrix (ECM) deposition after central nervous system (CNS) injury leads to inhibitory scarring in humans and other mammals, whereas it facilitates axon regeneration in
the zebrafish. However, the molecular basis of these different fates is not understood. Here, we identify small leucine-rich proteoglycans (SLRPs) as a contributing factor to regeneration
failure in mammals. We demonstrate that the SLRPs chondroadherin, fibromodulin, lumican, and prolargin are enriched in rodent and human but not zebrafish CNS lesions. Targeting SLRPs to the
zebrafish injury ECM inhibits axon regeneration and functional recovery. Mechanistically, we find that SLRPs confer mechano-structural properties to the lesion environment that are adverse
to axon growth. Our study reveals SLRPs as inhibitory ECM factors that impair axon regeneration by modifying tissue mechanics and structure, and identifies their enrichment as a feature of
human brain and spinal cord lesions. These findings imply that SLRPs may be targets for therapeutic strategies to promote CNS regeneration. SIMILAR CONTENT BEING VIEWED BY OTHERS CHONDROITIN
SULFATE PROTEOGLYCANS PREVENT IMMUNE CELL PHENOTYPIC CONVERSION AND INFLAMMATION RESOLUTION VIA TLR4 IN RODENT MODELS OF SPINAL CORD INJURY Article Open access 25 May 2022 SPINAL CORD
REPAIR IS MODULATED BY THE NEUROGENIC FACTOR HB-EGF UNDER DIRECTION OF A REGENERATION-ASSOCIATED ENHANCER Article Open access 11 August 2023 SINGLE-CELL ANALYSIS OF INNATE SPINAL CORD
REGENERATION IDENTIFIES INTERSECTING MODES OF NEURONAL REPAIR Article Open access 15 August 2024 INTRODUCTION The ability to regenerate long-distance axonal connections after central nervous
system (CNS) injury differs significantly among vertebrates. Why certain species, such as zebrafish, possess a high regenerative capacity but not others is poorly understood1. Fibrous scar
formation is considered to be a major factor in limiting axon regeneration in the adult mammalian CNS2. Several scar components, such as myelin-associated factors, basal lamina components,
and high molecular weight chondroitin sulfate proteoglycans (CSPGs), have been identified as inhibitors of axonal regrowth through mechanisms including growth cone collapse, repellence or
entrapment, and prevention of inflammation resolution3,4,5. However, removing these extracellular matrix (ECM) factors results in only modest regeneration, suggesting that critical molecules
and mechanisms contributing to regeneration failure remain to be discovered6,7,8. The CNS scar may inhibit axon growth not only through its biochemical composition but also by changes in
local mechanical properties of the microenvironment, such as elasticity and viscosity9,10,11,12. However, in vivo evidence for a causal relationship between scar tissue mechanics and
regenerative success is lacking. Moreover, molecular factors that influence the mechanical properties of CNS scars have not been identified. Unlike humans and other mammals, zebrafish
establish an axon growth-conducive ECM after CNS injury, leading to recovery of swimming function both at larval and adult stages13,14,15,16,17. It remains obscure as to why
injury-associated ECM deposits inhibit axon regeneration in the mammalian CNS but not in zebrafish. Here, we identify small leucine-rich proteoglycans (SLRPs) as ECM factors which drive CNS
healing toward inhibitory scarring. We demonstrate that the SLRPs chondroadherin, fibromodulin, lumican, and prolargin are enriched in human and rodent but not zebrafish CNS lesions.
Increasing the abundance of SLRPs in the zebrafish injury ECM inhibits axon regeneration and functional recovery. Mechanistically, we find that SLRPs confer mechano-structural properties to
the lesion environment that render it adverse to axon growth. Our data identify SLRPs as inhibitory ECM factors that impair axon regeneration by altering tissue mechanics and structure, and
reveal their enrichment as a feature of human CNS lesions. Targeting SLRPs therefore presents itself as a potential therapeutic strategy to promote axon growth across CNS lesions. RESULTS
MATRISOME DYNAMICS OF ZEBRAFISH SPINAL CORD REGENERATION In order to identify factors that confer axon growth-limiting properties to CNS scars by altering tissue mechanics, we first set out
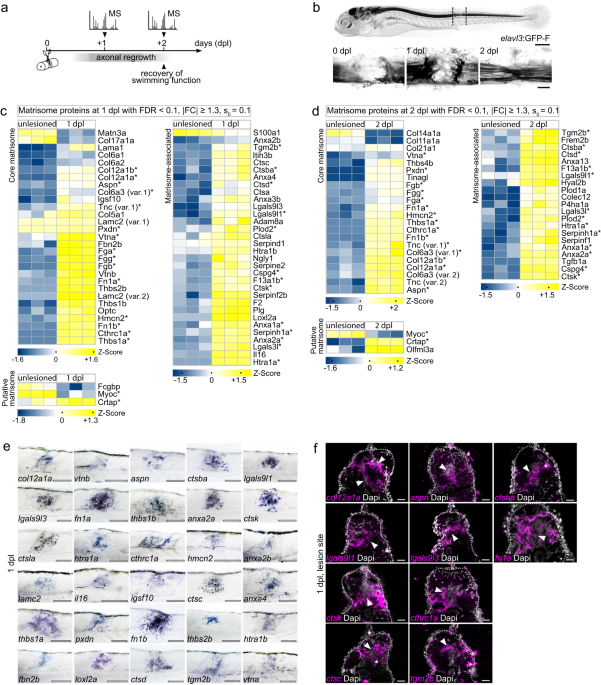
to map the changes in ECM composition in a regeneration context. To that aim, we applied label-free mass spectrometry (MS)-based quantitative proteomics to a larval zebrafish spinal cord
injury (SCI) model. In this injury paradigm, the spinal cord is completely transected, which allows axon regeneration across an ECM-rich, non-neural lesion environment and recovery of
swimming function within two days post-lesion (dpl; Fig. 1a, b)14,18. Proteomic profiling of trunk tissue containing the lesion site at 1 dpl and 2 dpl as well as corresponding age-matched
unlesioned control tissue identified 4782 unique proteins after quality control (Supplementary Fig. 1a, b). Differential abundance analysis (FDR < 0.1, | FC | ≥ 1.3, s0 = 0.1) revealed
910 proteins whose abundance was altered in 1 dpl compared to unlesioned control samples (573 up- and 337 down-regulated; Supplementary Fig. 1c, e). The abundance of 656 proteins differed
between 2 dpl and unlesioned control samples (443 up- and 213 down-regulated; Supplementary Fig. 1d, f). Reactome analysis of enriched proteins resulted in several ECM-associated terms being
overrepresented at 1 dpl and 2 dpl (Supplementary Fig. 1g, h). We thus examined the matrisome, which can be subdivided into core matrisome (glycoproteins, collagens, proteoglycans),
matrisome-associated (ECM affiliated proteins, ECM regulators, secreted factors), and putative matrisome proteins (Fig. 1c, d)19. Among the matrisome proteins which exhibited a high
abundance at 1 dpl were several proteins that have previously been reported to show increased expression after SCI in zebrafish, including Aspn, Cthrc1a, Col5a1, Col6a2, Col12a1a, Col12a1b,
Fn1a, Fn1b, Tnc, and Thbs2b13,14,15,20. In addition, we identified immune system-related factors, such as cathepsins, serpins, galectins, and interleukins, which is consistent with the
critical role of injury-activated macrophages at this stage of regeneration21,22. At 2 dpl, the number of matrisome proteins exhibiting an altered abundance decreased by 28%, compared to 1
dpl. Comparing differentially regulated proteins across time points showed that 30 such matrisome proteins were common to 1 dpl and 2 dpl (asterisks in Fig. 1c, d), including proteins
previously implicated in axon growth promotion or guidance: Col12a1a, Col12a1b, Fn1a, Fn1b, Tnc, Cthrc1a, and Thbs1a13,14,20,23,24,25,26,27,28,29. 34 proteins with altered abundance were
unique to 1 dpl, and 16 proteins to 2 dpl. Among the uniquely differentially regulated matrisome proteins at 1 dpl, we identified nine immune system-related and coagulation factors (Ctsa,
Ctsla, Ctsc, F2, Il16, Lgals9l3, Plg, Serpinf2b, Serpine2), consistent with the initial blood clotting reaction and transient proinflammatory phase after SCI in zebrafish21,30. To further
validate our MS results, we examined whether changes in mRNA levels accompanied the alterations in protein abundance. We performed in situ hybridization (ISH) to analyze the expression of
genes coding for 30 differentially regulated matrisome proteins which exhibited high abundance at 1 dpl. Transcripts of all analyzed genes were locally upregulated in the lesion site
compared to both adjacent unlesioned trunk tissue and unlesioned age-matched controls (Fig. 1e; Supplementary Fig. 1i). Furthermore, fluorescence ISH on tissue sections for 10 selected genes
confirmed transcript induction in the spinal cord stump, its immediate vicinity, or the highly disorganized lesion core (Fig. 1f). This reinforces the findings of our proteomics profiling.
Collectively, these data identify the dynamics of the matrisome landscape after SCI in a vertebrate species, which exhibits a high regenerative capacity for the CNS. DISTINCT MATRISOME
SIGNATURES AFTER SCI IN RODENTS AND ZEBRAFISH To identify interspecies differences in the ECM composition that could account for the ability of severed axons to regrow after CNS injury, we
compared the zebrafish proteomics dataset with that of adult Sprague-Dawley rats at seven days post-contusion SCI31. We first screened for matrisome proteins that were enriched in the
zebrafish lesion site (FDR < 0.1, FC ≥ 1.3) but down-regulated or not significantly regulated after SCI in rat (FDR < 0.1, FC ≤ −1.3 | n.s.). This identified four proteins
(Supplementary Fig. 2a). By contrast, 61 matrisome proteins were down-regulated or not significantly regulated after SCI in zebrafish (FDR < 0.1, FC ≤ −1.3 | n.s.) but enriched in the rat
lesion site (FDR < 0.1, FC ≥ 1.3) (Fig. 2a). This suggests that the regeneration-permissive properties of the zebrafish injury ECM can be attributed to the absence of axon
growth-limiting components rather than the presence of species-specific growth-promoting factors. Indeed, among the differentially regulated matrisome proteins that showed low abundance in
the zebrafish spinal lesion site were the neurite growth-inhibitory factors neurocan and 16 components of the basal lamina (including type IV collagens, laminins, nidogens, heparan sulfate
proteoglycans, Fbln1, Sparc)4,32,33. Quantitative RT-PCR (qRT-PCR) confirmed that the expression of _ncanb_ and basal lamina components was not upregulated in the zebrafish spinal lesion
site at 1 dpl (Supplementary Fig. 2b). Similarly, anti-Col IV immunoreactivity was not locally increased at 1 dpl (Supplementary Fig. 2c). Thus, the CSPG neurocan and basal lamina networks
are not principal constituents of the zebrafish injury ECM. These data demonstrate the value of cross-species comparative approaches in identifying inhibitory components of the mammalian
injury ECM. The comparative dataset further revealed seven members of the highly conserved small leucine-rich proteoglycan (SLRP) family to be enriched in the rat spinal lesion site but
down-regulated or not significantly regulated after SCI in zebrafish, namely chondroadherin (Chad), lumican (Lum), osteoglycin (Ogna), decorin (Dcn), fibromodulin (Fmoda, Fmodb), and
prolargin (Prelp) (Fig. 2a). Assessment of additional proteomics profiles showed comparable enrichment of these SLRPs in rats at seven days and eight weeks post-contusion SCI (Supplementary
Fig. 2d)31,34,35. Interestingly, asporin (Aspn) was the only SLRP family member which exhibited an increased abundance after SCI in both rat and zebrafish (Supplementary Fig. 2d). To
ascertain whether the low protein abundance of SLRPs in the zebrafish spinal lesion site is also reflected at the transcriptional level, we performed qRT-PCR. This revealed that with the
exception of _aspn_, expression of all 21 SLRPs present in the zebrafish genome was not increased at 1 dpl as compared to unlesioned controls (Fig. 2b; Supplementary Fig. 2e). Average fold
changes of _aspn_, _chad_, _dcn_, _fmoda_, _fmodb, lum_, _ogna_, and _prelp_, as determined by qRT-PCR, correlated with the MS data (Pearson correlation, _R__2_ = 0.9443), thus further
validating our proteomics profile (Supplementary Fig. 2f). Additionally, ISH showed upregulation of _aspn_ transcripts in the lesion site at 1 dpl while _chad_, _dcn_, _fmoda_, _fmodb_,
_lum, ogna_, and _prelp_ expression was not locally increased (Figs. 1f and 2c; Supplementary Fig. 2g). Altogether, these data reveal an opposing abundance of Chad, Lum, Ogn, Dcn, Fmod, and
Prelp proteins in the spinal lesion site of rat and zebrafish, respectively. To obtain further evidence that the capacity for axon regeneration scales with SLRP protein abundance, we
analyzed their expression after SCI in adult zebrafish and adult mice, which possess high and low regenerative capacity for the CNS, respectively. We decided to concentrate on Fmod, Lum, and
Prelp due to their structural similarities as class II SLRPs. Additionally, we focused on Chad which showed the highest abundance among SLRPs in the rat spinal lesion site (Fig. 2a).
Consistent with our findings in larval animals, fluorescence ISH on tissue sections of adult zebrafish revealed upregulation of _aspn_ expression in the highly disorganized lesion core at 7
dpl, whereas expression of _chad_, _fmoda_, _lum_, and _prelp_ was not increased over baseline levels (Fig. 2d). In contrast, we found prominent anti-Chad, anti-Fmod, anti-Lum, and
anti-Prelp immunoreactivity in spinal cord stumps and the lesion core of adult mice at one month after spinal cord transection (Fig. 2e). The abundance of Chad, Fmod, Lum, and Prelp proteins
in the injury ECM therefore reciprocally correlates with the CNS regenerative capacity. SLRPS ARE ABUNDANT IN HUMAN CNS LESIONS We next sought to determine whether the SLRPs CHAD, FMOD,
LUM, and PRELP are abundant in the injured human CNS. In surgically removed brain tissue samples from six patients with traumatic brain injury (TBI) or brain surgery, we detected prominent
anti-CHAD, anti-FMOD, anti-LUM, and anti-PRELP immunoreactivity in areas of scarring caused by contusion, local hemorrhage, or previous surgery (Fig. 3; Supplementary Fig. 3a, b;
Supplementary Table 1). By contrast, negligible immunoreactivity was observed in a reference group of six human brain autopsy and biopsy controls without signs of fibrous scarring
(Supplementary Fig. 3c, d; Supplementary Table 1). We next analyzed post-mortem spinal cord tissue from six patients with traumatic SCI. SCI occurred in the cervical region through
compression or contusion, and patients survived between 9 and 111 days after injury (subacute to intermediate phase; Supplementary Table 2). We found a localized increase in immunoreactivity
in the lesion epicenter, as compared to rostral or caudal control segments of the same patient, for anti-LUM in five out of six cases, for anti-PRELP and anti-FMOD in four out of six cases,
and anti-CHAD in two out of six cases (Fig. 4; Supplementary Table 3). The enrichment of SLRPs is therefore a feature of human CNS lesions. SLRPS ARE INHIBITORY TO CNS AXON REGENERATION
Since CHAD, FMOD, LUM, and PRELP proteins are highly abundant in the injury ECM of poorly regenerating rodents and humans but are absent in zebrafish with a high regenerative capacity for
the CNS, we hypothesized that SLRPs inhibit regeneration. We therefore investigated the effect of increasing SLRP protein levels in the zebrafish injury ECM on axonal regrowth and functional
recovery after SCI. We generated doxycycline (DOX)-inducible Tet-responder zebrafish lines to target expression of _chad-mcherry_, _fmoda-mcherry_, _lum-mcherry_, or _prelp-mcherry_ fusions
specifically to _pdgfrb__+_ myoseptal and perivascular cells when used in combination with a _pdgfrb_ promotor-driven Tet-activator line (henceforth abbreviated as _pdgfrb_:SLRP) (Fig. 5a).
Additionally, we created a Tet-responder line for the selective induction of _aspn-mcherry_ to control for potential overexpression artifacts of SLRPs. _pdgfrb__+_ cells are rapidly
recruited in response to SCI to secrete an injury-specific ECM in the lesion site (Fig. 5b)13. Moreover, qRT-PCR on GFP+ and GFP− cells isolated from uninjured _pdgfrb_:GFP transgenic
animals by FACS revealed several-fold higher expression levels of endogenous _aspn_ (\(\overline{{{{{{\rm{FC}}}}}}}=22.3\)), _chad_ (\(\overline{{{{{{\rm{FC}}}}}}}=3.8\)), _fmoda_
(\(\overline{{{{{{\rm{FC}}}}}}}=4.8\)), _lum_ (\(\overline{{{{{{\rm{FC}}}}}}}=6.6\)), and _prelp_ (\(\overline{{{{{{\rm{FC}}}}}}}=10.5\)) transcripts in _pdgfrb__+_ cells as compared to
_pdgfrb_− cells (Supplementary Fig. 4a). This indicates that _pdgfrb__+_ cells are a main source of SLRP proteins under physiological conditions. Following SCI, _fmoda_, _lum_, and _prelp_
expression is downregulated whereas _aspn_ is upregulated in _pdgfrb__+_ cells in zebrafish, which we have reported previously13. Together, this makes _pdgfrb__+_ fibroblast-like cells an
ideal target for manipulating the ECM in the zebrafish spinal lesion site. Induction of _aspn-mcherry_, _chad-mcherry_, _fmoda-mcherry_, _lum-mcherry_, or _prelp-mcherry_ expression in
unlesioned _pdgfrb_:SLRP transgenic animals resulted in fluorescent labeling of mainly the myosepta and vasculature, thus resembling the _pdgfrb_+ cell niche (Supplementary Fig. 4b, c)13. 3D
reconstruction of high-resolution images of _pdgfrb_:SLRP;_pdgfrb_:GFP transgenics revealed accumulation of mCherry signal in the pericellular environment of _pdgfrb_+ cells (Supplementary
Fig. 4d). Furthermore, we observed variations in the mCherry fluorescence pattern among different SLRP proteins, including distinct mesh and fiber-like structures in the case of Aspn, Fmoda,
and Prelp (Supplementary Fig. 4b, d). Together, this supports the secretion and binding of the SLRP-mCherry fusion proteins to fibrillar ECM36. Importantly, using the TUNEL assay showed
that TetON system-driven expression of _chad_, _fmoda_, _lum_, or _prelp_ did not lead to an increase in the number of apoptotic _pdgfrb__+_ cells over baseline levels (Supplementary Fig.
4e). Of note, our protocol was sufficiently sensitive to detect _pdgfrb_+/TUNEL+ cells in whole-mount preparations following nitroreductase-mediated targeted ablation in unlesioned
_pdgfrb_:GFP;_pdgfrb_:NTR-mCherry transgenic animals (Supplementary Fig. 4f). At 1 dpl, in the highly disorganized lesion core of _pdgfrb_:SLRP;_pdgfrb_:GFP transgenic animals, _pdgfrb__+_
fibroblasts selectively expressed the _slrp-mcherry_ fusions (Fig. 5c, d). Furthermore, mCherry fluorescence signal accumulated in the lesion core, indicating enrichment of the secreted
proteins (Fig. 5e). _pdgfrb_:SLRP transgenics thereby enable the experimental increase of SLRP protein levels in the injury ECM after SCI. To assess whether axon regeneration is affected in
_pdgfrb_:SLRP transgenics, we determined the thickness of the axonal bridge that reconnects the severed spinal cord ends in live _elavl3_:GFP-F transgenic animals at 2 dpl, a measure that
correlates with the recovery of swimming function (Fig. 5f)21. We found that the average axonal bridge thickness was reduced by 41-52% when Chad, Fmoda, Lum, or Prelp was targeted to the
injury ECM, as compared to their controls (Fig. 5g; Supplementary Fig. 4g). Moreover, quantification of swimming distance at 2 dpl showed that _pdgfrb_:SLRP transgenics exhibited worse
functional recovery than their controls (30-42% reduced swim distance) (Fig. 5h). The effect on axon regeneration and functional recovery was further enhanced when two SLRPs (Chad, Lum) were
concomitantly targeted to the injury ECM (73% reduced axonal bridge thickness, 60% reduced swim distance; Fig. 5i, j). Notably, targeting Aspn to the injury ECM had no effect on axon
regeneration and recovery of swimming function, thus supporting the specificity of the observed phenotypes (Fig. 5g, h; Supplementary Fig. 4g). Our data therefore identify Chad, Fmod, Lum,
and Prelp as ECM factors that inhibit CNS axon regeneration in vivo. Interestingly, bridging of astroglia-like processes, which cross the non-neural lesion site independently of regenerating
axons, was also reduced by 44-54% when Chad, Fmoda, Lum, or Prelp was targeted to injury ECM (analyzed in _her4.3_:GFP-F transgenic animals; Supplementary Fig. 4h)14,37,38. This suggests
that the injury ECM may be less permissive to neural regeneration in the presence of SLRPs. SLRPS DO NOT DIRECTLY ACT ON NEURONS TO INHIBIT NEURITE EXTENSION To elucidate the mechanism by
which SLRPs inhibit neurite growth, we first examined a potential direct (biochemical) interaction with neurons, which has been reported for CSPGs and myelin-associated inhibitors39,40,41.
To that aim, we used an _Xla.Tubb_ promoter-driven Tet-activator line to target _chad_, _fmoda_, _lum_, or _prelp_ expression specifically to neurons, including brainstem descending and
spinal interneurons (Fig. 6a; Supplementary Fig. 5a, b)14,42. Induction of _chad-mcherry_, _fmoda-mcherry_, _lum-mcherry_, or _prelp-mcherry_ expression in
_Xla.Tubb_:TetA;_TetRE_:SLRP-mCherry transgenic animals (henceforth abbreviated as _Xla.Tubb_:SLRP) led to robust and largely confined fluorescent labeling of the brain and spinal cord (Fig.
6b, c; Supplementary Fig. 5c). Comparing the fluorescence pattern of SLRP-mCherry fusion proteins in _Xla.Tubb_:SLRP transgenics to that of cytoplasmic DsRed proteins in _Xla.Tubb_:DsRed
transgenic animals revealed prominent mCherry signal also in DsRed-negative regions of the spinal cord, including the central canal and its ependymal lining (Supplementary Fig. 5d).
Moreover, primary cell culture from dissociated _Xla.Tubb_:SLRP;_elavl3_:GFP-F transgenic animals showed perineuronal mCherry fluorescence (Supplementary Fig. 5e). These data support that
neuronal SLRP-mCherry fusion proteins are secreted into the extracellular space. At 1 dpl, we detected negligible mCherry fluorescence in the lesion core of _Xla.Tubb_:SLRP transgenic
animals, which is consistent with the acute neuronal loss and secondary cell death following complete spinal cord transection (Fig. 6c, Supplementary Fig. 5b)21,43. Thus, cell type-specific
manipulations allow us to distinguish in vivo between direct interactions of SLRPs with neurons and indirect effects on axon growth through modulation of the non-neural lesion environment.
We found that targeting _chad_, _fmoda_, _lum_, or _prelp_ expression specifically to neurons did not impair axon regeneration, as determined by measuring the axonal bridge thickness in live
_elavl3_:GFP-F transgenic animals at 2 dpl (Fig. 6d; Supplementary Fig. 5f). To corroborate these findings, we seeded adult primary murine dorsal root ganglion (DRG) neurons on
laminin-coated glass coverslips and assessed neurite outgrowth in the presence of soluble or substrate-bound SLRPs (Fig. 6e–g). These 2D in vitro assays allow to test primarily for direct
biochemical (ligand-receptor) interactions of SLRPs with the axonal growth cone. Potential indirect effects of SLRPs on axon regeneration through modulating inflammation, ECM composition,
ECM assembly, or mechanical ECM properties, can be excluded. Although substrate-bound high molecular weight CSPGs potently reduced the average neurite length by 66%, a mixture of human CHAD,
FMOD, LUM, and PRELP proteins had no effect (Fig. 6f). Similarly, average neurite length was not inhibited when SLRP proteins were supplemented to the growth medium but decreased by 29% in
the presence of soluble CSPGs (Fig. 6g). Taken together, in vivo and in vitro data support that SLRPs inhibit axon growth indirectly. SLRPS DO NOT PREVENT INFLAMMATION RESOLUTION To test
whether the presence of SLRPs in the injury ECM delays inflammation resolution, we analyzed the clearance of neutrophils and expression of the proinflammatory cytokine _il1b_, both of which
processes must be tightly controlled for successful axon regeneration3,21. In larval zebrafish, the influx of Mpx+ neutrophils peaks as early as two hours following SCI, after which cell
numbers rapidly decrease in the lesion site21. We found that targeting Chad, Fmoda, Lum, or Prelp to the injury ECM in _pdgfrb_:SLRP transgenic animals did not lead to a higher number of
Mpx+ neutrophils in the lesion site at 1 dpl (Supplementary Fig. 6a). Consistent with this, transcript levels of neutrophil-derived _il1b_ were not increased in the lesion site of
_pdgfrb_:SLRP transgenic animals at 1 dpl (determined by qRT-PCR; Supplementary Fig. 6b)21. Altogether, this suggests that the inhibition of axon regeneration by SLRPs does not occur via the
prevention of inflammation resolution. SLRPS DO NOT ALTER THE FIBROBLAST RESPONSE Accumulation of _pdgfrb_+ fibroblasts in the lesion site and secretion of a growth-conducive ECM is
critical for axon regeneration after SCI in the zebrafish13,14. Hence, we sought to determine whether SLRPs inhibit axon regeneration by altering the fibroblast response in _pdgfrb_:SLRP
transgenic animals. We did not detect significant changes in the area coverage of _pdgfrb_+ fibroblasts in the lesion site at 1 dpl (analyzed in _pdgfrb_:GFP transgenics), indicating that
their recruitment was largely unperturbed (Supplementary Fig. 7). This is consistent with our findings that _pdgfrb_+ cell-specific induction of _slrp-mcherry_ fusions does not trigger
apoptosis of _pdgfrb_+ cells (Supplementary Fig. 4e). We next analyzed the composition of the injury ECM in _pdgfrb_:SLRP transgenic animals at 1 dpl, using MS-based quantitative proteomics.
We found that induction of either _chad_, _fmoda_, _lum_, or _prelp_ in _pdgfrb_+ cells did not lead to significant changes (FDR < 0.1, |FC | ≥ 1.3) in the abundance of detected
matrisome proteins as compared to their respective controls (Supplementary Fig. 8a–c). To further validate the MS results, we used ISH to evaluate the expression pattern and transcript
levels of five genes, coding for matrisome proteins that showed the highest (yet non-significant) fold change in each of the four experimental conditions. Consistent with the MS analysis,
ISH signals in the lesion site were comparable between _pdgfrb_:SLRP transgenics and their respective controls for all genes analyzed (Supplementary Fig. 8d). We thus conclude that targeting
SLRPs to _pdgfrb_+ cells does not lead to major changes in the biochemical composition of the injury ECM. FMOD, LUM, AND PRELP MODIFY THE STRUCTURAL PROPERTIES OF THE LESION ENVIRONMENT The
structure and mechanical properties of the ECM within CNS scars differ significantly from that of healthy tissue4,9,11. SLRPs play instructive and structural roles in ECM organization and
assembly to control the strength and biomechanical properties of tissues44,45. We thus hypothesized that SLRPs alter the structural and mechanical properties of the injury ECM, thereby
making it adverse to axon regeneration. In order to assess this in vivo, we first utilized cross-polarized optical coherence tomography (CP-OCT). CP-OCT reports on relative changes in the
polarization of incident light and can provide additional contrast to the native tissue based on its structural differences, including ECM structure46,47. Consistent with the changes in
tissue structure which occur after CNS injury, the co-polarization ratio (ratio of preserved polarization to total reflectivity) prominently increased in the zebrafish spinal lesion site at
1 dpl, as compared to adjacent uninjured trunk tissue (Fig. 7a, b). Targeting Chad to the injury ECM (analyzed in _pdgfrb_:SLRP transgenics) did not alter the co-polarization ratio in the
lesion site at 1 dpl, as compared to controls (Fig. 7b). By contrast, an increase in the co-polarization ratio was observed when Fmoda, Lum, or Prelp were targeted to the injury ECM
(controlFmoda: 0.709 ± 0.008, Fmoda: 0.750 ± 0.006; controlLum: 0.702 ± 0.010, Lum: 0.733 ± 0.005; controlPrelp: 0.713 ± 0.006, Prelp: 0.738 ± 0.004; Fig. 7b). Hence, the presence of Fmod,
Lum, and Prelp in the injury ECM coincides with alterations in the structural properties of the lesion environment and impaired axonal regrowth after SCI. FMOD, LUM, AND PRELP MODIFY THE
MECHANICAL PROPERTIES OF THE LESION ENVIRONMENT We next explored whether the observed structural alterations relate to changes in the mechanical properties of the lesion environment. To test
this in vivo, we utilized confocal Brillouin microscopy (BM), a non-invasive, label-free, and all-optical method for assessing viscoelastic properties of biological samples in three
dimensions48,49,50. BM measures an inelastic scattering process of incident light (photons) by density fluctuations (acoustic phonons) in the sample, called Brillouin scattering. The energy
transfer between the photons and acoustic phonons occurring during the scattering process can be quantified as the Brillouin frequency shift (\({{{{{{\rm{\nu }}}}}}}_{{{{{{\rm{B}}}}}}}\)),
which depends on the material’s elastic properties, denoted by the longitudinal modulus (_M’_). \({{{{{{\rm{\nu }}}}}}}_{{{{{{\rm{B}}}}}}}\) is proportional to the square root of _M’_, which
describes a material’s elastic deformability under a distinct type of mechanical loading (i.e., longitudinal compressibility). Notably, \({{{{{{\rm{\nu }}}}}}}_{{{{{{\rm{B}}}}}}}\) has been
shown in vivo to be sensitive to changes in the mechanical properties of the ECM during both physiological and pathological processes51,52,53. We acquired Brillouin images of the region in
the spinal lesion site through which the regenerating axons preferentially grow at 1 dpl (Fig. 7c). Targeting Chad or Fmoda to the injury ECM (analyzed in _pdgfrb_:SLRP transgenics) did not
alter \({{{{{{\rm{\nu }}}}}}}_{{{{{{\rm{B}}}}}}}\) of the lesion site (Fig. 7c). By contrast, a decrease of \({{{{{{\rm{\nu }}}}}}}_{{{{{{\rm{B}}}}}}}\) was observed when Lum or Prelp were
targeted to the injury ECM (controlLum: (5.324 ± 0.004) GHz, Lum: (5.298 ± 0.006) GHz; controlPrelp: (5.321 ± 0.005) GHz, Prelp: (5.295 ± 0.005) GHz; Fig. 7c). This suggests that Lum and
Prelp increase the tissue compressibility of the local microenvironment in the spinal lesion site. \({{{{{{\rm{\nu }}}}}}}_{{{{{{\rm{B}}}}}}}\) depends not only on \(M\hbox{'}\) but
also on the refractive index (\(n\)) and density (\(\rho\)) of the sample in the focal volume (Supplementary Note 1). To exclude the possibility that the observed changes in \({{{{{{\rm{\nu
}}}}}}}_{{{{{{\rm{B}}}}}}}\) are solely due to differences in \(n\), we quantified its local distribution in the lesion site in vivo using optical diffraction tomography (ODT) (Supplementary
Fig. 9). This revealed \(\bar{n}\) = 1.3628 ± 0.0005 in _pdgfrb_:lum transgenics, and \(\bar{n}\) = 1.3636 ± 0.0005 in control animals. In _pdgfrb_:prelp transgenics, we measured
\(\bar{n}\) = 1.3635 ± 0.0005 and \(\bar{n}\) = 1.3621 ± 0.0003 for their respective control animals. To estimate the impact of the uncertainties in \(\bar{n}\) and \(\bar{{\nu
}_{{{{{{\rm{B}}}}}}}}\) on \(M\hbox{'}\) in our experimental framework, we employed Gaussian propagation of uncertainty (Supplementary Note 2). This showed that the uncertainty in \(n\)
is overall contributing less to the propagated uncertainty in \(M\hbox{'}\) than the one of \({\nu }_{{{{{{\rm{B}}}}}}}\) for the values reported above. We conclude that the
differences in \(M\hbox{'}\) between control and _pdgfrb_:SLRP transgenic animals stem primarily from the observed changes in \({\nu }_{{{{{{\rm{B}}}}}}}\) rather than \(n\), including
respective uncertainties. Hence, the longitudinal moduli with respective propagated uncertainties of \(n\), \({\nu }_{{{{{{\rm{B}}}}}}}\), refractive index increment of the dry mass content
\((\alpha )\), and the partial specific volume of the dry mass content \((\theta )\) for the different conditionals are calculated to be: \({M}^{{\prime}
}({{{{{{\rm{control}}}}}}}^{{{{{{\rm{Lum}}}}}}})=(2.396\pm 0.006){{{{{\rm{GPa}}}}}}\), \({M}^{{\prime} }\left({{{{{\rm{Lum}}}}}}\right)=(2.373\pm 0.007){{{{{\rm{GPa}}}}}}\), \({M}^{{\prime}
}({{{{{{\rm{control}}}}}}}^{{{{{{\rm{Prelp}}}}}}})=(2.394\pm 0.006){{{{{\rm{GPa}}}}}}\), and \({M}^{{\prime} }\left({{{{{\rm{Prelp}}}}}}\right)=(2.370\pm 0.006){{{{{\rm{GPa}}}}}}\). Thus,
targeting Lum or Prelp to the injury ECM leads to changes in \(M\hbox{'}\) of the lesion environment. We next performed atomic force microscopy (AFM)-based nanoindentation measurements
on acute, living tissue preparations to quantify the viscoelastic properties (Young’s modulus \(E\), viscosity \(\eta\)) of the lesion core in the presence and absence of SLRP proteins
(analyzed in _pdgfrb_:SLRPs transgenics; Fig. 7d). Applying two independent fitting models to the recorded force-indentation curves (Kelvin─Voigt─Maxwell, Hertz), we found that targeting
Fmoda, Lum, or Prelp to the injury ECM reduced the apparent Young’s modulus by 44–66% at 2 dpl (Fig. 7e; Supplementary Fig. 10). Furthermore, the apparent viscosity was reduced by 23–25% in
_pdgfrb_:_fmoda_ and _pdgfrb_:prelp transgenic animals as compared to controls (Fig. 7f). Thus, targeting Fmoda, Lum, or Prelp to injury ECM leads to changes in the viscoelastic response of
the lesion environment. Altogether, these data show that SLRPs alter the mechanical properties of the injury ECM and inhibit axon regeneration after SCI. DISCUSSION Zebrafish regenerate
severed axons and recover locomotor function after CNS injury, in sharp contrast to adult mammals including humans. Here, we demonstrate that differences in injury-associated ECM deposits
account for the high regenerative capacity of zebrafish. We show that zebrafish establish a favorable composition of the injury ECM, which is characterized by the low abundance of inhibitory
molecules rather than the presence of species-specific axon growth-promoting factors. Our study characterizes the SLRPs Chad, Fmod, Lum, and Prelp as such inhibitory molecules that govern
the permissiveness of the injury ECM for regeneration. Increasing the abundance of any one of these proteins in the zebrafish injury ECM is sufficient to impair the capacity of severed axons
to regrow across CNS lesions. This identifies SLRPs as potent inhibitors of CNS axon regeneration in vivo. Furthermore, we demonstrate that CHAD, FMOD, LUM, and PRELP are enriched in the
injured human brain and spinal cord. Reducing the abundance of these SLRPs in the injury ECM or attenuating their activity may therefore offer a therapeutic strategy to enhance the
permissiveness of CNS lesions for axon growth. Current evidence suggests a context-dependent cellular origin of SLRPs in the mammalian CNS, including neurons (ref. 54, this study),
astrocytes (this study), and fibroblast lineage cells55,56,57. Hence, future studies will need to precisely map the cellular source of SLRPs in CNS lesions. So far, much attention has been
focused on components of the injury ECM that inhibit regeneration through direct interactions with the axonal growth cone4,5. However, mechanisms beyond growth cone collapse, repellence, and
entrapment are emerging. For example, CSPGs impair inflammation resolution, thereby contributing to a lesion environment hostile to axon growth3. Here, we propose a new class of inhibitors
of CNS axon regeneration which may function in part through modifying the structural and mechanical properties of the lesion environment. Our functional experiments support that SLRPs
neither inhibit regeneration through i) direct interactions with the axonal growth cone, nor ii) prevention of inflammation resolution, nor iii) altering the composition of the
fibroblast-derived injury ECM. Although we cannot rule out the possibility of SLRPs influencing the availability of neurotrophic factors in the lesion environment due to sensitivity
limitations of the mass spectrometry analysis, our in vivo experiments provide evidence against this scenario. Specifically, neuron-specific induction of _chad_, _fmod_, _lum_, or _prelp_
expression did not impact axonal regrowth. Utilizing AFM-based nanoindentation measurements, intravital CP-OCT and Brillouin microscopy, we show that the presence of individual SLRP family
members in the injury ECM leads to changes in the structural (Fmod, Lum, Prelp) and mechanical (Lum, Prelp: reduced longitudinal modulus; Fmod, Lum, Prelp: reduced apparent Young’s modulus;
Fmod, Prelp: reduced apparent viscosity) properties of the lesion environment, which coincides with an impaired regenerative capacity of axons. This indicates that a single ECM factor can
direct CNS repair toward inhibitory scarring by altering the mechano-structural properties of the local microenvironment. Previous studies have shown that CNS injuries in mammals are
accompanied by an increased compliance of the tissue, whereas the spinal cord of zebrafish transiently stiffens (increased apparent Young’s modulus)9,11,58. This work provides in vivo
evidence for a direct relationship between tissue mechanics (longitudinal modulus, apparent Young’s modulus, apparent viscosity) and regenerative outcome upon CNS injury. Furthermore, we
propose SLRPs as a causal factor of the differential response in zebrafish and humans. LUM has previously been implicated in the modulation of local tissue stiffness during the induction of
fold formation in the developing human neocortex, further supporting a role of SLRPs in CNS tissue mechanics59. While the apparent Young’s modulus of the injury ECM was reduced in the
presence of Fmoda, Lum, or Prelp proteins, effective changes in the longitudinal modulus or apparent viscosity were only observed in a subset of these SLRPs. This suggests that different
SLRP family members have specific functions in modulating the mechanical properties of CNS lesions. Interestingly, targeting Chad to the injury ECM did not yield effective changes in ECM
structure and mechanics. Hence, the mechanism through which Chad inhibits CNS regeneration remains to be determined. In conclusion, our data establish the composition, structural
organization, and mechanical properties of the ECM as critical determinants of regenerative success after CNS injury. These findings reveal targets to make CNS lesions more conducive to axon
growth in mammals, in which regeneration fails. METHODS HUMAN TISSUE COLLECTION AND ETHICAL COMPLIANCE This study was approved by the Ethics Committee of the Friedrich-Alexander-University
(FAU) Erlangen-Nürnberg, Germany (Refs.#18−193_1-Bio, 193_18B, 92_14B; brain samples) and the Ethics Council of the Max Planck Society (Ref.#2021_40; spinal cord samples) and was conducted
in accordance with the Declaration of Helsinki. For brain samples, informed and written consent was obtained from all patients, their parents, or legal representatives if underage. We
reviewed clinical and histological data of individuals who underwent surgery for the treatment of their focal drug-resistant epilepsy and were diagnosed with a scar, i.e., extensively
transformed fibrotic and gliotic brain tissue. _En bloc_ resections were carried out and tissue was dissected into 5 mm-thick slices along the anterior-posterior axis. Tissue samples were
fixed overnight in 4% formalin and routinely processed into liquid paraffin. Paraffin-embedded tissue was sectioned in coronal orientation at a thickness of 4 µm. Six patients with
histologically proven scarred brain tissue following traumatic brain injury (TBI, _n_ = 3), or repeated surgery (re-OP, _n_ = 3) were selected for further investigation. Furthermore, a
reference group including no-seizure autopsy controls (_n_ = 2) and focal epilepsy patients with a cortical malformation as the primary lesion but no fibrous scarring of resected tissue upon
visual inspection (_n_ = 4) was also analyzed. In addition to routine hematoxylin and eosin (H&E) staining, immunohistochemical examination of all surgical brain specimens was performed
using the following panel of antibodies: mouse monoclonal anti-NeuN (clone A-60, Millipore Cat#MAB377; RRID:AB_2298772, 1:1000), mouse monoclonal anti-GFAP (clone 6F2, Dako Cat#M0761;
RRID:AB_2109952, 1:800), and recombinant rabbit monoclonal anti-LUM (lumican, Invitrogen Cat#MA5-29402; RRID:AB_2785270, 1:500-1:600). The samples were subsequently digitized using a
NanoZoomer Hamamatsu S60 digital slide scanner. Human spinal cord injury (SCI) samples, control samples, and related clinical and neuropathological information were obtained from the
International Spinal Cord Injury Biobank (ISCIB; Vancouver, Canada). The Clinical Research Ethics Board of the University of Columbia (Vancouver, Canada) granted the permission for
post-mortem spinal cord acquisition and for sharing biospecimens. Spinal cord biospecimens were collected from consented participants or their next-of-kin and provided as paraffin-embedded
tissue sections at a thickness of 5 µm. Supplementary Tables 1 and 2 detail the clinical and neuropathological data of subjects included in this study. ZEBRAFISH HUSBANDRY, TRANSGENIC LINES,
AND ETHICAL COMPLIANCE All zebrafish experimental procedures were in accordance with institutional and internationally recognized guidelines and were approved by the Regierung von
Unterfranken (Government of Lower Franconia, Würzburg, Germany; RUF 55.2.2-2532.2-1120-15) and the BRFAA Animal Ethics Committee and the Attica Veterinary Department (no: 534930/20, no:
534935/20, no: 1189597, 236/03-04-2023 for EL 25 BIOexp 03). All zebrafish lines were kept and raised under a 14/10 h light/dark cycle and according to FELASA recommendations60. We used AB
and WIK wild-type strains of zebrafish (_Danio rerio_) and the following transgenic zebrafish lines: BAC(_pdgfrb_:Gal4ff)ncv24 61, _UAS_:EGFPzf82 62, _UAS-E1b_:Eco.NfsB-mCherryc264 63,
_pdgfrb_:TetA AmCyanmps7 13, _Xla.Tubb_:TetA AmCyanue103 14, _Xla.Tubb_:DsRedzf148 42, _TetRE_:lum-mCherrymps3 13, and _her4.3_:GFP-Fmps9. _elavl3_:GFP-Fmps10, _TetRE_:aspn-mCherrymps11,
_TetRE_:chad-mCherrymps12, _TetRE_:fmoda-mCherrymps13, and _TetRE_:prelp-mCherrymps14 transgenic zebrafish lines were established using the DNA constructs and methodology described below.
Combinations of different transgenic zebrafish lines used in this study were abbreviated as follows: _pdgfrb_:aspn (_pdgfrb_:TetA AmCyan;_TetRE_:aspn-mCherry), _pdgfrb_:chad (_pdgfrb_:TetA
AmCyan;_TetRE_:chad-mCherry), _pdgfrb_:fmoda (_pdgfrb_:TetA AmCyan;_TetRE_:fmoda-mCherry), _pdgfrb_:lum (_pdgfrb_:TetA AmCyan;_TetRE_:lum-mCherry), _pdgfrb_:prelp (_pdgfrb_:TetA
AmCyan;_TetRE_:prelp-mCherry), _Xla.Tubb_:aspn (_Xla.Tubb_:TetA AmCyan;_TetRE_:aspn-mCherry), _Xla.Tubb_:chad (_Xla.Tubb_:TetA AmCyan;_TetRE_:chad-mCherry), _Xla.Tubb_:fmoda (_Xla.Tubb_:TetA
AmCyan;_TetRE_:fmoda-mCherry), _Xla.Tubb_:lum (_Xla.Tubb_:TetA AmCyan;_TetRE_:lum-mCherry), _Xla.Tubb_:prelp (_Xla.Tubb_:TetA AmCyan;_TetRE_:prelp-mCherry), _pdgfrb_:GFP
(BAC(_pdgfrb_:Gal4ff);_UAS_:EGFP), _pdgfrb_:NTR-mCherry (BAC(_pdgfrb_:Gal4ff);_UAS-E1b_:Eco.NfsB-mCherry). For live microscopy, embryos were treated with 0.00375% 1-phenyl-2-thiourea (PTU,
Sigma-Aldrich Cat#P7629), beginning at 24 hpf (hours post-fertilization), to prevent pigmentation. GENERATION OF TRANSGENIC ZEBRAFISH LINES All primer sequences for molecular cloning are
given in Supplementary Data 1, plasmid maps and sequences are given in Supplementary Data 2 to 6. To create the donor plasmid for _elavl3_:GFP-F transgenic zebrafish, the sequence coding for
the membrane-localized GFP (EGFP fused to farnesylation signal from c-HA-Ras) was amplified from the pEGFP-F vector (Clonetech) using primer pair #1, and cloned downstream of the zebrafish
_elavl3_ promoter (Addgene plasmid Cat#59530)64. To create the donor plasmids for generation of _TetRE_:aspn-mCherry, _TetRE_:chad-mCherry, _TetRE_:fmoda-mCherry, and _TetRE_:prelp-mCherry
transgenic fish, the sequences coding for zebrafish _aspn_ (ENSDART00000064798.6), _chad_ (ENSDART00000066264.4), _fmoda_ (ENSDART00000065985.5), and _prelp_ (ENSDART00000155521.2) were
amplified from cDNA of developing zebrafish (primer pairs #2 to #5), fused to mCherry at the C-terminus and cloned downstream of the tetracycline operator sequence as described65,66.
Generation of _elavl3_:GFP-F, _TetRE_:aspn-mCherry, _TetRE_:chad-mCherry, _TetRE_:fmoda-mCherry, and _TetRE_:prelp-mCherry transgenic zebrafish lines was achieved by injection of 35 pg of
the respective donor plasmid together with in vitro synthesized capped sense mRNA of the Tol2 transposase into 1-cell embryos67. Further information and requests for unique biological
reagents should be directed to and will be fulfilled by the corresponding author. DRUG TREATMENTS Drug treatments were performed according to the schematic timelines shown with each
experiment. Doxycycline (DOX; Sigma-Aldrich Cat#D9891) was dissolved in reverse osmosis H2O at 50 mg mL−1 and used at a final concentration of 25 µg mL−1. Metronidazole (MTZ; Sigma-Aldrich
Cat#M3761) was dissolved in DMSO (VWR Cat#WN182) at 800 mM stock concentration and used at a final concentration of 2 mM. ZEBRAFISH SPINAL CORD LESIONS AND BEHAVIORAL RECOVERY A detailed
protocol for inducing spinal cord lesions in zebrafish larvae has been previously described68. Briefly, zebrafish larvae (3 dpf) were anesthetized in E3 medium containing 0.02% MS-222
(PharmaQ Cat# Tricaine PharmaQ). A 30 G x ½” hypodermic needle was used to transect the spinal cord by either incision or perforation at the level of the urogenital pore. After surgery,
larvae were returned to E3 medium for recovery and kept at 28.5 °C. Larvae that had undergone extensive damage to the notochord were excluded from further analysis. For lesions, the
experimenter was blinded to the experimental treatment. Larvae used for lesions were randomly taken from Petri dishes containing up to 50 animals, however, no formal randomization method was
used. Analysis of behavioral recovery after spinal cord transection in larval zebrafish was performed as previously described18, using EthoVision XT software (Noldus, version 16.0.1536).
Behavioral data are shown as the distance traveled within 10 s after touch, averaged for triplicate measures per larva. Adult spinal cord lesions were performed as described previously69.
Briefly, zebrafish (>3 months post-fertilization) were anesthetized by immersion in 0.02% MS-222 in PBS. A longitudinal incision was made at the side of the fish to expose the vertebral
column. The spinal cord was transected under visual control, 5 mm caudal to the brainstem-spinal cord junction. ADULT MICE SPINAL CORD LESIONS, DAILY CARE, AND ETHICAL COMPLIANCE All mice
experimental procedures were conducted in accordance with the standards and rules of KU Leuven and Belgian national regulations (protocol no: P122-2017). Mice were group housed, and all mice
were kept on a 12/12 h light/dark cycle in a facility where temperature was kept at 22 ± 2 °C and ~50% humidity. For spinal cord lesions, adult mice of both sexes, aged between one and two
month were used. Mice were maintained on a mixed genetic background (129/C57Bl6). All surgical procedures were performed under aseptic conditions and under full general anesthesia with
isoflurane in oxygen-enriched air (1-2%). Adult mice underwent a mid-dorsal skin incision to access the spinal cord and muscles were separated along the midline to expose the vertebral
column. Laminectomy was performed using forceps at spinal segment ∼T10, and the spinal cord was completely transected using micro scissors. After surgery, mice were placed in a heat chamber
until fully awake. Analgesia (Metacam, Boehringer Ingelheim, 0.5 mg mL−1) was provided after surgery and antibiotics (Cefazoline, Sandoz, 5 mg kg−1) were provided for 3 days post-surgery.
Mice were housed with a 12/12 h light/dark cycle with ad libitum access to food and water, and cared for twice daily with manual bladder voiding. Complete transections were confirmed
post-mortem by visual inspection of the spinal cord. At one month after injuy, all mice were deeply anesthetized with ketamine (100 mg kg−1, _i.p_.) and xylazine (5 mg kg-1, _i.p_.) and
perfused with 4% PFA. All collected tissue was cryoprotected in 30% sucrose in PBS. IMAGE ACQUISITION AND PROCESSING Images were acquired using the systems described in each subsection.
Images were processed using ImageJ (http://rsb.info.nih.gov/ij/; version 2.3.0/1.53 f), Adobe Photoshop CC (version 22.3.1), and Zeiss ZEN blue software (version 3.1 blue edition). Figures
were assembled using Adobe Photoshop CC. LIVE IMAGING OF LARVAL ZEBRAFISH For live confocal imaging, zebrafish larvae were anesthetized in E3 medium containing 0.02% MS-222 and mounted in
the appropriate orientation in 1% low melting point agarose (Ultra-PureTM Low Melting Point, Invitrogen Cat#16520) between two microscope cover glasses. During imaging, larvae were covered
with 0.01% MS-222-containing E3 medium to keep preparations from drying out. Imaging was done using a Plan-Apochromat 10x/0.45 M27 objective, Plan-Apochromat 20x/0.8 objective, and
C-Apochromat 40x/1.2 W Korr UV-VIS-IR objective on a Zeiss LSM 980 confocal microscope. SECTIONING OF ZEBRAFISH Adult zebrafish were terminally anesthetized by immersion in 0.1% MS-222 in
PBS, transcardially fixed by injection of 4% paraformaldehyde (PFA; Thermo Fisher Scientific Cat#28908) solution (methanol-free) in PBS into the vascular system, and post-fixed in 4% PFA
overnight at 4 °C. Cryoprotection and sectioning were performed as previously described13. Terminally anesthetized zebrafish larvae were fixed in 4% PFA in PBS for 1 h at room temperature or
for overnight at 4 °C. After two washes in PBT (0.1% Tween-20 in PBS), the larvae were embedded in 4% agarose or 4% agar in PBS. Sections of 100 µm thickness were obtained using a vibratome
(Leica, VT1200S). The sections were then processed for in situ hybridization, as described below, or immediately counterstained with DAPI (Thermo Fisher Scientific Cat#62248) to visualize
nuclei and mounted in 75% glycerol. Images were acquired using a Plan-Apochromat 20x/0.8 and C-Apochromat 40x/1.2 W Korr UV469 VIS-IR objective on a Zeiss LSM 980 confocal microscope.
ZEBRAFISH PRIMARY CELL CULTURE Larvae with neuron-specific expression of membrane-tethered GFP (_elavl3_:GFP-F) and _slrp-mCherry_ fusions (_Xla.Tubb_:SLRP-mCherry) were dissociated in DMEM
(Thermo Fisher Cat#31885023) containing 0.08% trypsin (Thermo Fisher Cat#25200072), 625 µg ml−1 collagenase P (Roche Cat#11213865001), and 17.5 µM dispase II (Sigma Aldrich Cat#D4693). Cells
were resuspended in MEM (Thermo Fisher Cat#11095-080) supplemented with 1% Neuropan2 (PanBiotech Cat#P07-11010), 1 mM sodium pyruvate (Thermo Fisher Cat#11360070), 0.6% glucose (Merck
Cat#G8270), 0.22% sodium bicarbonate (Sigma Aldrich Cat#S5761), 2 mM L-Glutamine (Gibco Cat#25030149), and 25 µg ml−1 doxycycline, and seeded in 8-well glass bottom plates (ibidi Cat# 80827)
pre-coated with Collagen I (Merck Cat#08115). Cells were grown at 5% CO2 and 28 °C for 24 h and imaged using a C-Apochromat 40x/1.2 W Korr UV469 VIS-IR objective on a Zeiss LSM 980 confocal
microscope. TISSUE DISSOCIATION AND FACS GFP+ and GFP− cells were isolated from _pdgfrb_:GFP transgenic zebrafish at 4 dpf. 120 animals were pooled for each experiment. Before tissue
dissociation, head, yolk sac, and tail fin were removed, using micro scissors. Dissociation, live cell staining, and FACS sorting of cells were done as previously described13. Briefly,
excised tissue was enzymatically dissociated using 0.25% Trypsin-EDTA (Gibco Cat#25200072) followed by mechanical dissociation using a fire-polished glass Pasteur pipette. Cell suspension
was filtered through a 20 µm cell strainer (pluriSelect Cat#43-10020-40). Following centrifugation for 10 min at 300 g, cells were resuspended in 500 µL HBSS medium (Gibco Cat#14065-056). To
stain for viable cells, Calcein Blue (Invitrogen Cat#C1429) was added to the cell suspension. Cells were directly sorted into lysis buffer using a MoFlo Astrios EQ sorter (Beckman Coulter).
For the detection of GFP, a 488 nm excitation laser and a 526/52 nm bandpass filter were used. Calcein Blue was detected following 405 nm excitation using a 431/28 nm bandpass emission
filter. QUANTITATIVE RT-PCR (QRT-PCR) For qRT-PCR on isolated _pdgfrb__+_ cells, total RNA was extracted from ~70,000 FACS-sorted GFP+ cells of dissected trunks from unlesioned _pdgfrb_:GFP
transgenic animals at 4 dpf, using Total RNA Purification Plus Micro Kit (Norgen Biotek Cat#48500). The total RNA extracted from an equal number of GFP− cells obtained from the same animals
served as control. For quantification of transcript levels in the lesion site at 1 dpl, trunk tissue of 75 animals spanning approximately three somites in length and containing the lesion
site were isolated using micro scissors. Corresponding trunk tissue of unlesioned age-matched clutch mates served as control. Total RNA was extracted using TRIzol reagent (Invitrogen
Cat#15596026). Reverse transcription was performed with Maxima™ H Minus cDNA Synthesis Master Mix with dsDNase (Thermo Fisher Scientific Cat#1681), using a combination of oligo(dT) and
random hexamer primers. qRT-PCR was performed at 60 °C using PowerUp™ SYBR™ Green Master Mix (Applied Biosystems Cat#A25918) on a StepOnePlus™ Real-Time PCR system. Samples were run in
triplicates, and expression levels were normalized to _actb1_ control. Normalized relative mRNA levels were determined using the ∆∆Ct method. Primers were designed to span an exon–exon
junction using Primer-BLAST software (https://ncbi.nlm.nih.gov/tools/primer-blast/). All primer sequences are given in Supplementary Data 1. SAMPLE PREPARATION FOR MASS SPECTROMETRY (MS)
ANALYSIS For label-free MS-based quantitative proteomics, proteins were isolated from trunk tissue of 75 wild type (strain: AB) zebrafish larvae spanning approximately three somites in
length and containing the lesion site (1 dpl, 2 dpl) or corresponding unlesioned age-matched trunk tissue (4 dpf, 5 dpf). To identify injury-induced changes in protein abundance, MS analysis
was performed on three biological replicates for each condition. To identify changes in protein abundance caused by targeting SLRPs to _pdgfrb__+_ cells, MS analysis was performed on four
biological replicates for each condition. Isolation of proteins was done as previously described with minor modifications70. Proteins were extracted in three distinct fractions, and each
fraction was analyzed separately by LC-MS/MS. Zebrafish tissue was homogenized in PBS for 10×30 s at high intensity and 10 × 30 s pauses in between, using the Bioruptor Plus sonication
system (Diogenode Cat#UCD-300). After centrifugation at 16,000 g for 2 min, the supernatant containing the soluble proteins was collected (fraction 1). The pellet was resuspended in
detergent-containing buffer (50 mM Tris (Sigma-Aldrich Cat#T1503), 5% glycerin (Roth Cat#4043.2), 500 mM NaCl (VWR Cat#27810.295), 1% NP40 (Fluka Cat#74385), 2% SDC (Sigma-Aldrich
Cat#SER0046), 1% SDS (Roth Cat#4360.2), 1% DNAse I (made in house, ProteinProduction Facility), 1 mM MgCl2 (Sigma-Aldrich Cat#M9272)), followed by incubation at 0 °C for 20 min and
homogenization using the Bioruptor Plus sonication system. After centrifugation at 16,000 g for 2 min, the supernatant containing the detergent-soluble proteins (fraction 2) and the
detergent-insoluble protein pellet (fraction 3) were collected. Proteins of fraction 1 and fraction 2 were precipitated by incubation with acetone at −20 °C for overnight. The pellets of all
three fractions were dissolved in reduction and alkylation buffer (6 M guanidinium chloride (Merck Cat#1.04220.1000), 100 mM Tris-HCl pH 8.5, 10 mM TCEP (Thermo Fisher Scientific
Cat#77720), 50 mM CAA (Sigma-Aldrich Cat#C0267)), followed by incubation at 99 °C for 15 min and sonication in the Bioruptor Plus sonication system. The proteins were diluted 1:3 with urea
buffer (4.5 mM urea (Sigma-Aldrich Cat#U1250), 10 mM Tris-HCl, 3% acetonitrile (VWR Cat#83640.320), 1 µg LysC (Wako Cat#129-02541)), and incubated at 37 °C for 3 h. Thereafter, the digestion
mixture was diluted 1:3 with 10% acetonitrile in MS grade water (VWR Cat#83645.320), followed by sonication in the Bioruptor Plus sonication system and incubation with 1 µg LysC and 2 µg
trypsin (Promega Cat#V511A) at 37 °C for overnight. Acetonitrile was removed using a SpeedVac (Christ Cat#RVC 2-25 together with CT 02-50), and peptides were further purified using in-house
produced three plug SCX stage tips (EmporeTM Cation Solid Phase Extraction Disks Cat#2251). After elution with 60 µL 5% ammonia solution (Roth Cat#5460.1) in 80% acetonitrile, samples were
vacuum-dried in the SpeedVac. LC-MS/MS ACQUISITION Peptides were solubilized in 6 µL buffer A (100% MS-LC grade water and 0.1% formic acid (VWR Cat#84865.180)), and a total volume of 3 µL
was loaded onto a 30 cm-long column (75 µm inner diameter (Polymicro Cat#TSP075375); packed in-house with ReproSil-Pur 120 C18-AQ 1.9 µm beads (Dr. Maisch GmbH Cat#r119.aq)) via the
autosampler of the Thermo Scientific Easy-nLC 1200 (Thermo Fisher Scientific) at 60 °C. For the identification of injury-induced changes in protein abundance (experimental conditions:
unlesioned 4 dpf, 1 dpl; unlesioned 5 dpf, 2 dpl), eluted peptides were directly sprayed onto the Q Exactive HF Orbitrap LC-MS/MS system (Thermo Fisher Scientific), using the
nanoelectrospray interface. As a gradient, the following steps were programmed with increasing addition of buffer B (80% acetonitrile, 0.1% formic acid): linear increase from 30% over 120
min, followed by a linear increase to 60% over 10 min, followed by a linear increase to 95% over the next 5 min, and finally buffer B was maintained at 95% for another 5 min. The mass
spectrometer was operated in a data-dependent mode with survey scans from 300 to 1750 m/z (resolution of 60000 at m/z = 200), and up to 15 of the top precursors were selected and fragmented
using higher energy collisional dissociation (HCD with a normalized collision energy of value of 28). The MS2 spectra were recorded at a resolution of 15k (at m/z = 200). AGC target for MS1
and MS2 scans were set to 3E6 and 1E5, respectively, within a maximum injection time of 100 ms for MS1 and 25 ms for MS2. Dynamic exclusion was set to 16 ms. For identification of changes in
protein abundance caused by overexpression of SLRPs, eluting peptides were directly sprayed onto the timsTOF Pro LC-MS/MS system (Bruker). As gradient, the following steps were programmed
with increasing addition of buffer B (80% acetonitrile, 0.1% formic acid): linear increase from 5% to 25% over 75 min, followed by a linear increase to 35% over 30 min, followed by a linear
increase to 58% over the next 5 min, followed by a linear increase to 95% over the next 5 min, and finally buffer B was maintained at 95% for another 5 min. Data acquisition on the timsTOF
Pro was performed using timsControl. The mass spectrometer was operated in data-dependent PASEF mode with one survey TIMS-MS and ten PASEF MS/MS scans per acquisition cycle. Analysis was
performed in a mass scan range from 100-1700 m/z and an ion mobility range from 1/K0 = 0.85 Vs cm−2 to 1.30 Vs cm−2, using equal ion accumulation and ramp time in the dual TIMS analyzer of
100 ms each at a spectra rate of 9.43 Hz. Suitable precursor ions for MS/MS analysis were isolated in a window of 2 Th for m/z < 700 and 3 Th for m/z > 700 by rapidly switching the
quadrupole position in sync with the elution of precursors from the TIMS device. The collision energy was lowered as a function of ion mobility, starting from 59 eV for 1/K0 = 1.6 Vs cm−2 to
20 eV for 0.6 Vs cm−2. Collision energies were interpolated linearly between these two 1/K0 values and kept constant above or below these base points. Singly charged precursor ions were
excluded with a polygon filter mask and further m/z and ion mobility information was used for dynamic exclusion to avoid re-sequencing of precursors that reached a target value of 20,000
a.u. The ion mobility dimension was calibrated linearly using three ions from the Agilent ESI LC/MS tuning mix (m/z, 1/K0: 622.0289, 0.9848 Vs cm−2; 922.0097 Vs cm−2, 1.1895 Vs cm−2;
1221.9906 Vs cm−2, 1.3820 Vs cm−2). COMPUTATIONAL MS DATA ANALYSIS Raw data were processed using the MaxQuant computational platform (versions 1.6.17.0 and 2.0.1.0)71 with standard settings
applied. Briefly, the peak list was searched against the zebrafish (_Danio rerio_) proteome database (SwissProt and TrEMBL, 46847 entries) with an allowed precursor mass deviation of 4.5 ppm
and an allowed fragment mass deviation of 20 ppm. MaxQuant enables individual peptide mass tolerances by default, which was used in the search. Cysteine carbamidomethylation was set as
static modification, and methionine oxidation and N-terminal acetylation as variable modifications. Proteins were quantified across samples using the label-free quantification algorithm in
MaxQuant, generating label-free quantification (LFQ) intensities. The match-between-runs option was enabled. BIOINFORMATIC ANALYSIS OF PROTEOMICS DATA LFQ intensity values were imported to
Perseus software (version 1.6.14.0)72. Filters were set to exclude proteins identified by site, matching to the reverse database, or contaminants. For the identification of injury-induced
changes in protein abundance (lesioned _vs_. unlesioned), proteins that exhibited ≥ 1 invalid value were excluded from further analysis. However, we included proteins that showed invalid
values in all three replicates of one experimental condition (either lesioned or unlesioned). This was necessary to include proteins undetectable in unlesioned animals but with enrichment
after SCI. For identification of changes in protein abundance caused by cell-type specific induction of SLRPs, all proteins that exhibited ≥ 1 invalid value were excluded. Proteins
exhibiting significantly altered abundance between experimental and control samples were identified by permutation-based analysis73 with FDR < 0.1, s0 = 0.1, and |FC| ≥ 1.3. Principal
component analysis plots and volcano plots were created using Perseus software. REACTOME PATHWAY ANALYSIS To identify overrepresented biological pathways based on the observed protein
abundance ratios, Reactome pathway analysis was performed using g:Profiler74,75. Proteins exhibiting significantly increased abundance in lesioned samples as compared to corresponding
unlesioned age-matched control samples (FDR < 0.1, FC ≥ 1.3, s0 = 0.1) were analyzed. Reactome pathways with an adjusted (Bonferroni) _P_-value ≤ 0.05 were considered significantly
enriched. HEATMAPS The zebrafish matrisome was obtained from http://matrisome.org19 and manually updated for missing UniProt identifiers. The updated matrisome list was imported to Perseus
software and matched with the MS dataset to add missing UniProt identifiers, gene symbols, as well as further specifications, including division (core matrisome, matrisome-associated, and
putative matrisome proteins) and protein symbol of mammalian orthologues. The list of matrisome proteins exhibiting significantly altered abundance between lesioned and corresponding
unlesioned age-matched control samples (FDR < 0.1, |FC| ≥ 1.3, s0 = 0.1) was extracted, and the Z-score was calculated. Heatmaps were created using Perseus software. CROSS-SPECIES
COMPARISON OF PROTEOMICS DATA For cross-species comparison of proteomics data, a published dataset from adult Sprague-Dawley rats at seven days post-contusion spinal cord injury (T10 injury
level) and uninjured control T10 spinal cord segments was re-analyzed31,76. LFQ intensity values of ECM-enriched 4 M guanidine spinal cord tissue extracts
(https://data.mendeley.com/datasets/npkwh5vsss/1) were imported to Perseus software. Filters were set to exclude proteins identified by site, matching the reverse database or contaminants.
Additionally, proteins were excluded that did not exhibit valid values for all three replicates of at least one experimental condition (unlesioned, 7 dpl). Proteins exhibiting significantly
altered abundance between lesioned and unlesioned control samples were identified by permutation-based analysis73 with FDR < 0.1, s0 = 0.1, and |FC| ≥ 1.3. A pairwise comparison of the
obtained protein lists using Venny 2.1 software (https://bioinfogp.cnb.csic.es/tools/venny) was performed to identify differentially regulated matrisome proteins between rat and zebrafish77.
IN SITU HYBRIDIZATION (ISH) A detailed protocol for ISH on whole-mount zebrafish larvae with digoxygenin (DIG)-labeled antisense probes has been previously described68. In brief, terminally
anesthetized larvae were fixed in 4% PFA (Thermo Fisher Scientific Cat#28908) in PBS and treated with proteinase K (Invitrogen Cat#25530-049) followed by re-fixation for 15 min in 4% PFA in
PBS. DIG-labeled antisense probes were hybridized overnight at 65 °C. This protocol allows efficient probe penetration in whole-mount preparations of 5 dpf larvae14. Color reaction was
performed after incubation with anti-DIG antibody conjugated to alkaline phosphatase (Sigma-Aldrich Cat#11093274910; RRID:AB_2313640, 1:3000) using NBT/BCIP substrate (Roche
Cat#11697471001). Samples were mounted in 75% glycerol in PBS and imaged in multi-focus mode using a Leica M205 FCA stereo microscope equipped with a Leica DMC6200 C color camera.
Information on ISH probes, including primer sequences used for molecular cloning, is provided in Supplementary Data 1. All ISH probes showed specific staining in developmental domains.
Fluorescence ISH and simultaneous detection of mCherry transcripts and GFP protein on floating sections of larval zebrafish was performed as previously described14. HCR RNA fluorescence ISH
(Molecular Instruments) on adult zebrafish cryosections was performed according to the manufacturer’s instructions. All genes were processed simultaneously. Sections comprising the lesion
core or rostral control tissue of the same animal were stained on the same microscope slide. Sections were mounted in Fluoromount-G with DAPI (Invitrogen Cat#E132139) and imaged using a
Plan-Apochromat 20x/0.8 objective on a Zeiss LSM 980 confocal microscope. Images of all genes were taken with the same settings. Information on HCR ISH probes is provided in Supplementary
Data 1. IMMUNOFLUORESCENCE (IF) A detailed protocol for IF on whole-mount zebrafish larvae has been previously described68. Briefly, terminally anesthetized larvae were fixed in 4% PFA in
PBS for 1 h at room temperature. After removing the head and tail using micro scissors, larvae were permeabilized by subsequent incubation in acetone and proteinase K. Samples were re-fixed
in 4% PFA in PBS, blocked in PBS containing 1% Triton X-100 (Sigma-Aldrich Cat#T8787; PBTx) and 4% bovine serum albumin, and incubated over two to three nights with the primary antibody of
interest. After several washes in PBTx, samples were incubated over two nights with the secondary antibody of interest. Thereafter, samples were washed in PBTx and mounted in 75% glycerol
(Sigma-Aldrich Cat#G5516) in PBS. Imaging was performed using a Plan-Apochromat 20x/0.8 objective on a Zeiss LSM 980 confocal microscope. For neurite outgrowth assay, dorsal root ganglion
(DRG) neuron cultures were fixed in 4% PFA in PBS for 15 min at room temperature. After permeabilization with 0.1% PBTx for 20 min at 37 °C, DRG neurons were blocked with 5% goat serum
(Sigma-Aldrich Cat#G9023) in PBS for 45 min at 37 °C. Neurites were labeled by subsequent incubation with anti-Tubulin β3 antibody in PBS for 2 h and fluorophore-conjugated secondary
antibody in PBS for 1.5 h at 37 °C. DRG neurons were mounted in Fluoromount-G with DAPI and imaged using a Plan-Apochromat 20x/0.8 objective and digital camera system on a Zeiss LSM 980
microscope. IF on mouse and human paraffin-embedded tissue sections was performed as previously described78. Briefly, tissue sections were deparaffinized in xylene (3x for 10 min each),
stepwise hydrated by successive incubation in 100%, 96%, and 70% isopropanol for 5 min each, and rinsed in distilled water. For antigen retrieval, sections were microwaved in citrate buffer
at 850 W for 3 min. The sections were then microwaved twice at 250 W for 10 min each. Sections were allowed to cool down on ice for 15 min. Sections were then rinsed in PBS for 15 min under
gentle agitation. Sections were blocked in 0.1% PBTx containing 3% fetal calf serum (Gibco Cat#A4766801), and either 1% goat (Gibco #Cat16210-064) or donkey (Biowest #CatS2170) serum.
Sections were then sequentially incubated with primary antibodies diluted in blocking solution for 1 h at 37 °C, and fluorophore-conjugated secondary antibodies for 1 h at room temperature.
Imaging was performed using Plan-Apochromat 10x/0.45 M27 and Plan-Apochromat 20x/0.8 objectives on a Zeiss LSM 980 confocal microscope. We used rabbit polyclonal anti-Collagen IV (Abcam
Cat#ab6586; RRID:AB_305584, 1:250), mouse monoclonal anti-Tubulin β3 (TUBB3, Biolegend Cat#801201; RRID:AB_2313773, 1:500), rabbit polyclonal anti-Mpx (GeneTex Cat#GTX128379;
RRID:AB_2885768, 1:300), mouse monoclonal anti-GFAP (clone GA5, Cell Signaling Technology Cat#mAB3670; RRID:AB_561049, 1:300), recombinant rabbit polyclonal anti-GFAP (clone RM1003, Abcam
Cat#ab278054, 1:2000), rabbit monoclonal anti-LUM (Invitrogen Cat#MA5-29402; RRID:AB_2785270, 1:500-1:600), rabbit monoclonal anti-LUM (ThermoFisher Scientific Cat#MA5-34828; RRID:
AB_2848736, 1:600), sheep polyclonal anti-PRELP (R&D Systems Cat#AF6447; RRID:AB_10889844, 1:400), rabbit polyclonal anti-PRELP (ThermoFisher Scientific Cat#PA5-78631; RRID:AB_2736456,
1:300), rabbit polyclonal anti-CHAD (Invitrogen Cat#PA-553761; RRID:AB_2639742, 1:300), mouse monoclonal anti-CHAD (clone 8B7, Thermo Fisher Scientific Cat#H00001101-M01; RRID:AB_530000,
1:300), and sheep polyclonal anti-FMOD (clone 549302, R&D Systems Cat#AF5945; RRID:AB_1964583, 1:600). Secondary fluorophore-conjugated antibodies were from Invitrogen. WHOLE-MOUNT
TUNEL/ANTI-GFP CO-LABELING Terminally anesthetized larvae were fixed in 4% PFA in PBS for overnight at 4 °C. After removing the head and tail using micro scissors, larvae were permeabilized
by subsequent incubation in acetone and proteinase K as described for whole-mount IF. Samples were re-fixed in 4% PFA in PBS and Click-iT TUNEL Alexa Fluor 647 Imaging Assay (Thermo Fisher
Cat#C10247) was performed according to the manufacturer’s protocol to label apoptotic cells. Briefly, samples were equilibrated in TdT reaction buffer for 30 min at room temperature,
followed by incubation in TdT reaction cocktail for overnight at room temperature. The click-it reaction was performed for 60 min at room temperature. Thereafter, samples were blocked in
PBTx containing 3% bovine serum albumin and incubated over three nights with chicken anti-GFP antibody (Abcam Cat#ab13790; RRID:AB_300798, 1:500). After several washes in PBTx, samples were
incubated over two to three nights with the secondary antibody of interest. Thereafter, samples were washed in PBTx and mounted in 75% glycerol in PBS. Imaging was done using a
Plan-Apochromat 10x/0.45 M27 objective on a Zeiss LSM 980 confocal microscope. PRIMARY DORSAL ROOT GANGLIA (DRG) CULTURE/NEURITE OUTGROWTH ASSAY Handling of mice was performed in accordance
with animal welfare laws, complied with ethical guidelines, and was approved by the responsible local committees and government bodies (University of Erlangen, Amt für Veterinärwesen der
Stadt Erlangen, and the Regierung von Unterfranken). Adult female and male (4–6 months old) C57BL/6 J mice were sacrificed by cervical dislocation, and spinal cords were removed. DRG neurons
were dissected from the spinal cord, incubated in Neurobasal medium (NB, Thermo Fisher Scientific Cat#21103049) containing 2.5 mg mL−1 collagenase P (Sigma-Aldrich Cat#11213857001) and
maintained in an incubator for 1 h at 37 °C in 5% CO2. The DRG tissue was homogenized by pipetting using finely fire-polished drawn glass pipettes. Dissociated DRG neurons were separated
from axon stumps and myelin debris via a 14% bovine serum albumin layer (Sigma-Aldrich Cat#A9205) and centrifugation at 1 x g for 8 min. The pellet with DRG neurons was resuspended in NB
containing 20 μL mL−1 B27 supplement 50x (Gibco Cat#17504044), 2 mM Glutamax (ThermoFisher Cat#35050-061), 10 μg mL−1 antibiotic-antimycotic (Gibco Cat#15240062), and 0.01 μg mL−1 nerve
growth factor (ThermoFisher Cat#3257-019). Isolated DRG neurons were seeded on glass coverslips pre-coated with 0.1 mg mL−1 Poly-D-lysine (PDL, Gibco Cat#A3890401), followed by coating with
either 10 µg mL−1 laminin (ThermoFisher Cat#23017015), a mix of 10 µg mL−1 laminin and 5 µg mL−1 of each SLRP protein (recombinant human CHAD (R&D Systems Cat#8218-CH), FMOD (R&D
Systems Cat#9840-FM), LUM (Abcam Cat#ab221400), and PRELP (R&D Systems Cat#6447-PR)), or a mix of 10 µg mL−1 laminin and 5 µg mL−1 CSPGs (Sigma-Aldrich Cat#CC117). For coating of glass
coverslips, a standard protocol was employed that is predicted to apply a monomolecular layer of 3-5 nm thickness79. Alternatively, DRG neurons were seeded on glass coverslips pre-coated
with PDL and laminin and cultured in the presence of either 1 µg mL−1 CSPGs, a mix of 1 µg mL−1 of each SLRP protein, or solvent control. All recombinant SLRP proteins used were produced in
mammalian expression systems. DRG cultures were incubated for 48 h at 37 °C and 5% CO2 to allow neurite outgrowth. CROSS-POLARIZED OPTICAL COHERENCE TOMOGRAPHY (CP-OCT) For in vivo CP-OCT47,
zebrafish larvae were anesthetized in E3 medium containing 0.015% MS-222 and mounted in a lateral position in 1% low gelling temperature agarose (Sigma-Aldrich Cat#A0701) between two
microscope cover glasses. During imaging, larvae were covered with 0.01% MS-222-containing E3 medium to keep preparations from drying out. Cross-polarized images of the spinal lesion site
were acquired using a custom-built CP-OCT system80. Light from a broadband supercontinuum laser (YSL Photonics Cat#SC-OEM) was filtered to acquire a spectrum centered at 885 nm with a full
width at half maximum of 80 nm. The laser was operated at 200 MHz. The filtered spectrum from the laser was coupled to a single-mode optical fiber and collimated using a collimator (Thorlabs
Cat#F230APC-850). The light was further split using a 90/10 beam splitter (Thorlabs Cat#BS025) into a reference beam and a sample beam. The sample was illuminated with 15 mW of optical
power. A combination of a quarter-wave plate (Thorlabs Cat#SAQWP05M-1700) and a lens (Thorlabs Cat#AC254-030-AB) was inserted in the reference and the sample arm to control the polarization
of the light. A galvano mirror (Thorlabs Cat#GVS012) was used to scan the laser beam over the sample. The reflected reference and the sample signals were acquired using a custom-designed
spectrometer consisting of a reflective collimator (Thorlabs Cat#RC08APC), a holographic grating (Wasatch Photonics Cat#1200 l/mm@840 nm), a lens (Thorlabs Cat#AC-254-080-B), and a line scan
camera (Basler Cat#2048 pixels, ral2048-48gm) operating at 25 kHz line scan rate. The spectrometer signal was processed using LabVIEW-based custom-designed software (National Instruments).
The acquired interference spectrum from the camera was spectrally recalibrated from wavelength space to wavenumber space81 and a fast Fourier transform was performed to obtain an axial
profile of the sample. COMBINED CONFOCAL FLUORESCENCE AND BRILLOUIN MICROSCOPY (BM) For in vivo BM, zebrafish larvae were anesthetized in E3 medium containing 0.015% MS-222 and mounted in a
lateral position in 1% low gelling temperature agarose on a 35 mm glass-bottom dish (ibidi Cat#81158). During imaging, larvae were covered with 0.015% MS-222-containing E3 medium to keep
preparations from drying out. Brillouin frequency shift images were acquired by BM employing a confocal configuration and a Brillouin spectrometer consisting of a two-stage virtually imaged
phase array (VIPA) etalon, as previously described in detail elsewhere53. Briefly, the sample was illuminated by a frequency-modulated diode laser beam (_λ_ = 780.24 nm, DLC TA PRO 780,
Toptica), which was stabilized to the D2 transition of rubidium 85Rb. A Fabry-Perot interferometer in two-pass configuration and a monochromatic grating (Toptica) were employed to further
suppress the contribution of amplified spontaneous emission to the laser spectrum. The laser light was coupled into a single-mode fiber and guided into the backside port of a commercial
inverted microscope stand (Axio Observer 7, Zeiss). An objective lens (20x, NA = 0.5, EC Plan-Neofluar, Zeiss) illuminated the sample on a motorized stage with an optical focus. The laser
power at the sample plane was set at 15 mW. The backscattered light from the sample was collected by the same objective lens, coupled into the second single-mode fiber to achieve
confocality, and delivered to a Brillouin spectrometer. In the Brillouin spectrometer, the backscattered light was collimated and passed through a molecular absorption cell filled with
rubidium 85Rb (Precision Glassblowing Cat#TG-ABRB-I85-Q), in which the intensity of the Rayleigh scattered and reflected light was significantly suppressed. After passing through the
molecular absorption cell, the beam was guided to two VIPA etalons (Light Machinery Cat#OP-6721-6743-4) with the free spectral range of 15.2 GHz, which convert the frequency shift of the
light into the angular dispersion in the Brillouin spectrum. The Brillouin spectrum was acquired by a sCMOS camera (Teledyne Cat#Prime BSI), with the exposure time of 0.5 s per measurement
point. The two-dimensional Brillouin frequency map of the injured region was measured by scanning the motorized stage on the microscope stand, with the translational step size of 0.5 µm. The
Brillouin microscope was controlled with custom acquisition software written in C + + (https://github.com/BrillouinMicroscopy/BrillouinAcquisition; version 0.3.4). Confocal fluorescence
imaging was performed in the same region of interest (ROI) as Brillouin measurement using a re-scan confocal microscopy (RCM) module (RCM2, Confocal.nl) that was attached to one side port of
the microscope stand. The RCM module consists of a sCMOS camera (Prime BSI Express, Teledyne) and a multi-line laser unit (Skyra, Cobolt) as an excitation illumination source for four laser
lines (_λ_ = 405 nm, 488 nm, 562 nm, and 637 nm). A pinhole of the diameter of 50 µm and the re-scanning imaging principle82 provides rapid confocal fluorescence imaging with a lateral
resolution of 120 nm. By focusing a confocal fluorescence image in the center of the spinal cord of _elavl3_:GFP-F transgenic zebrafish larvae, the axial plane of Brillouin imaging was
determined. OPTICAL DIFFRACTION TOMOGRAPHY (ODT) For in vivo ODT, zebrafish larvae were anesthetized in E3 medium containing 0.015% MS-222 and mounted in a lateral position in 1% low gelling
temperature agarose on a 35 mm glass-bottom dish (ibidi Cat#81158). During imaging, larvae were covered with E3 medium containing 0.015% MS-222 and 20% of refractive index (RI)-matching
agent Iodaxanol (OptiPrepTM; Sigma-Aldrich Cat#D1556)83. Iodaxanol was used to reduce the RI difference between the zebrafish larvae and the surrounding medium. The final RI of the medium
was 1.351, which was determined by an ABBE refractometer (Kern & Sohn GmbH Cat#ORT1RS). The RI distribution of the zebrafish spinal lesion site was measured by ODT employing Mach-Zehnder
interferometry to measure multiple complex optical fields from various incident angles, as previously described84. A solid-state laser beam (_λ_ = 532 nm, 50 mW, CNI Optoelectronics
Technology Co.) was split into two paths using a beamsplitter. One beam was used as a reference beam and the other beam illuminated the sample on the stage of an inverted microscope (Axio
Observer 7, Carl Zeiss AG) through a tube lens (_f_ = 175 mm) and a water-dipping objective lens (40x, NA = 1.0, Carl Zeiss AG). A high numerical aperture objective lens (40x, water
immersion, NA = 1.2, Carl Zeiss AG) collected the beam diffracted by the sample. To reconstruct a 3D RI tomogram of the sample, the sample was illuminated from 150 different incident angles
scanned by a dual-axis galvano mirror (Thorlabs Cat#GVS212/M) located at the conjugate plane of the sample. The diffracted beam interfered with the reference beam at an image plane and
generated a spatially modulated hologram, which was recorded with a CMOS camera (XIMEA Cat#MQ042MG-CM-TG). The field-of-view of the camera covers 205.0 μm × 205.0 μm. The complex optical
fields of light scattered by the samples were retrieved from the recorded holograms by applying a Fourier transform-based field retrieval algorithm85. The 3D RI distribution of the samples
was reconstructed from the retrieved complex optical fields via the Fourier diffraction theorem, employing the first-order Rytov approximation86,87. A more detailed description of tomogram
reconstruction can be found elsewhere88. The MATLAB script for ODT reconstruction can be found at https://github.com/OpticalDiffractionTomography/ODT_Reconstruction (version 1.0.0). ATOMIC
FORCE MICROSCOPY-BASED NANOINDENTATION MEASUREMENTS (AFM) For AFM measurements, zebrafish larvae were terminally anesthetized by immersion in 0.1% MS-222 in PBS and mounted in an upright
position in 3% low gelling temperature agarose. The trunk tissue was cut transversely using a vibratome to expose the lesion core. The agarose block containing the larva was glued onto a
plastic tissue culture dish. During measurements, larvae were covered with 0.015% MS-222 containing PBS to keep preparations from drying out. AFM measurements were performed using a
Nanowizard 4 (JPK BioAFM, Bruker Nano GmbH). For indentation measurements, 37 µm diameter polystyrene beads (microParticles #CatPS/Q-F-B878) were glued to tipless cantilevers (NanoWorld
#CatARROW-TL1-50) with two-component adhesive (Araldite Rapid #Cat3131.1). Cantilevers (accurate spring constant ranged between 0.027–0.039 N m−1) were calibrated prior to the measurements
using the thermal noise method89. The indentation force was 12 nN, and the indentation speed was 7 μm s−1. The ROI for indentation was identified by fluorescence signal from the rostral
spinal cord stumps in _elavl3_:GFP-F transgenics using an upright Axio Zoom.V16 stereo microscope. QUANTIFICATIONS AND STATISTICS Unless otherwise indicated, controls refer to DOX-treated
clutch mates of wild type, single transgenic Tet-activator or single transgenic Tet-responder genotype. For quantifications, investigators were blinded to the experimental conditions. For
quantification of axonal bridge thickness, transgenic live animals (_elavl3_:GFP-F) were imaged using a Plan-Apochromat 20x/0.8 objective on a Zeiss LSM 980 confocal microscope. The length
of a vertical line that covers the width of the axonal bridge at the center of the lesion site, was then determined using ImageJ software (https://imagej.nih.gov/ij/index.html). The
quantification of the glial bridge thickness was done in _her4.3_:GFP-F transgenics and analogously to the axonal bridge measurements. Measurements of axonal bridge thickness were performed
in samples of three independent experiments. Spinal cord lesions for one out of the three experimental replicates of axonal bridge measurements were induced by a second operator.
Quantification of fluorescence signal in the lesion site was performed on captured images of whole-mount samples using ImageJ software, following previously published protocols14,21.
Confocal image stacks were collapsed before analysis. For the quantification of area coverage of _pdgfrb_:GFP_+_ in the lesion site, collapsed confocal stacks were converted to a binary
image using the automated mean of grey levels thresholding function of ImageJ software. A pre-set ROI of constant size was applied to all images of the same experiment and the number of
pixels determined (pixel area). The ROI was placed in the center of the lesion site and ventrally limited by the notochord. Quantification of _pdgfrb_:GFP+/TUNEL+ cells was performed in a
pre-set ROI of constant size on optical sections of a confocal stack using ImageJ software. The ROI was ventrally limited by the dorsal/caudal artery. _pdgfrb_:GFP+/TUNEL+ cells in the floor
plate or median fin fold were excluded from analysis based on their location and morphology. Quantification of _Mpx_+ cells in the lesion site was performed in a pre-set ROI of constant
size on optical sections of a confocal stack using ImageJ software. The ROI was ventrally limited by the notochord. The neurite length of adult murine DRG neurons was quantified using the
semi-automated SNT Fiji-ImageJ plugin90. The longest neurite of each DRG neuron was identified and measured. Extraction and quantification of Brillouin frequency shifts were performed in a
pre-set ROI, using custom software written in Python (https://github.com/GuckLab/impose, version 0.4.1; https://github.com/BrillouinMicroscopy/BMicro, version0.8.1). The ROI was 40 µm x 20
µm, which corresponds to the determined average axonal bridge thickness and the average distance between the spinal cord stumps following a dorsal incision lesion at 1 dpl. The ROI was
placed in the center of the lesion site and ventrally limited 5 µm dorsal to the notochord. The ROI was applied to all images. Brillouin frequency shifts were measured in samples of at least
three independent experiments. The measured Brillouin frequency shift \({\nu }_{B}\) can be expressed in terms of the longitudinal modulus \(M^{\prime}\), refractive index (RI) \(n\), and
density \(\rho\) of the specimen, as well as the incident wavelength \({\lambda }_{0}\) and scattering angle \(\vartheta\) given by the setup: \({\nu
}_{{{{{{\rm{B}}}}}}}=\frac{2n\,\sqrt{M^{\prime} }}{{\lambda }_{0}\sqrt{\rho }}\sin \frac{\vartheta }{2}\). All measurements were performed in the backscattering configuration with
\(\vartheta=180^\circ\) and, accordingly \(\sin \frac{\vartheta }{2}=1.\) The longitudinal compressibility \({\kappa }_{L}\) may be expressed as the inverse of the longitudinal modulus
\({\kappa }_{L}=\frac{1}{M^{\prime} }\). For the sake of conciseness \({\kappa }_{L}\) will be referred to as ‘compressibility’ in the rest of the text, despite the fact that this term is
usually defined as the inverse of the bulk modulus _K_′. Bulk modulus _K_′, shear modulus _G_′, and longitudinal modulus _M’_ are related by the following equation in the case of an
isotropic sample: \(M^{\prime}=K^{\prime}+\frac{4}{3}G^{\prime}\). To quantify the co-polarization ratio (ratio of preserved polarization to total reflectivity) in the lesion site, two
images of the tissue were acquired; one co-polarized and one cross-polarized image. For the acquisition of the co-polarized image, the angle of the quarter-wave plate (QWP) axis in the
reference path was set in such a way that the light in the sample and the reference arm had the same polarization. To acquire the cross-polarized image, the QWP in the reference beam path
was rotated by 45°, resulting in orthogonal polarization between reference and sample arm. Sample reflectivity \(R\left(z\right)\) and co-polarization ratio \(\delta (z)\) of the sample was
calculated using the amplitude of the co- (_A__co_) and cross- (_A__cross_) polarized images using the following equations:
\(R(z)=\sqrt{{A}_{{{{{{\rm{co}}}}}}}^{2}+{A}_{{{{{{\rm{cross}}}}}}}^{2}}\) and \(\delta (z)=\frac{{A}_{{co}}}{{A}_{{{{{{\rm{co}}}}}}}+{A}_{{{{{{\rm{cross}}}}}}}}\). Using ImageJ software,
the co-polarization ratio was determined in a pre-set ROI of constant size for the averaged intensity projection of the complete image stack. The ROI was placed in the center of the lesion
site and ventrally limited by the notochord. A second independent observer validated the results. Extraction and quantification of the RI and mass density distribution from reconstructed
tomograms were performed using custom-written MATLAB (MathWorks, version R2018b) scripts. The mass density of the samples was calculated directly from the reconstructed RI tomograms, since
the RI of the samples, \(n(x,\, y,\, z)\), is linearly proportional to the mass density of the material, \(\rho (x,\, y,\, z)\), as \(n\left(x,\, y,\, z\right)={n}_{m}+\alpha \rho (x,\, y,\,
z)\), where \({n}_{m}\) is the RI value of the surrounding medium and \(\alpha\) is the RI increment \(({dn}/{dc})\), with \(\alpha\) = 0.1919 mL g−1 for proteins and nucleic acids91,92. RI
and mass density distribution from reconstructed tomograms were evaluated in a pre-set ROI in a sagittal slice of the RI tomogram along the _x_-_y_ plane at the focused plane, using a
custom-written MATLAB script. The ROI was the same as applied to Brillouin and ODT images. Note that the RI was measured in samples independent of those analyzed with BM. AFM
force-indentation analysis was performed using the open-source analysis software PyJibe (https://github.com/afm-analysis/pyjibe; version 0.14.0). The Poisson’s ratio was set to 0.5 for all
analyses. We applied two different fitting models: (i) the Hertz model for a spherical indenter58 with a limitation of the indentation curve to 3 µm, and (ii) the Kelvin─Voigt─Maxwell (KVM)
model93, in order to analyze the apparent Young’s modulus and apparent viscosity. Unless indicated, no data were excluded from analyses. Except for determining effect sizes and Gaussian
propagation of uncertainty, all statistical analyses were performed using Graph Pad Prism 9 (GraphPad Software Inc., version 9.0.0). Mathematica software (Wolfram Research Inc., version
12.2) was used to calculate the Gaussian propagation of uncertainty. All quantitative data were tested for normal distribution using Shapiro-Wilk test. Parametric and non-parametric tests
were used as appropriate. All statistical tests used in each experiment are given in the figure legends or in Supplementary Data 7. We used two-tailed Student’s _t_-test, two-tailed
Mann-Whitney test, paired two-tailed Student’s _t_-test, and Kruskal-Wallis test followed by Dunn’s test for multiple comparisons. Differences were considered statistically significant at
_P_-values below 0.05 and effect sizes (Cohen’s d for Student’s _t_-test, common language effect size \(\theta\) for Mann-Whitney and Dunn’s multiple comparison tests) including the
significance boundary (\({d}_{c}=1,\, {\theta }_{c}=0.5\)) within their uncertainty. The _P_-value, effect size, and respective uncertainty for each experimental group is given in the
figures or Supplementary Data 7. Respective effect sizes were determined according to94 and95 using custom scripts in Mathematica software. Unless indicated, variance for all group’s data is
presented as ± standard error of the mean (SEM). The sample size (_n_) for each experimental group is given in the figure legends or in Supplementary Data 7. Graphs were generated using
GraphPad Prism 9. REPORTING SUMMARY Further information on research design is available in the Nature Portfolio Reporting Summary linked to this article. DATA AVAILABILITY Except for the
proteomics data, all data are available in the main text or the supplementary materials. The shotgun zebrafish MS data generated in this study have been deposited to the ProteomeXchange
Consortium (http://proteomecentral.proteomexchange.org) via the PRIDE partner repository with the dataset identifiers PXD037605 and PXD037590. The shotgun rat proteomic data used in this
study31 are available in the Mendeley database under the accession code 10.17632/npkwh5vsss.1 (https://data.mendeley.com/datasets/npkwh5vsss/1). Source data are provided with this paper.
CODE AVAILABILITY All codes used in this study are available on GitHub: https://github.com/BrillouinMicroscopy/BrillouinAcquisition (version 0.3.4)96; https://github.com/GuckLab/impose
(version 0.4.1)97; https://github.com/BrillouinMicroscopy/BMicro (version 0.8.1)98; https://github.com/OpticalDiffractionTomography/ODT_Reconstruction (version 1.0.0)99;
https://github.com/afm-analysis/pyjibe (version 0.14.0)100. REFERENCES * Blackshaw, S. Why Has the Ability to Regenerate Following CNS Injury Been Repeatedly Lost Over the Course of
Evolution? _Front Neurosci._ 16, 831062 (2022). Article PubMed PubMed Central Google Scholar * Dias, D. O. & Göritz, C. Fibrotic scarring following lesions to the central nervous
system. _Matrix Biol.: J. Int. Soc. Matrix Biol._ 68-69, 561–570 (2018). Article CAS Google Scholar * Francos-Quijorna, I. et al. Chondroitin sulfate proteoglycans prevent immune cell
phenotypic conversion and inflammation resolution via TLR4 in rodent models of spinal cord injury. _Nat. Commun._ 13, 2933 (2022). Article ADS CAS PubMed PubMed Central Google Scholar
* Bradbury, E. J. & Burnside, E. R. Moving beyond the glial scar for spinal cord repair. _Nat. Commun._ 10, 3879 (2019). Article ADS PubMed PubMed Central Google Scholar * Tran, A.
P., Warren, P. M. & Silver, J. New insights into glial scar formation after spinal cord injury. _Cell Tissue Res._ 387, 319–336 (2022). Article PubMed Google Scholar * Bradbury, E. J.
et al. Chondroitinase ABC promotes functional recovery after spinal cord injury. _Nature_ 416, 636–640 (2002). Article ADS CAS PubMed Google Scholar * Cafferty, W. B., Duffy, P.,
Huebner, E. & Strittmatter, S. M. M. A. G. and OMgp synergize with Nogo-A to restrict axonal growth and neurological recovery after spinal cord trauma. _J. Neurosci.: Off. J. Soc.
Neurosci._ 30, 6825–6837 (2010). Article CAS Google Scholar * Stichel, C. C. et al. Inhibition of collagen IV deposition promotes regeneration of injured CNS axons. _Eur. J. Neurosci._
11, 632–646 (1999). Article CAS PubMed Google Scholar * Moeendarbary, E. et al. The soft mechanical signature of glial scars in the central nervous system. _Nat. Commun._ 8, 14787
(2017). Article ADS CAS PubMed PubMed Central Google Scholar * Yu, X. & Bellamkonda, R. V. Dorsal root ganglia neurite extension is inhibited by mechanical and chondroitin
sulfate-rich interfaces. _J. Neurosci. Res._ 66, 303–310 (2001). Article CAS PubMed Google Scholar * Baumann, H. J. et al. Softening of the chronic hemi-section spinal cord injury scar
parallels dysregulation of cellular and extracellular matrix content. _J. Mech. Behav. Biomed. Mater._ 110, 103953 (2020). Article CAS PubMed PubMed Central Google Scholar * Franze, K.
Integrating Chemistry and Mechanics: The Forces Driving Axon Growth. _Annu Rev. Cell Dev. Biol._ 36, 61–83 (2020). Article CAS PubMed Google Scholar * Tsata, V. et al. A switch in
pdgfrb+ cell-derived ECM composition prevents inhibitory scarring and promotes axon regeneration in the zebrafish spinal cord. _Dev. Cell_ 56, 509–524.e509 (2021). Article CAS PubMed
Google Scholar * Wehner, D. et al. Wnt signaling controls pro-regenerative Collagen XII in functional spinal cord regeneration in zebrafish. _Nat. Commun._ 8, 126 (2017). Article ADS
PubMed PubMed Central Google Scholar * Mokalled, M. H. et al. Injury-induced ctgfa directs glial bridging and spinal cord regeneration in zebrafish. _Science_ 354, 630–634 (2016). Article
ADS CAS PubMed PubMed Central Google Scholar * Becker, C. G. et al. L1.1 is involved in spinal cord regeneration in adult zebrafish. _J. Neurosci.: Off. J. Soc. Neurosci._ 24,
7837–7842 (2004). Article CAS Google Scholar * Kroehne, V., Freudenreich, D., Hans, S., Kaslin, J. & Brand, M. Regeneration of the adult zebrafish brain from neurogenic radial
glia-type progenitors. _Development_ 138, 4831–4841 (2011). Article CAS PubMed Google Scholar * Ohnmacht, J. et al. Spinal motor neurons are regenerated after mechanical lesion and
genetic ablation in larval zebrafish. _Development_ 143, 1464–1474 (2016). CAS PubMed PubMed Central Google Scholar * Nauroy P., Hughes S., Naba A. & Ruggiero F. The in-silico
zebrafish matrisome: A new tool to study extracellular matrix gene and protein functions. _Matrix Biol.: J. Int. Soc. Matrix Biol._ 65, 5–13 (2018). * Yu, Y. M. et al. The extracellular
matrix glycoprotein tenascin-C promotes locomotor recovery after spinal cord injury in adult zebrafish. _Neuroscience_ 183, 238–250 (2011). Article CAS PubMed Google Scholar *
Tsarouchas, T. M. et al. Dynamic control of proinflammatory cytokines Il-1beta and Tnf-alpha by macrophages in zebrafish spinal cord regeneration. _Nat. Commun._ 9, 4670 (2018). Article ADS
PubMed PubMed Central Google Scholar * Nelson, C. M. et al. Glucocorticoids Target Ependymal Glia and Inhibit Repair of the Injured Spinal Cord. _Front Cell Dev. Biol._ 7, 56 (2019).
Article PubMed PubMed Central Google Scholar * Schweitzer, J. et al. Tenascin-C is involved in motor axon outgrowth in the trunk of developing zebrafish. _Dev. Dyn.: Off. Publ. Am.
Assoc. Anatomists_ 234, 550–566 (2005). Article CAS Google Scholar * Li Y. et al. Microglia-organized scar-free spinal cord repair in neonatal mice. _Nature_, 587, 613–618 (2020). * Lin,
C. Y., Lee, Y. S., Lin, V. W. & Silver, J. Fibronectin inhibits chronic pain development after spinal cord injury. _J. neurotrauma_ 29, 589–599 (2012). Article PubMed PubMed Central
Google Scholar * Tom, V. J., Doller, C. M., Malouf, A. T. & Silver, J. Astrocyte-associated fibronectin is critical for axonal regeneration in adult white matter. _J. Neurosci.: Off. J.
Soc. Neurosci._ 24, 9282–9290 (2004). Article CAS Google Scholar * Chen, J. et al. The extracellular matrix glycoprotein tenascin-C is beneficial for spinal cord regeneration. _Mol.
Ther._ 18, 1769–1777 (2010). Article CAS PubMed PubMed Central Google Scholar * O’Shea, K. S., Liu, L. H. & Dixit, V. M. Thrombospondin and a 140 kd fragment promote adhesion and
neurite outgrowth from embryonic central and peripheral neurons and from PC12 cells. _Neuron_ 7, 231–237 (1991). Article PubMed Google Scholar * Bray, E. R. et al. Thrombospondin-1
Mediates Axon Regeneration in Retinal Ganglion Cells. _Neuron_ 103, 642–657.e647 (2019). Article CAS PubMed PubMed Central Google Scholar * Hui, S. P., Dutta, A. & Ghosh, S.
Cellular response after crush injury in adult zebrafish spinal cord. _Dev. Dyn.: Off. Publ. Am. Assoc. Anatomists_ 239, 2962–2979 (2010). Article Google Scholar * Didangelos, A. et al.
Rats and axolotls share a common molecular signature after spinal cord injury enriched in collagen-1. bioRxiv 184713, https://doi.org/10.1101/184713 (2017). * Klapka, N. & Muller, H. W.
Collagen matrix in spinal cord injury. _J. neurotrauma_ 23, 422–435 (2006). Article PubMed Google Scholar * Kalluri, R. Basement membranes: structure, assembly and role in tumour
angiogenesis. _Nat. Rev. Cancer_ 3, 422–433 (2003). Article CAS PubMed Google Scholar * Didangelos, A. et al. High-throughput proteomics reveal alarmins as amplifiers of tissue pathology
and inflammation after spinal cord injury. _Sci. Rep._ 6, 21607 (2016). Article ADS CAS PubMed PubMed Central Google Scholar * Tica, J., Bradbury, E. J. & Didangelos, A. Combined
Transcriptomics, Proteomics and Bioinformatics Identify Drug Targets in Spinal Cord Injury. _Int. J. Mol. Sci._ 19, 1461 (2018). * Chen, S. & Birk, D. E. The regulatory roles of small
leucine-rich proteoglycans in extracellular matrix assembly. _Febs J._ 280, 2120–2137 (2013). Article CAS PubMed PubMed Central Google Scholar * Dervan, A. G. & Roberts, B. L.
Reaction of spinal cord central canal cells to cord transection and their contribution to cord regeneration. _J. Comp. Neurol._ 458, 293–306 (2003). Article PubMed Google Scholar * Nona,
S. N. & Stafford, C. A. Glial repair at the lesion site in regenerating goldfish spinal cord: an immunohistochemical study using species-specific antibodies. _J. Neurosci. Res._ 42,
350–356 (1995). Article CAS PubMed Google Scholar * Shen, Y. et al. PTPsigma is a receptor for chondroitin sulfate proteoglycan, an inhibitor of neural regeneration. _Science_ 326,
592–596 (2009). Article ADS CAS PubMed PubMed Central Google Scholar * Domeniconi, M. et al. Myelin-associated glycoprotein interacts with the Nogo66 receptor to inhibit neurite
outgrowth. _Neuron_ 35, 283–290 (2002). Article CAS PubMed Google Scholar * Fournier, A. E., GrandPre, T. & Strittmatter, S. M. Identification of a receptor mediating Nogo-66
inhibition of axonal regeneration. _Nature_ 409, 341–346 (2001). Article ADS CAS PubMed Google Scholar * Peri, F. & Nusslein-Volhard, C. Live imaging of neuronal degradation by
microglia reveals a role for v0-ATPase a1 in phagosomal fusion in vivo. _Cell_ 133, 916–927 (2008). Article CAS PubMed Google Scholar * Zeng, C. W., Kamei, Y., Shigenobu, S., Sheu, J. C.
& Tsai, H. J. Injury-induced Cavl-expressing cells at lesion rostral side play major roles in spinal cord regeneration. _Open Biol._ 11, 200304 (2021). Article CAS PubMed PubMed
Central Google Scholar * Pang, X., Dong, N. & Zheng, Z. Small Leucine-Rich Proteoglycans in Skin Wound Healing. _Front. Pharm._ 10, 1649 (2020). Article Google Scholar * Lopez, S. G.
& Bonassar, L. J. The role of SLRPs and large aggregating proteoglycans in collagen fibrillogenesis, extracellular matrix assembly, and mechanical function of fibrocartilage. _Connect
Tissue Res._ 63, 269–286 (2022). Article CAS PubMed Google Scholar * Kuranov, R. et al. Complementary use of cross-polarization and standard OCT for differential diagnosis of
pathological tissues. _Opt. Express._ 10, 707–713 (2002). Article ADS PubMed Google Scholar * Schmitt, J. M. & Xiang, S. H. Cross-polarized backscatter in optical coherence
tomography of biological tissue. _Opt. Lett._ 23, 1060–1062 (1998). Article ADS CAS PubMed Google Scholar * Prevedel, R., Diz-Munoz, A., Ruocco, G. & Antonacci, G. Brillouin
microscopy: an emerging tool for mechanobiology. _Nat. Methods_ 16, 969–977 (2019). Article CAS PubMed Google Scholar * Antonacci, G. et al. Recent progress and current opinions in
Brillouin microscopy for life science applications. _Biophys. Rev._ 12, 615–624 (2020). Article PubMed PubMed Central Google Scholar * Scarcelli, G. et al. Noncontact three-dimensional
mapping of intracellular hydromechanical properties by Brillouin microscopy. _Nat. Methods_ 12, 1132–1134 (2015). Article CAS PubMed PubMed Central Google Scholar * Riquelme-Guzman, C.
et al. In vivo assessment of mechanical properties during axolotl development and regeneration using confocal Brillouin microscopy. _Open Biol._ 12, 220078 (2022). Article CAS PubMed
PubMed Central Google Scholar * Bevilacqua, C., Sanchez-Iranzo, H., Richter, D., Diz-Munoz, A. & Prevedel, R. Imaging mechanical properties of sub-micron ECM in live zebrafish using
Brillouin microscopy. _Biomed. Opt. Express_ 10, 1420–1431 (2019). Article CAS PubMed PubMed Central Google Scholar * Schlüssler, R. et al. Mechanical Mapping of Spinal Cord Growth and
Repair in Living Zebrafish Larvae by Brillouin Imaging. _Biophys. J._ 115, 911–923 (2018). Article ADS PubMed PubMed Central Google Scholar * Itoh, Y., Sahni, V., Shnider, S. J., McKee,
H. & Macklis, J. D. Inter-axonal molecular crosstalk via Lumican proteoglycan sculpts murine cervical corticospinal innervation by distinct subpopulations. _Cell Rep._ 42, 112182
(2023). Article CAS PubMed PubMed Central Google Scholar * Dias, D. O. et al. Reducing Pericyte-Derived Scarring Promotes Recovery after Spinal Cord Injury. _Cell_ 173, 153–165.e122
(2018). Article CAS PubMed PubMed Central Google Scholar * Milich, L. M. et al. Single-cell analysis of the cellular heterogeneity and interactions in the injured mouse spinal cord. _J.
Exp. Med._ 218, e20210040 (2021). * Eze, U. C., Bhaduri, A., Haeussler, M., Nowakowski, T. J. & Kriegstein, A. R. Single-cell atlas of early human brain development highlights
heterogeneity of human neuroepithelial cells and early radial glia. _Nat. Neurosci._ 24, 584–594 (2021). Article CAS PubMed PubMed Central Google Scholar * Möllmert, S. et al. Zebrafish
Spinal Cord Repair Is Accompanied by Transient Tissue Stiffening. _Biophys. J._ 118, 448–463 (2020). Article ADS PubMed Google Scholar * Long, K. R. et al. Extracellular Matrix
Components HAPLN1, Lumican, and Collagen I Cause Hyaluronic Acid-Dependent Folding of the Developing Human Neocortex. _Neuron_ 99, 702–719.e706 (2018). Article CAS PubMed Google Scholar
* Alestrom, P. et al. Zebrafish: Housing and husbandry recommendations. _Lab Anim_, https://doi.org/10.1177/0023677219869037 (2019). * Ando, K. et al. Clarification of mural cell coverage of
vascular endothelial cells by live imaging of zebrafish. _Development_ 143, 1328–1339 (2016). CAS PubMed PubMed Central Google Scholar * Asakawa, K. et al. Genetic dissection of neural
circuits by Tol2 transposon-mediated Gal4 gene and enhancer trapping in zebrafish. _Proc. Natl Acad. Sci. USA_ 105, 1255–1260 (2008). Article ADS CAS PubMed PubMed Central Google
Scholar * Davison, J. M. et al. Transactivation from Gal4-VP16 transgenic insertions for tissue-specific cell labeling and ablation in zebrafish. _Dev. Biol._ 304, 811–824 (2007). Article
CAS PubMed PubMed Central Google Scholar * Freeman, J. et al. Mapping brain activity at scale with cluster computing. _Nat. Methods_ 11, 941–950 (2014). Article CAS PubMed Google
Scholar * Wehner, D., Jahn, C. & Weidinger, G. Use of the TetON System to Study Molecular Mechanisms of Zebrafish Regeneration. _J. Vis. Exp.: JoVE_ 100, e52756 (2015). * Knopf, F. et
al. Dually inducible TetON systems for tissue-specific conditional gene expression in zebrafish. _Proc. Natl Acad. Sci. USA_ 107, 19933–19938 (2010). Article ADS CAS PubMed PubMed
Central Google Scholar * Suster, M. L., Kikuta, H., Urasaki, A., Asakawa, K. & Kawakami, K. Transgenesis in zebrafish with the tol2 transposon system. _Methods Mol. Biol._ 561, 41–63
(2009). Article CAS PubMed Google Scholar * John, N., Kolb, J. & Wehner, D. Mechanical spinal cord transection in larval zebrafish and subsequent whole-mount histological processing.
_STAR Protoc._ 3, 101093 (2022). Article PubMed PubMed Central Google Scholar * Becker, T., Wullimann, M. F., Becker, C. G., Bernhardt, R. R. & Schachner, M. Axonal regrowth after
spinal cord transection in adult zebrafish. _J. Comp. Neurol._ 377, 577–595 (1997). Article CAS PubMed Google Scholar * Schiller, H. B. et al. Time- and compartment-resolved proteome
profiling of the extracellular niche in lung injury and repair. _Mol. Syst. Biol._ 11, 819 (2015). Article PubMed PubMed Central Google Scholar * Cox, J. & Mann, M. MaxQuant enables
high peptide identification rates, individualized p.p.b.-range mass accuracies and proteome-wide protein quantification. _Nat. Biotechnol._ 26, 1367–1372 (2008). Article CAS PubMed Google
Scholar * Tyanova, S. & Cox, J. Perseus: A Bioinformatics Platform for Integrative Analysis of Proteomics Data in Cancer Research. _Methods Mol. Biol._ 1711, 133–148 (2018). Article
CAS PubMed Google Scholar * Tusher, V. G., Tibshirani, R. & Chu, G. Significance analysis of microarrays applied to the ionizing radiation response. _Proc. Natl Acad. Sci. USA_ 98,
5116–5121 (2001). Article ADS CAS PubMed PubMed Central MATH Google Scholar * Raudvere, U. et al. g:Profiler: a web server for functional enrichment analysis and conversions of gene
lists (2019 update). _Nucleic Acids Res._ 47, W191–W198 (2019). Article CAS PubMed PubMed Central Google Scholar * Jassal, B. et al. The reactome pathway knowledgebase. _Nucleic Acids
Res._ 48, D498–D503 (2020). CAS PubMed Google Scholar * Didangelos A. & Roschitzki B. 4M Guanidine RAW Files 3CON and 3INJ. _Mendeley Data_ V1,
https://doi.org/10.17632/npkwh17635vsss.17631 (2018). * Oliveros, J. C. Venny. An interactive tool for comparing lists with Venn’s diagrams.,
https://bioinfogp.cnb.csic.es/tools/venny/index.html (2007-2015). * Jablonski, J. et al. Experimental Epileptogenesis in a Cell Culture Model of Primary Neurons from Rat Brain: A Temporal
Multi-Scale Study. _Cells_ 10, 3004 (2021). * Bougas, K., Stenport, V. F., Currie, F. & Wennerberg, A. Laminin Coating Promotes Calcium Phosphate Precipitation on Titanium Discs in
vitro. _J. Oral. Maxillofac. Res_. 2, e5 (2012). PubMed PubMed Central Google Scholar * Hartl, G. R., Parmar, A., Sharma, G. & Singh, K. Cross-Polarized Optical Coherence Tomography
System with Unpolarized Light. _Photonics_ 9, 76 (2022). Article Google Scholar * Singh, K., Sharma, G. & Tearney, G. J. Estimation and compensation of dispersion for a high-resolution
optical coherence tomography system. _J. Opt._ 20, 025301 (2018). Article Google Scholar * De Luca, G. M. R. et al. Re-scan confocal microscopy: scanning twice for better resolution.
_Biomed. Opt. Express_ 4, 2644–2656 (2013). Article PubMed PubMed Central Google Scholar * Boothe, T. et al. A tunable refractive index matching medium for live imaging cells, tissues
and model organisms. _eLife_ 6, e27240 (2017). * Kim, K. & Guck, J. The Relative Densities of Cytoplasm and Nuclear Compartments Are Robust against Strong Perturbation. _Biophys. J._
119, 1946–1957 (2020). Article ADS CAS PubMed PubMed Central Google Scholar * Cuche, E., Marquet, P. & Depeursinge, C. Spatial filtering for zero-order and twin-image elimination
in digital off-axis holography. _Appl. Opt._ 39, 4070–4075 (2000). Article ADS CAS PubMed Google Scholar * Wolf, E. Three-dimensional structure determination of semi-transparent objects
from holographic data. _Opt. Commun._ 1, 153–156 (1969). Article ADS Google Scholar * Sung, Y. et al. Optical diffraction tomography for high resolution live cell imaging. _Opt. Express_
17, 266–277 (2009). Article ADS CAS PubMed Google Scholar * Kim, K. et al. High-resolution three-dimensional imaging of red blood cells parasitized by Plasmodium falciparum and in situ
hemozoin crystals using optical diffraction tomography. _J. Biomed. Opt._ 19, 011005 (2014). ADS PubMed Google Scholar * Butt, H. J. & Jaschke, M. Calculation of thermal noise in
atomic force microscopy. _Nanotechnology_ 6, 1 (1995). Article ADS Google Scholar * Arshadi, C., Gunther, U., Eddison, M., Harrington, K. I. S. & Ferreira, T. A. SNT: a unifying
toolbox for quantification of neuronal anatomy. _Nat. Methods_ 18, 374–377 (2021). Article CAS PubMed Google Scholar * Barer, R. Interference Microscopy and Mass Determination. _Nature_
169, 366–367 (1952). * Zhao, H., Brown, P. H. & Schuck, P. On the distribution of protein refractive index increments. _Biophys. J._ 100, 2309–2317 (2011). Article ADS CAS PubMed
PubMed Central Google Scholar * Abuhattum, S. et al. An explicit model to extract viscoelastic properties of cells from AFM force-indentation curves. _iScience_ 25, 104016 (2022). Article
ADS CAS PubMed PubMed Central Google Scholar * Perme, M. P. & Manevski, D. Confidence intervals for the Mann–Whitney test. _Stat. Methods Med. Res._ 28, 3755–3768 (2019). Article
MathSciNet PubMed Google Scholar * Cohen, J. In: _Statistical Power Analysis for the Behavioral Sciences_ (ed Cohen J.). Routledge (1988). * Schlüßler R. BrillouinAcquisition 0.3.4.
https://doi.org/10.5281/zenodo.8336463 (2023). * Müller P., Schlüßler R. GuckLab/impose: Impose 0.4.6. https://doi.org/10.5281/zenodo.8329103 (2023). * Schlüßler R., Baer M., Müller P.
BrillouinMicroscopy/BMicro: BMicro 0.8.2. https://doi.org/10.5281/zenodo.8329129 (2023). * Kim, K. OpticalDiffractionTomography/ODT_Reconstruction: ODT Tomogram Reconstruction.
https://doi.org/10.5281/zenodo.8341300 (2023). * Müller, P. AFM-analysis/PyJibe: PyJibe 0.14.1, https://doi.org/10.5281/zenodo.8329158 (2023). Download references ACKNOWLEDGEMENTS The
authors gratefully acknowledge the International Spinal Cord Injury Biobank (ISCIB) for generously providing the human spinal cord specimens used in this project, Dr. Johann Helmut
Brandstätter (Biology Department, FAU Erlangen-Nürnberg) for providing mice, and Dr. Catherina Becker for sharing _her4.3_:GFP-F transgenic fish. We thank Casandra Cecilia Carrillo Mendez
and Olga Stelmakh for excellent fish care, Dr. Jona Kayser and Dr. Catherine Xu for comments on the manuscript. The authors acknowledge financial support from the Else
Kröner-Fresenius-Stiftung (to K.Ko.), the Hellenic Foundation for Research and Innovation (H.F.R.I – 7903 grant to V.T.), the Deutsche Forschungsgemeinschaft (project number 460333672 –
CRC1540 Exploring Brain Mechanics (subproject B03, B05, and C03) to J.G., S.M., D.W., and K.Ko.; FR2758/3-1 to R.F.; GU612/8-1 to J.G.; project number 527729149 to D.W.), the Max Planck
Society (to J.G.), the Research Foundation – Flanders (FWO Research Grant G097818N to A.T.), the GSKE/FMRE Queen Elizabeth Medical Foundation for Neuroscience (Young Investigator Grant to
A.T.), and the Wings for Life Spinal Cord Research Foundation (grant 03371AYTA to A.T.). Mouse, rat, and human icons were created using BioRender. FUNDING Open Access funding enabled and
organized by Projekt DEAL. AUTHOR INFORMATION Author notes * These authors contributed equally: Vasiliki Tsata, Nora John. AUTHORS AND AFFILIATIONS * Max Planck Institute for the Science of
Light, 91058, Erlangen, Germany Julia Kolb, Nora John, Kyoohyun Kim, Conrad Möckel, Gonzalo Rosso, Asha Parmar, Gargi Sharma, Shada Abuhattum, Olga Lyraki, Timon Beck, Paul Müller, Stephanie
Möllmert, Kanwarpal Singh, Jochen Guck & Daniel Wehner * Max-Planck-Zentrum für Physik und Medizin, 91058, Erlangen, Germany Julia Kolb, Nora John, Kyoohyun Kim, Conrad Möckel, Gonzalo
Rosso, Asha Parmar, Shada Abuhattum, Olga Lyraki, Timon Beck, Paul Müller, Stephanie Möllmert, Kanwarpal Singh, Jochen Guck & Daniel Wehner * Department of Biology, Animal Physiology,
Friedrich-Alexander-University Erlangen-Nürnberg, 91058, Erlangen, Germany Julia Kolb, Nora John, Olga Lyraki & Renato Frischknecht * Experimental Surgery, Clinical and Translational
Research Center, Biomedical Research Foundation Academy of Athens, 11527, Athens, Greece Vasiliki Tsata & Dimitris Beis * Center of Basic Research, Biomedical Research Foundation,
Academy of Athens, 11527, Athens, Greece Vasiliki Tsata * Department of Physics, Friedrich-Alexander-University Erlangen-Nürnberg, 91058, Erlangen, Germany Conrad Möckel, Asha Parmar,
Kanwarpal Singh & Jochen Guck * Department of Neuropathology, Universitätsklinikum Erlangen, Friedrich-Alexander-University Erlangen-Nürnberg, 91054, Erlangen, Germany Veronika Kurbel,
Kristina Karandasheva, Ingmar Blümcke & Katja Kobow * Department of Medicine 1, Universitätsklinikum Erlangen, Friedrich-Alexander-University Erlangen-Nürnberg, 91054, Erlangen, Germany
Gargi Sharma * Biotechnology Center, Center for Molecular and Cellular Bioengineering, Technische Universität Dresden, 01307, Dresden, Germany Raimund Schlüßler * Mass Spectrometry Core
Facility, Max Planck Institute of Biochemistry, 82152, Martinsried, Germany Anja Wehner, Nicole Krombholz & Barbara Steigenberger * Laboratory of Biological Chemistry, Faculty of
Medicine, School of Health Sciences, University of Ioannina, 45110, Ioannina, Greece Dimitris Beis * VIB-Neuroelectronics Research Flanders, 3001, Leuven, Belgium Aya Takeoka * Department of
Neuroscience and Leuven Brain Institute, KU Leuven, 3000, Leuven, Belgium Aya Takeoka Authors * Julia Kolb View author publications You can also search for this author inPubMed Google
Scholar * Vasiliki Tsata View author publications You can also search for this author inPubMed Google Scholar * Nora John View author publications You can also search for this author
inPubMed Google Scholar * Kyoohyun Kim View author publications You can also search for this author inPubMed Google Scholar * Conrad Möckel View author publications You can also search for
this author inPubMed Google Scholar * Gonzalo Rosso View author publications You can also search for this author inPubMed Google Scholar * Veronika Kurbel View author publications You can
also search for this author inPubMed Google Scholar * Asha Parmar View author publications You can also search for this author inPubMed Google Scholar * Gargi Sharma View author publications
You can also search for this author inPubMed Google Scholar * Kristina Karandasheva View author publications You can also search for this author inPubMed Google Scholar * Shada Abuhattum
View author publications You can also search for this author inPubMed Google Scholar * Olga Lyraki View author publications You can also search for this author inPubMed Google Scholar *
Timon Beck View author publications You can also search for this author inPubMed Google Scholar * Paul Müller View author publications You can also search for this author inPubMed Google
Scholar * Raimund Schlüßler View author publications You can also search for this author inPubMed Google Scholar * Renato Frischknecht View author publications You can also search for this
author inPubMed Google Scholar * Anja Wehner View author publications You can also search for this author inPubMed Google Scholar * Nicole Krombholz View author publications You can also
search for this author inPubMed Google Scholar * Barbara Steigenberger View author publications You can also search for this author inPubMed Google Scholar * Dimitris Beis View author
publications You can also search for this author inPubMed Google Scholar * Aya Takeoka View author publications You can also search for this author inPubMed Google Scholar * Ingmar Blümcke
View author publications You can also search for this author inPubMed Google Scholar * Stephanie Möllmert View author publications You can also search for this author inPubMed Google Scholar
* Kanwarpal Singh View author publications You can also search for this author inPubMed Google Scholar * Jochen Guck View author publications You can also search for this author inPubMed
Google Scholar * Katja Kobow View author publications You can also search for this author inPubMed Google Scholar * Daniel Wehner View author publications You can also search for this author
inPubMed Google Scholar CONTRIBUTIONS Conceptualization: D.W.; Formal analysis: J.K., K.K., A.P., C.M., G.S., K.S., S.A., D.W.; Investigation: J.K., V.T., N.J., K.K., C.M., O.L., S.M.,
G.R., V.K., A.P., G.S., K.Ka.; T.B., R.F., A.W., N. K., B.S., K.S., K.Ko., D.W.; Methodology: J.K., K.K., S.M., A.W., N.K., B.S., K.S., D.W.; Project administration: D.W.; Resources: A.T.,
D.B., I.B., B.S., K.S., J.G., K.Ko. D.W.; Software: K.K., P.M., R.S.; Supervision: K.Ko., D.W.; Visualization: J.K., D.W.; Writing—original draft: J.K., D.W.; Writing—review and editing:
J.K., N.J., K.K., C.M., T.B., D.B., A.T., I.B., J.G., K.Ko., D.W. CORRESPONDING AUTHOR Correspondence to Daniel Wehner. ETHICS DECLARATIONS COMPETING INTERESTS The authors declare no
competing interests. PEER REVIEW PEER REVIEW INFORMATION _Nature Communications_ thanks Konstantinos Ampatzis and the other, anonymous, reviewer(s) for their contribution to the peer review
of this work. A peer review file is available. ADDITIONAL INFORMATION PUBLISHER’S NOTE Springer Nature remains neutral with regard to jurisdictional claims in published maps and
institutional affiliations. SUPPLEMENTARY INFORMATION SUPPLEMENTARY INFORMATION PEER REVIEW FILE DESCRIPTION OF ADDITIONAL SUPPLEMENTARY FILES SUPPLEMENTARY DATA 1 SUPPLEMENTARY DATA 2
SUPPLEMENTARY DATA 3 SUPPLEMENTARY DATA 4 SUPPLEMENTARY DATA 5 SUPPLEMENTARY DATA 6 SUPPLEMENTARY DATA 7 REPORTING SUMMARY SOURCE DATA SOURCE DATA RIGHTS AND PERMISSIONS OPEN ACCESS This
article is licensed under a Creative Commons Attribution 4.0 International License, which permits use, sharing, adaptation, distribution and reproduction in any medium or format, as long as
you give appropriate credit to the original author(s) and the source, provide a link to the Creative Commons licence, and indicate if changes were made. The images or other third party
material in this article are included in the article’s Creative Commons licence, unless indicated otherwise in a credit line to the material. If material is not included in the article’s
Creative Commons licence and your intended use is not permitted by statutory regulation or exceeds the permitted use, you will need to obtain permission directly from the copyright holder.
To view a copy of this licence, visit http://creativecommons.org/licenses/by/4.0/. Reprints and permissions ABOUT THIS ARTICLE CITE THIS ARTICLE Kolb, J., Tsata, V., John, N. _et al._ Small
leucine-rich proteoglycans inhibit CNS regeneration by modifying the structural and mechanical properties of the lesion environment. _Nat Commun_ 14, 6814 (2023).
https://doi.org/10.1038/s41467-023-42339-7 Download citation * Received: 22 February 2023 * Accepted: 04 October 2023 * Published: 26 October 2023 * DOI:
https://doi.org/10.1038/s41467-023-42339-7 SHARE THIS ARTICLE Anyone you share the following link with will be able to read this content: Get shareable link Sorry, a shareable link is not
currently available for this article. Copy to clipboard Provided by the Springer Nature SharedIt content-sharing initiative