- Select a language for the TTS:
- UK English Female
- UK English Male
- US English Female
- US English Male
- Australian Female
- Australian Male
- Language selected: (auto detect) - EN
Play all audios:
ABSTRACT Billions of animals migrate to track seasonal pulses in resources. Optimally timing migration is a key strategy, yet the ability of animals to compensate for phenological mismatches
en route is largely unknown. Using GPS movement data collected from 72 adult female deer over a 10-year duration, we study a population of mule deer (_Odocoileus hemionus_) in Wyoming that
lack reliable cues on their desert winter range, causing them to start migration 70 days ahead to 52 days behind the wave of spring green-up. We show that individual deer arrive at their
summer range within an average 6-day window by adjusting movement speed and stopover use. Late migrants move 2.5 times faster and spend 72% less time on stopovers than early migrants, which
allows them to catch the green wave. Our findings suggest that ungulates, and potentially other migratory species, possess cognitive abilities to recognize where they are in space and time
relative to key resources. Such behavioral capacity may allow migratory taxa to maintain foraging benefits amid rapidly changing phenology. SIMILAR CONTENT BEING VIEWED BY OTHERS PURSUIT AND
ESCAPE DRIVE FINE-SCALE MOVEMENT VARIATION DURING MIGRATION IN A TEMPERATE ALPINE UNGULATE Article Open access 02 July 2024 THE INFLUENCE OF SOCIAL CUES ON TIMING OF ANIMAL MIGRATIONS
Article 24 October 2022 RUSH OR RELAX: MIGRATION TACTICS OF A NOCTURNAL INSECTIVORE IN RESPONSE TO ECOLOGICAL BARRIERS Article Open access 23 March 2022 INTRODUCTION Each year, animals
worldwide migrate across vast landscapes and seascapes to exploit seasonal resources, escape severe weather, breed, avoid predation, or derive other benefits1. To maximize energetic gain
during migration, many animals synchronize their movements with ephemeral peaks in resource quality or abundance2,3,4. Resource tracking is a key benefit of migration because it promotes
nutritional gain, survival, and reproductive success5,6. To match their movements with resource phenology, migratory animals often rely on changes in local conditions (i.e., proximate
cues)2,3. For example, some Neotropical birds use the flowering phenology of honey mesquite (_Prosopis glandulosa_) to initiate their spring migrations with peaks in arthropod abundance7.
Proximate cues, however, may fail to reflect resource phenology further along a migratory route or distant seasonal range, which can cause animals to become mismatched from peaks in resource
phenology during migration2,3. When individuals lack the behavioral plasticity to alter their movements en route, migratory taxa can suffer reduced demographic performance and population
decline from phenological mismatch8,9,10. Climate change is altering patterns of resource phenology, while the expanding human footprint can decouple animal migration from key
resources11,12. Together, these rapid environmental changes are expected to cause dramatic, and potentially detrimental, phenological mismatches for migratory taxa3,5,11. For example, birds,
ungulates, ursids, fish, and cephalopods are altering the timing of migration in response to climate change but at different rates than their primary food5,11,13. Adjusting movement en
route may be the most rapid and least costly way for many migratory taxa to behaviorally compensate for phenological mismatches, facilitating their adaptation to a rapidly changing world3,11
(but see14,15). Behavioral compensation is likely beneficial for migratory animals that only have a short time to capitalize on fleeting resources, because without compensation, dramatic
changes in weather, resource phenology, and reliability of cues would carry substantial fitness costs3,11. Most previous studies that have explored behavioral compensation during migration,
however, focus on the ability of animals to compensate for spatial drift when crosswinds or ocean currents push animals off their migratory trajectory16. Aside from a few examples in
migratory birds17,18, the ability of animals to compensate when they drift temporally rather than spatially off course remains undocumented for most migratory taxa11,19. Large herbivores,
including ungulates, acquire high-quality forage by tracking fleeting waves of emerging plants during migration, which is known as “green wave surfing” (i.e., the Green Wave
Hypothesis20,21). By tracking the wave of green-up across a landscape, migrating ungulates can continually access new plant growth that is highly nutritious and easy to digest21. Previous
research indicates that temperate ungulates often initiate spring migration when green-up begins on winter range, allowing them to track peaks in forage quality during spring
migration22,23,24. Strong behavioral responses to plant phenology often facilitate synchronous departure from winter range among individuals22,23,25. Asynchronous migration may occur,
however, when changes in local environmental conditions are subtle and do not correspond to conditions occurring further along the migration trajectory (i.e., the resource gradient is weak,
noisy or absent at the beginning of migration)25. When conditions change and cues become unreliable, the ability of animals to resynchronize their movements with resource phenology will
likely underpin the foraging benefits of spring migration. To study behavioral compensation for phenological mismatches en route, we took advantage of a unique system where mule deer
(_Odocoileus hemionus_) wintering in a desert ecosystem initiated spring migration anywhere from 1–103 days apart. From 2011–2020, we collected GPS movement data from 72 adult female mule
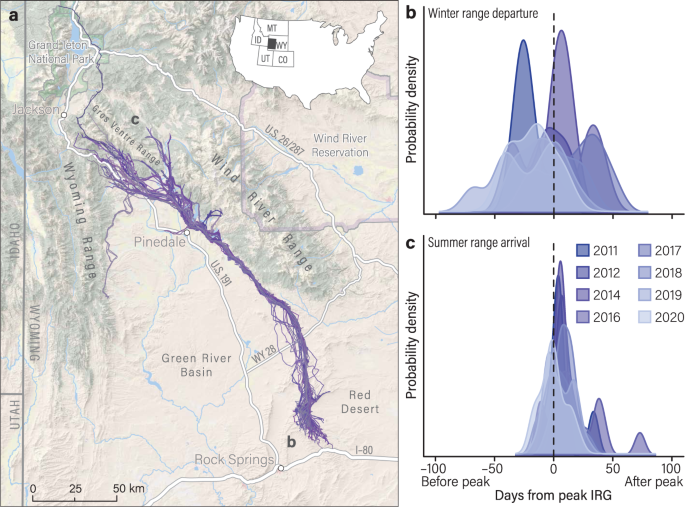
deer (>1-yr-old) that spent winter in the Red Desert of south-central Wyoming, USA and migrated long distances (134–293 km) to high-elevation summer ranges (Fig. 1a). Over the 10-year
duration of the study, deer often began migration far ahead or far behind the green wave (Figs. 2 and 3), allowing us to investigate if and how deer resynchronize their movements with peak
green-up en route. RESULTS TRIGGERS OF SPRING MIGRATION AND CUE RELIABILITY Long-distance migrants departed winter range asynchronously with some individuals starting spring migration in
mid-February (2 months ahead of peak forage quality) and other individuals starting spring migration in early June (1.5 months behind peak forage quality; Figs. 1b, 2; Supplementary Tables
1, 2). Migration distance and intrinsic factors, including age and pregnancy, did not explain variation in the start of spring migration (although nutritional condition weakly influenced
when deer departed their winter range; Supplementary Fig. 1; Supplementary Table 3). We tested for potential environmental cues that could influence an animal’s decision to migrate and found
weak responses to plant phenology and temperature (Supplementary Discussion; Supplementary Table 4). To quantify cue reliability across space, we examined the rate of change in green-up
along the migratory route. In 5 of the 8 tracking years where analysis was possible, there was either a negative rate of change in green-up or no correlation between the date of peak
green-up and distance over the first 32 km of the migration (_p_ = 0.08–0.92), meaning that the green wave was nonexistent or propagated backwards over this segment of the route (Fig. 4a;
Supplementary Table 5). Thus, on the desert winter range and during early portions of the 240-km migration, spring green-up does not move as a wave, making it difficult to track even if
local environmental cues were used to initiate migration. Although the underlying mechanisms that influence the start of spring migration are unclear, mule deer departed winter ranges at
markedly different times relative to peak green-up. The unique variation among individuals in the onset of migration creates the opportunity to evaluate whether deer can perceive their own
location in space and time relative to the green wave (e.g., ahead or behind peak green-up) and behaviorally adjust their movements en route to compensate for initial phenological
mismatches. BEHAVIORAL COMPENSATION EN ROUTE Using the distribution of the start date of spring migration, we classified deer as early migrants (≤25% quartile; _n_ = 47 animal-years),
mid-migrants (>25% and <75% quartiles; _n_ = 58 animal-years), and late migrants (≥75% quartile; _n_ = 47 animal-years; Supplementary Table 6). Early migrants traveled 186 ± 8 km (_x̄_
± 95% CI) over a period of 72 ± 6 days. Mid-migrants traveled 189 ± 5 km over a period of 48 ± 4 days. Late migrants traveled 188 ± 6 km over a period of 31 ± 5 days. Of the _n_ = 48 deer
that had more than two years of GPS data, 60% of deer (_n_ = 29) were not consistent across years in whether they were early, mid, or late migrants. We evaluated whether mule deer
compensated for phenological mismatches with the green wave by comparing the synchronicity of an individual’s movements to the green wave at both the start and end of migration, and during
the entire spring migration. We calculated the difference in days between the date of each GPS location and the date of peak Instantaneous Rate of Green-up (IRG) at each location along the
route (hereafter referred to as Days-From-Peak21). According to the Green Wave Hypothesis, ungulates are assumed to obtain maximum foraging benefits when they occupy habitats on the day of
peak IRG (Days-From-Peak = 0)26. Early migrants started spring migration 30 ± 5 days (_x̄_ ± 95% CI) ahead of the green wave but began to match their movements with peak forage quality
approximately 57 km from their winter range (Fig. 2). By the time they arrived at their summer range, early migrants were only 4 ± 3 days behind the green wave, 26 days closer than when they
started spring migration (paired-sample _t_ test, _t_46 = −10.65, _p_ = 5.37 × 10⁻¹⁴). Late migrants, on the other hand, started spring migration 20 ± 5 days behind the green wave and began
to catch up with peak forage quality approximately 121 km into the migration (Fig. 2). Late migrants arrived on their summer range 11 ± 4 days behind the green wave, which was 9 days closer
than when they started spring migration (Wilcoxon signed-rank test, _Z_ = −3.50, _p_ = 0.0005). Mid-migrants started spring migration 2 ± 5 days ahead of the green wave but ended spring
migration 7 ± 3 days behind the green wave (paired-sample _t_ test, _t_57 = −2.91, _p_ = 0.005; Fig. 3). On average, early and mid-migrants were 7 days closer to peak green-up than late
migrants during spring migration (ANOVA, F2,149 = 15.59, _p_ = 7.14 ×10⁻⁷). Although early migrants started spring migration 24 days before mid-migrants and 45 days before late migrants, all
mule deer completed their spring migration, on average, within a 6-day window (Supplementary Fig. 2; Supplementary Table 7). Whether the timing of green-up was early or late, mule deer
arrived at summer range closer to peak green-up than when they started spring migration (Supplementary Table 8). Thus, mule deer are behaviorally flexible in the pace of their migration and
appear to have a strong ability to compensate en route for phenological mismatches with peak forage quality, allowing them to resynchronize their movements with the green wave. In the xeric
habitats of the Red Desert, the green wave propagates gradually, but green-up becomes more rapid and fleeting as it progresses towards the mountainous summer range (Fig. 4a, c). Because of
this, the foraging penalty for being mismatched (which is highest when green-up is most rapid21) was 11% higher during the last quarter of migration than the first quarter of migration (_p_
< 2.20 × 10⁻¹⁶; Supplementary Fig. 3). The ability of mule deer to compensate for phenological mismatches en route thus reduces the foraging penalty they would have experienced if
mismatched during later parts of their migration where green-up is more wave-like. We investigated two complimentary behavioral mechanisms of compensation: movement rate and time spent on
stopovers. How fast deer moved along their migratory route was strongly linked to whether they were ahead or behind the green wave when they started migration. Despite being overall worse
surfers than early and mid-migrants, late migrants made the best of their strategy by accelerating their movement. In contrast to early migrants that moved slowly (2.9 ± 0.3 km/day) and
spent extended time on stopovers (36 ± 5 days), late migrants moved 2.5 times faster (7.1 ± 0.7 km/day) and spent 72% less time on stopovers (10 ± 5 days; ANOVArate, _F_2,149 = 66.40, _p_ =
2.40 × 10⁻²¹; ANOVAstopover, _F_2,124 = 33.55, _p_ = 2.26 ×10⁻¹²; Fig. 4d, e), allowing them to catch up with the green wave. Migration distance, age, pregnancy, and nutritional condition
did not influence how fast or slow mule deer migrated (Supplementary Tables 9, 10), suggesting that movement rate and stopover use are largely linked to an animal’s position along the green
wave. Mule deer seemingly gathered information along their migratory route to recognize their own temporal deviation from peak green-up and made movement decisions that allowed them to catch
up to the green wave—or allowed the wave to catch up with them. VARIATION IN BEHAVIORAL COMPENSATION Mule deer varied in their ability to compensate for mismatches with the green wave
during migration (Supplementary Table 11). Ninety-three percent of mule deer that started spring migration ahead of the green wave fully (70%) or partially (23%) compensated for phenological
mismatches by decelerating their movement, whereas 90% of mule deer that started spring migration behind the green wave fully (54%) or partially (36%) compensated for phenological
mismatches by accelerating their movement (Fig. 4b; Supplementary Fig. 4). Moreover, mule deer that were further from peak green-up at the onset of spring migration were more likely to
become full compensators. For every 1-day increase in mismatch with the green wave, mule deer were 1.21 times more likely to fully compensate (β = 0.19, 95% CI = 0.15–0.24, _p_ = 6.98
×10−15; Fig. 5). Nonetheless, 15% of mule deer were non-compensators and became further mismatched from peak forage quality during migration. The overall ability of compensators to
accelerate or decelerate their movement underscores the importance of keeping pace with the green wave27. Migratory performance, including the ability to track resources, can improve through
individual learning or social learning and cultural transmission28,29. We incorporated age into our analyses to evaluate if individual learning and experience influenced the ability of mule
deer to compensate for phenological mismatches with the green wave. There was no effect of age (range: 1–13 years old) on the probability of individuals being full compensators (β = −0.04,
95% CI = −0.16 to 0.08, _p_ = 0.52). DISCUSSION Our understanding of the ability migratory animals have to compensate for being mistimed with resource phenology is still in its infancy. The
limited previous research on temporal compensation in resource tracking is taxonomically biased toward avian migrations17,18,30. For example, some Nearctic-Neotropical birds and barnacle
geese (_Branta leucopsis_) adjust their movement rate during migration, allowing them to arrive at their breeding range when forage quality is at its peak17,18. Few studies, however, have
documented an animal’s ability to compensate continuously along the length of their migration3,11,19. By combining fine-scale movement data with detailed estimates of the green wave in space
and time, we found that migrating ungulates are behaviorally flexible and have the capacity to readily adjust their speed en route. This study broadens our understanding of the behavioral
plasticity that allows diverse migratory taxa to track the dynamic nature of resources across space and time. The ability to behaviorally compensate en route should therefore be extended
beyond migratory animals that experience spatial drift16 and include migratory animals that experience temporal mismatches11 from peaks in resource phenology. The adaptive capacity to
compensate for phenological mismatches may allow some migratory animals to maintain foraging benefits amid rapid changes in environmental conditions. Behavioral compensation may be
particularly important for animals that adopt an income migration strategy in which they forage extensively during migration (as opposed to capital migrants that rely on stored energy
reserves during migration31). Mule deer rely on both capital and income resources, using fat reserves from previous seasons and forage during migration, to finance reproduction on summer
range32. By being behaviorally plastic during migration, mule deer can time their arrival on summer range with the green wave, which may help ensure that the energetically taxing period of
parturition coincides with peaks in forage quality32. Indeed, animals with an income-based migration strategy are expected to be behaviorally plastic in their migration schedule, because
they can continuously acquire information on their food resources throughout the length of their migration31. A key finding of this study is that mule deer have the cognitive capacity to
recognize when they are temporally mismatched from the green wave. The precise mechanism of how deer identified their location on the green wave remains unclear, although passage rates of
forage through the digestive tract, neurological responses to gut capacity, and changes in the rate of forage intake could provide deer with the necessary cognitive information33,34,35. For
example, mature, fibrous forbs remain 2.4 times longer in a mule deer’s digestive tract than immature forbs33. As foraging ruminants reach gut capacity, the secretion of leptin from white
adipose tissue produces a feeling of satiety, reducing the voluntary intake of forage34,35. Slower or faster rates of passage and disparate intake of forage, along with visual or olfactory
perception, and spatial memory of resource phenology36, could easily provide a reliable cue of a migrating animal’s position relative to the green wave. Regardless of the sensory mechanisms
involved, this work highlights the temporal cognitive ability of migratory animals, which is vastly underrepresented in research on animal migration compared with spatial cognitive
abilities16,29,37. Furthermore, these results call into question an often overly simplistic view of animal cognition that underlies theories of trophic mismatch. Mule deer are gregarious
animals and typically migrate in groups of variable sizes and age classes38,39, which could allow group decision-making to determine when to start migrating and how to keep pace with the
green wave during migration. The ability of young individuals to compensate as well as older individuals suggests that either social learning or collective navigation likely influence the
ability of mule deer to compensate for phenological mismatches during migration. Social learning from conspecifics may improve the ability of animals to efficiently navigate and track
resources en route. For example, naïve whooping cranes (_Grus americana_) learned from older, experienced individuals to pace their seasonal migrations with the green-up of plants in spring
and onset of snow in autumn29,40. If social learning improves an animal’s ability to track key resources and enhance fitness, then sociality may allow some migratory animals to more easily
cope with rapid environmental change. Our research focused on an ungulate population that migrates across a relatively intact landscape with navigable fences and only two rural highways
intersecting the 240-km migration corridor39 (Fig. 1a). The existence of few impediments or other behavioral disruptions likely facilitated the ability of mule deer to compensate for
phenological mismatches with the green wave during migration41. Barriers that impede animal movement, such as high-traffic interstates, impermeable fences, or housing developments, interfere
with an animal’s decision-making during migration and dampen their behavioral plasticity42,43,44. For example, migrating animals often accelerate through development to minimize disturbance
and may stall for extended periods of time before entering development, which complicates their ability to keep pace with resource phenology12,23,45. When considering the ability of animals
to behaviorally compensate during migration, ecologists must be cognizant of barriers that constrain the free movement and resource tracking of animals. Conserving intact landscapes is thus
necessary to ensure that animals have the greatest opportunity to adapt their movement strategies to changing patterns of the fleeting resources they seek. METHODS ANIMAL CAPTURE AND
HANDLING From 2014–2020, we captured _n_ = 220 adult female mule deer (>1-yr-old) in the Red Desert near Rock Springs, Wyoming, USA (41° 35′N, 109° 12′W) as part of a long-term study. We
recaptured deer each March and December for a total of _n_ = 528 animal-years of data (Supplementary Methods). All deer were captured via helicopter net-gunning46,47. Mule deer in this
portion of the Sublette Herd migrate a variety of distances to their summer ranges in northwestern Wyoming39,48. Herein, we focused on _n_ = 72 long-distance migrants (_n_ = 152
animal-years) that migrated 134–293 km and spent the summer north of Pinedale, Wyoming (42° 51′N, 109° 51′W). During captures, we used an electronic platform scale (±0.1 kg) to measure body
mass (kg) and a portable ultrasound (Ibex, E.I. Medical Imaging, Loveland, CO) to measure maximum rump fat (mm). Following previously applied methods49, we used body mass, maximum rump fat,
and a body-condition score to estimate percent-scaled ingesta-free body fat (IFBFat)49,50. For captures in March, we used an ultrasound to determine pregnancy, including fetal rate (number
of fetuses per deer) and fetal development via measures of the fetal eye diameter (mm). To estimate the age of each deer, we extracted the lower right incisiform canine and used the cementum
annuli aging technique51,52,53, which was conducted by Matson’s Laboratory in Manhattan, Montana, USA. From 2014–2020, we outfitted all deer with store-on-board or iridium GPS collars that
collected locations every 1–2 hrs (Advanced Telemetry Systems, Isanti, MN, USA; Lotek Wireless, Newmarket, ON, CAN; Telonics, Mesa, AZ, USA). We also included GPS collar data from a previous
study on the Sublette Mule Deer Herd (2011–2013)48 to analyze movement for _n_ = 27 additional deer (_n_ = 66 animal-years), which were outfitted with store-on-board GPS collars that
collected locations every 3 h (Telonics, Mesa, AZ, USA). All animal capture and handling protocols were approved by the Wyoming Game and Fish Department (Chapter 33-937) and an Institutional
Animal Care and Use Committee at the University of Wyoming (20131111KM00040, 20151204KM00135, 20170215KM00260, 20200302MK00411). Data associated with the capture and handling of mule deer
were organized and managed within Microsoft Access (Microsoft Office Version Professional Plus 2016). DELINEATION OF MIGRATORY ROUTES AND SEASONAL RANGES We used Net Square Displacement
(NSD54) to determine the timing of spring and autumn migration, delineate migratory routes, and determine the net displacement (km) between the start of spring migration and each GPS
location along the migratory route. We determined winter range use for each deer by extracting GPS locations between the end of autumn migration and the start of spring migration (or between
the time of capture and start of spring migration if the end of autumn migration was unknown). We determined summer range use for each deer by extracting GPS locations between the end of
spring migration and the start of autumn migration (or between the end of spring migration and time of collar failure or mortality on summer range). We used a 95% Kernel Utilization
Distribution (KUD55) to delineate the winter range (41.63 ± 7.26 km2 [_x̄_ ± 95% CI]) and summer range (7.26 ± 1.61 km2) of each animal-year. We removed 0.10%, 0.09%, and 0.24% of all GPS
locations during migration, on winter range, and on summer range, respectively, because the movement rate between consecutive locations was greater than 10.8 km/h and indicated an inaccurate
GPS fix. FACTORS INFLUENCING THE START OF SPRING MIGRATION We sought to identify intrinsic and extrinsic factors that could explain variation in the start of spring migration among mule
deer. We conducted a generalized linear mixed model (GLMM) to understand the effect of intrinsic variables, including age, nutritional condition (% scaled IFBFat in March), and pregnancy
(i.e., fetal rate [number of fetuses per deer]; fetal eye diameter [mm]), in addition to migration distance (km), on the start of spring migration. We standardized the start date of spring
migration for each animal-year to the median start date of spring migration for each year of the study. For the GLMM and all other mixed models in our analyses, we used year and animal ID as
random intercepts to account for climatic variability across years and repeated measures of the same individual in different years. We used the drop1 function in the R stats package to
identify the significance of each fixed effect and select the best-fitting model. We performed the GLMM with the lme4 package56 within R version 4.0.557. CUE-RESPONSES ON WINTER RANGE We
evaluated how changes in environmental conditions on winter range (i.e., plant phenology, temperature, snow depth, photoperiod) initiated spring migration for mule deer. We used the
Normalized Difference Vegetation Index (NDVI) from a time series of MODIS satellite images (MOD09Q1 satellite array; 250-m2 spatial resolution, 8-day temporal resolution) to quantify changes
in plant phenology on winter range. NDVI values were fit to a double logistic curve and scaled between 0 and 1 with values of 1 indicating maximum plant biomass for a given pixel on the
landscape58. We used NDVI as a metric of plant phenology rather than Instantaneous Rate of Green-up (IRG) because IRG is symmetrical around its peak58 and can be difficult to interpret
linearly. We used spatial climate data from the Parameter-elevation Regressions on Independent Slopes Model (PRISM; Climate Group at Oregon State University, USA) to estimate mean daily
temperature (°C; 4-km2 spatial resolution, 1-day temporal resolution59). We used the Snow Data Assimilation System (SNODAS; National Snow and Ice Data Center) to estimate snow depth (m)
across the study area (1-km2 spatial resolution, 1-day temporal resolution60). We determined photoperiod (time of sunrise—time of sunset) for each GPS location with the R suncalc package61.
We extracted NDVI, temperature, snow depth, and photoperiod for each GPS location prior to spring migration and calculated the daily mean of NDVI, temperature, snow depth, and photoperiod
for each animal-year to reduce pseudoreplication and account for irregular GPS fixes. We also calculated the daily changes in NDVI, temperature, and snow depth for each animal year. We used
a mixed effects Cox Proportional Hazards (CPH) model62,63 to evaluate the effect of changes in plant phenology, temperature, snow depth, and photoperiod on the likelihood of deer initiating
spring migration. We subset GPS locations from 20 March to the start of each individual’s spring migration to standardize time series among all animal-years, including _n_ = 43 deer that we
captured in mid-March. We used year and animal ID as a random intercept and each environmental variable (i.e., plant phenology, temperature, snow depth, photoperiod) as a random slope, which
allowed us to obtain random effect coefficients (i.e., individual cue-response) of environmental variables on the daily instantaneous rate that each individual would start spring migration.
We validated the key assumption of the CPH model that the baseline hazard remained proportional for each covariate (Supplementary Methods)63,64,65 and conducted an Additive Cox Proportional
Model to verify that all predictor variables exhibited a linear relationship with the hazards ratio (elective degrees of freedom [e.d.f] = 1.0). We then selected the best-fitting model for
fixed effects using backward stepwise selection, and adopted a final model containing the fixed and random effects with the survival package66 within R version 4.0.557. CUE RELIABILITY:
PROPAGATION OF THE GREEN WAVE ACROSS SPACE We evaluated the annual propagation of the green wave across the study area by calculating the mean date of peak IRG for each kilometer along the
240-km migration corridor. First, we calculated the 99% utilization distribution (UD) from a Brownian bridge movement model (BBMM67,68) to delineate the migration corridor for each
animal-year and then merged all migration corridors into one polygon to delineate the population-level migration corridor from 2011–2020. For each year of the study, we extracted date of
peak IRG to the population-level migration corridor. We calculated the Euclidean distance between each pixel on the landscape and the southernmost location of the migration corridor (41°
41′N, 108° 50′W) and only included pixels that had a Euclidean distance of less than or equal to 240 kilometers to limit our analyses within the designated 240-km migration corridor39. We
calculated rate of change in mean date of peak IRG and categorized rate of change as either negative or positive. Negative values indicated a non-consecutive green wave that propagated
backwards towards winter range, whereas positive values indicated a consecutive wave that propagated northward towards summer range. We then conducted a series of linear regressions for each
year and direction of the green wave (negative versus positive) to further understand whether the order of green-up was consecutive. Each linear regression included distance along the
migration corridor as the predictor variable and mean date of peak IRG as the response variable. A lack of correlation between distance and date of green-up indicated that green-up did not
propagate like a wave across the landscape. Based on the linear regression between mean date of peak green-up and distance along the migration corridor, the spring of 2017 exhibited the
strongest and most consecutive propagation of green-up across the landscape (Supplementary Table 5). Thus, we used IRG from 2017 to visualize the weekly propagation of the green wave. We
cropped MODIS satellite images containing daily IRG values in 2017 to the population-level migration corridor. From March 26, 2017 through May 20, 2017, we calculated the median IRG for each
kilometer and week. We then used a loess regression to plot the median IRG for each kilometer and week along the migration corridor. GREEN WAVE SURFING We evaluated the ability of mule deer
to track green-up of plants during spring migration by analyzing the synchronicity between movement and peak IRG. We determined IRG by extracting the first derivative of double-logistic
curves that were fit to the annual time series of NDVI21. Days from peak IRG (hereafter referred to as Days-From-Peak) were calculated as the difference in days between the date of every GPS
location for a deer and the date of peak IRG at the same GPS location6,21. A theoretically perfect surfer occupies a location on the same day that peak IRG occurs (Days-From-Peak = 0)21. We
calculated mean Days-From-Peak for each day and kilometer of an individual’s migration to reduce pseudoreplication and account for irregular GPS fixes6,21. We quantified an individual’s
location on the green wave at the start and end of spring migration by calculating the difference in days between the mean date of peak IRG on each seasonal range and the date an individual
departed their winter range or arrived at their summer range. ANNUAL VARIATION IN PHENOLOGICAL MISMATCHES WITH THE GREEN WAVE We evaluated whether mule deer at the population level
experienced phenological mismatches with peak IRG at the start and end of spring migration. First, we standardized the start of spring migration for each deer by subtracting the start date
of spring migration from the mean date of peak IRG on each winter range. Second, we standardized the end of spring migration for each deer by subtracting the end date of spring migration
from the mean date of peak IRG on each summer range. We performed a series of two-sided z-tests to determine whether deer started and ended spring migration ahead or behind peak IRG.
BEHAVIORAL COMPENSATION We determined whether early, mid, and late migrants compensated for phenological mismatches with the green wave during migration by conducting a series of paired _t_
tests that compared an individual’s location on the green wave at the start and end of spring migration. We also conducted a one-way multivariate analysis of variance (MANOVA) to compare
start and end dates of spring migration and Days-From-Peak at the start and end of spring migration among early, mid, and late migrants. The MANOVA included departure from winter range
(i.e., early, mid, late) as the independent variable and the following dependent variables: (1) start date of spring migration, (2) end date of spring migration, (3) Days-From-Peak at the
start of spring migration, and (4) Days-From-Peak at the end of spring migration. We then conducted four separate Tukey’s honestly significant different (HSD) tests as _post hoc_ analyses to
further identify differences in timing and Days-From-Peak at the start and end of spring migration among early, mid, and late migrants. We identified mule deer as full compensators, partial
compensators, perfect surfers, and non-compensators based on how mismatched they were from peak IRG at the start and end of spring migration (Supplementary Table 11). Full compensators were
deer that started spring migration more than 7 days ahead or behind peak IRG but became closer to peak IRG at the end of their spring migration. For full compensators, absolute
Days-From-Peak at the end of spring migration was less than absolute Days-From-Peak at the start of spring migration. Partial compensators were deer that started spring migration more than 7
days ahead or behind peak IRG but neither became further from nor closer to peak IRG. Partial compensators did not deviate by more than 7 Days-From-Peak at the end of spring migration
compared with the start of spring migration. Perfect surfers were deer that started spring migration within 7 days of peak IRG and remained within 7 days of peak IRG at the end of their
spring migration. Non-compensators were deer that drifted further from peak IRG at the end of spring migration regardless of when they departed winter range relative to peak IRG. For
non-compensators, absolute Days-From-Peak at the end of spring migration was more than absolute Days-From-Peak at the start of spring migration. We performed two ordinal logistic regression
models to evaluate whether absolute Days-From-Peak at the start of spring migration and age influenced the probability of a deer becoming a full compensator versus a partial compensator,
perfect surfer, or non-compensator. Our dataset included age for _n_ = 51 unique mule deer (_n_ = 115 animal-years). Finally, to understand if deer compensated for phenological mismatches
irrespective of whether green-up was early or late, we conducted two simple linear regressions with annual variation in date of peak IRG on winter range as the predictor variable (i.e.,
annual deviation from long-term average) and absolute Days-From-Peak at the start or end of migration as the response variable. FORAGING PENALTIES RELATIVE TO DISTANCE AND DEGREE OF MISMATCH
We quantified foraging penalties for deer based on how mismatched they were from peak IRG and their location relative to summer range where green-up was more rapid and fleeting. For each
pixel within the migration corridor, we calculated the loss in IRG as the average difference between IRG on the date of peak IRG and IRG from 1 to 7 days before and after peak IRG. We
performed a generalized additive mixed model (GAMM) to evaluate the effect of distance along the migration corridor (km) and Days-From-Peak on percent loss in IRG. We divided distance by a
factor of 100 to ensure that all covariates were on similar scales. We used an interaction term between distance and Days-From-Peak within the GAMM to understand whether the effect of
Days-From-Peak on foraging penalties depended on distance along the migration corridor. All covariates exhibited a strong non-linear relationship with loss in IRG (e.d.f > 3.0). We used a
cubic spline to smooth fixed effects and applied shrinkage to smoothed fixed effects, which enabled non-linear fixed effects to be shrunk to zero if they did not significantly contribute to
the top model. We used year as a random intercept to reduce pseudoreplication and to account for repeated measures of IRG along the migration corridor. We performed the GAMM with the mgcv
package69 within R version 4.0.557. MOVEMENT RATE AND STOPOVER USE We determined the movement rate for each deer by dividing the total length of migration (Euclidean distance between start
and end locations of each migration) by the duration of migration (days). We used a BBMM with a 150-m resolution and 10% UD to delineate high-use stopovers70. We determined the total number
of days each deer spent on high-use stopovers (≥3 days) by calculating the quotient between the sum of GPS fixes on each stopover and the GPS fix rate. We removed _n_ = 25 animal-years with
BBMM motion variances greater than 8,000. Our final analyses on stopover use included _n_ = 65 unique mule deer (_n_ = 127 animal-years). Of the _n_ = 127 animal-years in the stopover
analyses, _n_ = 112 animal-years spent some portion of their migration on high-use stopovers (≥3 days), whereas _n_ = 15 animal-years spent zero days on high-use stopovers. We conducted two
separate GAMMs to understand the effect of movement rate and stopover use on an individual’s ability to compensate for starting spring migration early or late. For each GAMM, we used start
of spring migration as the fixed effect and movement parameter (i.e., movement rate or stopover use) as the response variable. We standardized the start date of spring migration for each
animal-year to the median start date of spring migration for each year of the study. We used a cubic spline to smooth start of spring migration, which exhibited a weak non-linear
relationship with movement rate (e.d.f = 1.96) and a strong non-linear relationship with stopover use (e.d.f = 3.00). We did not conduct model selection beyond the base model because each
GAMM contained only one fixed effect. We performed each GAMM with the mgcv package69 within R version 4.0.557. We then performed a series of one-way ANOVAs and Tukey’s HSDs to determine
differences in movement rate and stopover use among early, mid, and late migrants and among full compensators, partial compensators, perfect surfers, and non-compensators. Because
reproductive status may influence an animal’s movement behavior, including rate of movement during migration71, we evaluated if other factors besides phenological mismatch influenced
movement rate and stopover use. We conducted two separate GLMMs with migration distance (km), age, nutritional condition (% scaled IFBFat in March), and pregnancy (i.e., fetal rate [number
of fetuses per deer]; fetal eye diameter [mm]) as the predictor variables, movement rate or stopover use as the response variable, and animal ID as a random intercept. REPORTING SUMMARY
Further information on research design is available in the Nature Portfolio Reporting Summary linked to this article. DATA AVAILABILITY Source Data are provided as a Source Data File with
this manuscript. Data underlying this research are available in Dryad72. Source data are provided with this paper. REFERENCES * Shaw, A. K. Drivers of animal migration and implications in
changing environments. _Evol. Ecol._ 30, 991–1007 (2016). Article Google Scholar * McNamara, J. M., Barta, Z., Klaassen, M. & Bauer, S. Cues and the optimal timing of activities under
environmental changes. _Ecol. Lett._ 14, 1183–1190 (2011). Article PubMed PubMed Central Google Scholar * Winkler, D. W. et al. Cues, strategies, and outcomes: how migrating vertebrates
track environmental change. _Movement Ecol._ 2, https://doi.org/10.1186/2051-3933-2-10 (2014). * Armstrong, J. B., Takimoto, G., Schindler, D. E., Hayes, M. M. & Kauffman, M. J. Resource
waves: phenological diversity enhances foraging opportunities for mobile consumers. _Ecology_ 97, 1099–1112 (2016). Article PubMed Google Scholar * Visser, M. E. & Gienapp, P.
Evolutionary and demographic consequences of phenological mismatches. _Nat. Ecol. Evol._ 3, 879–885 (2019). Article PubMed PubMed Central Google Scholar * Middleton, A. D. et al.
Green-wave surfing increases fat gain in a migratory ungulate. _Oikos_ 127, 1060–1068 (2018). Article Google Scholar * McGrath, L. J., Van Riper, C. III & Fontaine, J. J. Flower power:
tree flowering phenology as a settlement cue for migrating birds. _J. Anim. Ecol._ 78, 22–30 (2009). Article PubMed Google Scholar * Both, C., Bouwhuis, S., Lessells, C. M. & Visser,
M. E. Climate change and population declines in a long-distance migratory bird. _Nature_ 441, 81–83 (2006). Article ADS CAS PubMed Google Scholar * Post, E. & Forchhammer, M. C.
Climate change reduces reproductive success of an Arctic herbivore through trophic mismatch. _Philos. Trans. R. Soc. B_ 363, 2369–2375 (2008). Article Google Scholar * Plard, F. et al.
Mismatch between birth date and vegetation phenology slows the demography of roe deer. _PLoS Biol._ 12, https://doi.org/10.1371/journal.pbio.1001828 (2014). * Robinson, R. A. et al.
Travelling through a warming world: climate change and migratory species. _Endangered Species Res._ 7, https://doi.org/10.3354/esr00095 (2008). * Aikens, E. O., Wyckoff, T. B., Sawyer, H.
& Kauffman, M. J. Industrial energy development decouples ungulate migration from the green wave. _Nat. Ecol. Evol._ 6, 1733–1741 (2022). Article PubMed Google Scholar * Cherry, S.
G., Derocher, A. E., Thiemann, G. W. & Nicholas, J. L. Migration phenology and seasonal fidelity of an Arctic marine predator in relation to sea ice dynamics. _J. Anim. Ecol._ 82,
912–921 (2013). Article PubMed Google Scholar * Schmaljohann, H. & Both, C. The limits of modifying migration speed to adjust to climate change. _Nat. Clim. Change_ 7, 573–576 (2017).
Article ADS Google Scholar * Lindström, Å., Alerstam, T. & Hedenström, A. Faster fueling is the key to faster migration. _Nat. Clim. Change_ 9, 288–289 (2019). Article ADS Google
Scholar * Chapman, J. W. et al. Animal orientation strategies for movement in flows. _Curr. Biol._ 21, R861–R870 (2011). Article CAS PubMed Google Scholar * Marra, P. P., Francis, C.
M., Mulvihill, R. S. & Moore, F. R. The influence of climate on the timing and rate of spring bird migration. _Oecologia_ 142, 307–315 (2005). Article ADS PubMed Google Scholar *
Lameris, T. K. et al. Arctic geese tune migration to a warming climate but still suffer from a phenological mismatch. _Curr. Biol._ 28, 2467–2473 (2018). Article CAS PubMed Google Scholar
* Visser, M. E. & Both, C. Shifts in phenology due to global climate change: the need for a yardstick. _Proc. R. Soc. B_ 272, 2561–2569 (2005). Article PubMed PubMed Central Google
Scholar * Merkle, J. A. et al. Large herbivores surf waves of green-up during spring. _Proc. Roy. Soc. B_ 283, https://doi.org/10.1098/rspb.2016.0456 (2016). * Aikens, E. O. et al. The
greenscape shapes surfing of resource waves in a large migratory herbivore. _Ecol. Lett._ 20, 741–750 (2017). Article PubMed Google Scholar * Monteith, K. L. et al. Timing of seasonal
migration in mule deer: effects of climate, plant phenology, and life-history characteristics. _Ecosphere_ 2, https://doi.org/10.1890/ES10-00096.1 (2011). * Lendrum, P. E., Anderson, C. R.
Jr., Monteith, K. L., Jenks, J. A. & Bowyer, R. T. Migrating mule deer: effects of anthropogenically altered landscapes. _PloS One_ 8,https://doi.org/10.1371/journal.pone.0064548 (2013).
* Debeffe, L., Rivrud, I. M., Meisingset, E. L. & Mysterud, A. Sex-specific differences in spring and autumn migration in a northern large herbivore. _Sci. Rep._ 9,
https://doi.org/10.1038/s41598-019-42639-3 (2019). * Cote, J. et al. Behavioural synchronization of large-scale animal movements—disperse along, but migrate together? _Biol. Rev._ 92,
1275–1296 (2016). Article PubMed Google Scholar * Geremia, C. et al. Migrating bison engineer the green wave. _Proc. Natl Acad. Sci._ 116, 25707–25713 (2019). Article ADS CAS PubMed
PubMed Central Google Scholar * Rivrud, I. M., Heurich, M., Krupczynski, P., Müller, J. & Mysterud, A. Green wave tracking by large herbivores: an experimental approach. _Ecology_ 97,
3547–3553 (2016). Article PubMed Google Scholar * Jesmer, B. R. et al. Is ungulate migration culturally transmitted? Evidence of social learning from translocated animals. _Science_ 361,
1023–1025 (2018). Article ADS CAS PubMed Google Scholar * Abrhams, B., Teitelbaum, C. S., Mueller, T. & Converse, S. J. Ontogenetic shifts from social to experiential learning drive
avian migration timing. _Nat. Commun._ 12, https://doi.org/10.1038/s41467-021-27626-5 (2021). * Linscott, J. A. & Senner, N. R. Beyond refueling: investigating the diversity of
functions of migratory stopover events. _Ornithol. Appl._ 123, https://doi.org/10.1093/ornithapp/duaa074 (2021). * Evans, S. R. & Bearhop, S. Variation in movement strategies: capital
versus income migration. _J. Anim. Ecol._ 91, 1961–1974 (2022). Article PubMed PubMed Central Google Scholar * Aikens, E. O. et al. Migration distance and maternal resource allocation
determine timing of birth in a large herbivore. _Ecology_ 102, https://doi.org/10.1002/ecy.3334 (2021). * Spalinger, D. E., Robbins, C. T. & Hanley, T. A. The assessment of handling time
in ruminants: the effect of plant chemical and physical structure on the rate of breakdown of plant particles in the rumen of mule deer and elk. _Can. J. Zool._ 64, 312–321 (1986). Article
Google Scholar * Forbes, J. M. & Provenza, F. D. in _Ruminant Physiology: Digestion, Metabolism, Growth, and Reproduction_ (ed. Cronje, P. B.) 3–19 (CAB International, 2000). *
Pittroff, W. & Soca, P. in _Feeding in Domestic Vertebrates: From Structure to Behavior_ (ed Bels, V.) 278–301 (CAB International, 2006). * Merkle, J. A. et al. Spatial memory shapes
migration and its benefits: evidence from a large herbivore. _Ecol. Lett._ 22, 1797–1805 (2019). Article PubMed Google Scholar * Toledo, S. et al. Cognitive map-based navigation in wild
bats revealed by a new high-throughput tracking system. _Science_ 369, 188–193 (2020). Article ADS CAS PubMed Google Scholar * Bowyer, R. T., McCullough, D. R. & Belovsky, G. E.
Causes and consequences of sociality in mule deer. _Alces_ 37, 371–402 (2001). Google Scholar * Kauffman, M. J. et al. _Wild Migrations: Atlas of Wyoming’s Ungulates_ (Oregon State
University Press, 2018). * Oestreich, W. K. et al. The influence of social cues on timing of animal migrations. _Nat. Ecol. Evol._ 6, 1617–1625 (2022). Article PubMed Google Scholar *
Aikens, E. O. et al. Wave-like patterns of plant phenology determine ungulate migration tactics across northern temperate ecosystems. _Curr. Biol._ 30, 3444–3449 (2020). Article CAS PubMed
Google Scholar * Sawyer, H. et al. A framework for understanding semi-permeable barrier effects on migratory ungulates. _J. Appl. Ecol._ 50, 68–78 (2013). Article Google Scholar *
Seidler, R. G., Long, R. A., Berger, J., Bergen, S. & Beckmann, J. P. Identifying impediments to long-distance mammal migrations. _Conserv. Biol._ 29, 99–109 (2014). Article PubMed
Google Scholar * Xu, W., Dejid, N., Herrmann, V., Sawyer, H. & Middleton, A. D. Barrier behaviour analysis (BaBA) reveals extensive effects of fencing on wide-ranging ungulates. _J.
Appl. Ecol._ 58, 690–698 (2021). Article Google Scholar * Wyckoff, T. B., Sawyer, H., Albeke, S. E., Garman, S. L. & Kauffman, M. J. Evaluating the influence of energy and residential
development on the migratory behavior of mule deer. _Ecosphere_ 9, https://doi.org/10.1002/ecs2.2113 (2018). * Barrett, M. W., Nolan, J. W. & Roy, L. D. Evaluation of a hand-held net-gun
to capture large mammals. _Wildl. Soc. Bull._ 10, 108–114 (1982). Google Scholar * Krausman, P. R., Hervert, J. J. & Ordway, L. L. Capturing deer and mountain sheep with a net-gun.
_Wildl. Soc. Bull._ 13, 71–73 (1985). Google Scholar * Sawyer, H., Middleton, A. D., Hayes, M. M., Kauffman, M. J. & Monteith, K. L. The extra mile: ungulate migration distance alters
the use of seasonal range and exposure to anthropogenic risk. _Ecosphere_ 7, https://doi.org/10.1002/ecs2.1534 (2016). * Cook, R. C. et al. Revisions of rump fat and body scoring indices for
deer, elk, and moose. _J. Wildl. Manag._ 74, 880–896 (2010). Article Google Scholar * Monteith, K. L. et al. Risk-sensitive allocation in seasonal dynamics of fat and protein reserves in
a long-lived mammal. _J. Anim. Ecol._ 82, 377–388 (2013). Article PubMed Google Scholar * Rolandsen, C. M. et al. Accuracy and repeatability of moose (Alces alces) age as estimated from
dental cement layers. _Eur. J. Wildl. Res._ 54, 6–14 (2008). Article Google Scholar * Cooper, S. M., Sieckenius, S. S. & Silva, A. L. Dentine method: aging white-tailed deer by tooth
measurements. _Wildl. Soc. Bull._ 37, 451–457 (2013). Article Google Scholar * Boertje, R. D., Ellis, M. M. & Kellie, K. A. Accuracy of moose age determinations from canine and incisor
cementum annuli. _Wildl. Soc. Bull._ 39, 383–389 (2015). Article Google Scholar * Bunnefeld, N. et al. A model-driven approach to quantify migration patterns: individual, regional and
yearly differences. _J. Anim. Ecol._ 80, 466–476 (2011). Article PubMed Google Scholar * Worton, B. J. Kernel methods for estimating the utilization distribution in home-range studies.
_Ecology_ 70, 164–168 (1989). Article Google Scholar * Bates, D. et al. Lme4: linear mixed-effects models using ‘Eigen’ and S4. R package version 1.1–29
https://cran.r-project.org/web/packages/lme4/index.html (2022). * R Core Team, R: a language and environment for statistical computing. R Foundation for Statistical Computing, Vienna,
Austria. http://www.R-project.org/. (2019). * Bischof, R. et al. A migratory northern ungulate in the pursuit of spring: jumping or surfing the green wave? _Am. Naturalist_ 180, 407–424
(2012). Article Google Scholar * Daly, C. et al. Physiographically sensitive mapping of climatological temperature and precipitation across the conterminous United States. _Int. J.
Climatol._ 28, 2031–2064 (2008). Article Google Scholar * National Operational Hydrologic Remote Sensing Center. Snow Data Assimilation System (SNODAS) Data Products at NSIDC. (National
Snow and Ice Data Center, Boulder, Colorado USA, 2004). * Thieurmel, B. & Elmarhraoui, A. Suncalc: compute sun position, sunlight phases, moon position and lunar phase. R package version
0.5.0. https://cran.r-project.org/web/packages/suncalc/index.html (2022). * Cox, D. R. Regression models and life-tables. _J. R. Stat. Soc. Ser. B_ 34, 187–220 (1972). MathSciNet MATH
Google Scholar * Therneau, T. M. Coxme: mixed effects cox models. R package version: 2.2–18.1. https://cran.r-project.org/web/packages/coxme/index.html (2022). * Rivrud, I. M. et al. Leave
before it’s too late: anthropogenic and environmental triggers of autumn migration in a hunted ungulate population. _Ecology_ 97, 1058–1068 (2016). PubMed Google Scholar * Fox, J. _An R
and S-Plus Companion To Applied Regression_ (Sage Publications, 2002). * Therneau, T. M. Survival: Survival analyses. R package version 3.3–5.
https://cran.r-project.org/web/packages/survival/index.html (2023). * Horne, J. S., Garton, E. O., Krone, S. M. & Lewis, J. S. Analyzing animal movements using Brownian bridges.
_Ecology_ 88, 2354–2363 (2007). Article PubMed Google Scholar * Nielson, R. M., Sawyer, H. & McDonald, T. L. BBMM: Brownian bridge movement model. R package version: 3.0.
https://cran.r-project.org/web/packages/BBMM/index.html (2015). * Wood, S. Mgcv: mixed GAM computation vehicle with automatic smoothness estimation. R package version 1.8–42.
https://cran.r-project.org/web/packages/mgcv/index.html (2023). * Rodgers, P. A., Sawyer, H., Mong, T. W., Stephens, S. & Kauffman, M. J. Sex-specific migratory behaviors in a temperate
ungulate. _Ecosphere_ 12, https://doi.org/10.1002/ecs2.3424 (2021). * Singh, N. J. & Ericsson, G. Changing motivations during migration: linking movement speed to reproductive status in
a migratory large mammal. _Biol. Lett._ 10, https://doi.org/10.1098/rsbl.2014.0379 (2014). * Ortega, A. C., Aikens, E. O., Merkle, J. A., Monteith, K. L. & Kauffman, M. J. Migration
statistics and biometrics for mule deer that migrated long-distances (2011–2020), Wyoming, USA. Dryad Dataset: https://doi.org/10.5061/dryad.8kprr4xsj (2023). Download references
ACKNOWLEDGEMENTS Funding was provided by the Bureau of Land Management, Hunter Legacy 100 Fund, Knobloch Family Foundation, Muley Fanatic Foundation, National Science Foundation (A.C.O), Pew
Charitable Trusts, Safari Club International Foundation, Sitka Ecosystem Grant, Teton Conservation District, The Nature Conservancy, Wyoming Game and Fish Department, Wyoming Governor’s Big
Game License Coalition, and the US Geological Survey. Hall Sawyer contributed data from 2011–2013 and provided input on the research and manuscript. Ian Freeman and Alethea Steingisser at
the University of Oregon InfoGraphics Lab led graphic design of figures. Wildlife biologists at the Wyoming Game and Fish Department (WGFD) and Bureau of Land Management (BLM), including
Patrick Burke (WGFD), Dean Clause (WGDF), Patrick Lionberger (BLM), Brandon Scurlock (WGFD), Miguel Valdez (BLM), and Sean Yancey (WGFD) assisted with field logistics and data collection.
Any use of trade, firm, or product names is for descriptive purposes only and does not imply endorsement by the U.S. Government. AUTHOR INFORMATION AUTHORS AND AFFILIATIONS * Wyoming
Cooperative Fish and Wildlife Research Unit, Department of Zoology and Physiology, University of Wyoming, Laramie, WY, 82071, USA Anna C. Ortega & Kevin L. Monteith * Program in Ecology,
University of Wyoming, Laramie, WY, 82071, USA Anna C. Ortega * U.S. Geological Survey, South Dakota Cooperative Fish and Wildlife Research Unit, Department of Natural Resource Management,
Brookings, SD, 57006, USA Ellen O. Aikens * Department of Zoology and Physiology, University of Wyoming, Laramie, WY, 82071, USA Jerod A. Merkle * Haub School of Environment and Natural
Resources, University of Wyoming, Laramie, WY, 82072, USA Kevin L. Monteith * U.S. Geological Survey, Wyoming Cooperative Fish and Wildlife Research Unit, Department of Zoology and
Physiology, University of Wyoming, Laramie, WY, 82071, USA Matthew J. Kauffman Authors * Anna C. Ortega View author publications You can also search for this author inPubMed Google Scholar *
Ellen O. Aikens View author publications You can also search for this author inPubMed Google Scholar * Jerod A. Merkle View author publications You can also search for this author inPubMed
Google Scholar * Kevin L. Monteith View author publications You can also search for this author inPubMed Google Scholar * Matthew J. Kauffman View author publications You can also search for
this author inPubMed Google Scholar CONTRIBUTIONS A.C.O. and M.J.K. conceived of the study. A.C.O., K.L.M., and M.J.K. collected data from 2014–2020. A.C.O., E.O.A., J.A.M., and M.J.K.
developed the methodology. A.C.O. and M.J.K. wrote the manuscript. A.C.O., E.O.A., J.A.M., K.L.M., and M.J.K. contributed revisions to the manuscript. CORRESPONDING AUTHOR Correspondence to
Anna C. Ortega. ETHICS DECLARATIONS COMPETING INTERESTS The authors declare no competing interests. PEER REVIEW PEER REVIEW INFORMATION _Nature Communications_ thanks the anonymous
reviewer(s) for their contribution to the peer review of this work. Peer reviewer reports are available. ADDITIONAL INFORMATION PUBLISHER’S NOTE Springer Nature remains neutral with regard
to jurisdictional claims in published maps and institutional affiliations. SUPPLEMENTARY INFORMATION SUPPLEMENTARY INFORMATION PEER REVIEW FILE REPORTING SUMMARY SOURCE DATA SOURCE DATA
RIGHTS AND PERMISSIONS OPEN ACCESS This article is licensed under a Creative Commons Attribution 4.0 International License, which permits use, sharing, adaptation, distribution and
reproduction in any medium or format, as long as you give appropriate credit to the original author(s) and the source, provide a link to the Creative Commons license, and indicate if changes
were made. The images or other third party material in this article are included in the article’s Creative Commons license, unless indicated otherwise in a credit line to the material. If
material is not included in the article’s Creative Commons license and your intended use is not permitted by statutory regulation or exceeds the permitted use, you will need to obtain
permission directly from the copyright holder. To view a copy of this license, visit http://creativecommons.org/licenses/by/4.0/. Reprints and permissions ABOUT THIS ARTICLE CITE THIS
ARTICLE Ortega, A.C., Aikens, E.O., Merkle, J.A. _et al._ Migrating mule deer compensate en route for phenological mismatches. _Nat Commun_ 14, 2008 (2023).
https://doi.org/10.1038/s41467-023-37750-z Download citation * Received: 28 November 2022 * Accepted: 29 March 2023 * Published: 10 April 2023 * DOI:
https://doi.org/10.1038/s41467-023-37750-z SHARE THIS ARTICLE Anyone you share the following link with will be able to read this content: Get shareable link Sorry, a shareable link is not
currently available for this article. Copy to clipboard Provided by the Springer Nature SharedIt content-sharing initiative