- Select a language for the TTS:
- UK English Female
- UK English Male
- US English Female
- US English Male
- Australian Female
- Australian Male
- Language selected: (auto detect) - EN
Play all audios:
ABSTRACT Bone metabolism is regulated by the cooperative activity between bone-forming osteoblasts and bone-resorbing osteoclasts. However, the mechanisms mediating the switch between the
osteoblastic and osteoclastic phases have not been fully elucidated. Here, we identify a specific subset of mature osteoblast-derived extracellular vesicles that inhibit bone formation and
enhance osteoclastogenesis. Intravital imaging reveals that mature osteoblasts secrete and capture extracellular vesicles, referred to as small osteoblast vesicles (SOVs). Co-culture
experiments demonstrate that SOVs suppress osteoblast differentiation and enhance the expression of receptor activator of NF-κB ligand, thereby inducing osteoclast differentiation. We also
elucidate that the SOV-enriched microRNA miR-143 inhibits Runt-related transcription factor 2, a master regulator of osteoblastogenesis, by targeting the mRNA expression of its dimerization
partner, core-binding factor β. In summary, we identify SOVs as a mode of cell-to-cell communication, controlling the dynamic transition from bone-forming to bone-resorbing phases in vivo.
SIMILAR CONTENT BEING VIEWED BY OTHERS OSTEOCLAST-DERIVED APOPTOTIC BODIES COUPLE BONE RESORPTION AND FORMATION IN BONE REMODELING Article Open access 11 January 2021 THE ROLE AND
APPLICATIONS OF EXTRACELLULAR VESICLES IN OSTEOPOROSIS Article Open access 23 January 2024 ANNEXIN A5 DERIVED FROM MATRIX VESICLES PROTECTS AGAINST OSTEOPOROTIC BONE LOSS VIA MINERALIZATION
Article Open access 09 November 2023 INTRODUCTION Bone remodeling occurs in different parts of the body throughout life to maintain bone architecture balance and systemic mineral
homeostasis. During this “remodeling” process, osteoclasts remove mineralized bones, whereas osteoblasts form new bones1,2,3. These resorption and formation phases are linked and balanced
with intermittent coupling phases. Functional coupling between these two cell types is critical for the maintenance of proper bone metabolism, and the mechanisms controlling the transition
from bone-resorbing to bone-forming phases (i.e., reversal phase) have been investigated4,5,6. These mechanisms are regulated by insulin-like growth factor I and transforming growth factor-β
released from the bone matrix during bone resorption5, sphingosine-1-phosphate7, collagen triple helix repeat containing 18, Semaphorin 4d9, ephrin B210, and receptor activator of NF-κB
ligand (RANKL)/RANK reverse signaling11. Notably, all of these factors contribute to the transition from bone-resorbing to bone-forming phases. Nevertheless, the molecular and cellular
mechanisms terminating osteoblastic bone formation and promoting osteoclastic bone resorption (i.e., “reciprocal” reversal phase) remain elusive. Intravital optical imaging using multiphoton
microscopy can help dissect in vivo cellular dynamics in various intact tissues and organs12,13,14. To understand the spatiotemporal dynamics of bone remodeling in vivo, we established an
intravital imaging technique to visualize the intact bone tissues of living mice15,16,17,18. Using this method, we explored the interplay between bone-destroying osteoclasts and bone-forming
osteoblasts and found that direct cell-to-cell contact led to the inhibition of osteoclastic bone resorption19. However, the spatial resolution of intravital bone imaging was insufficient
to visualize structures smaller than cells. In this study, we established an advanced high-resolution microscopy system to visualize extracellular vesicles secreted and captured by mature
osteoblasts (mOBs) in vivo. We identified a subset of mOB-derived vesicles limiting bone formation and stimulating osteoclastogenesis, thus regulating the “reciprocal reversal phase,”
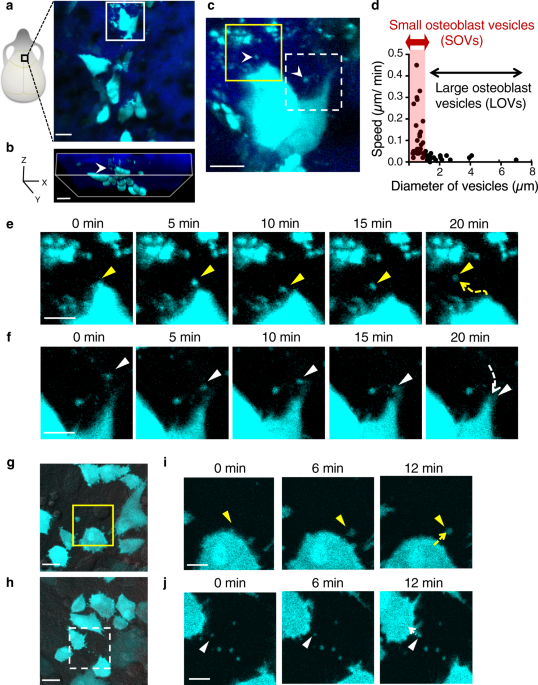
through a microRNA (miRNA)-mediated mechanism. RESULTS VISUALIZATION OF SMALL OSTEOBLAST-DERIVED VESICLES We have previously generated reporter mice expressing enhanced cyan fluorescent
protein (ECFP) in mOBs driven by a 2.3 kb fragment of rat type I collagen α promoter (Col1a1*2.3) (Col2.3-ECFP mice). In this reporter line, ECFP is expressed in bone-forming mOBs but not in
immature osteoblasts19. We performed intravital multiphoton imaging using high spatial resolution to visualize bone tissues in Col2.3-ECFP mice, and observed many ECFP-positive vesicles in
the vicinity of the cell bodies of mOBs (Fig. 1a–c). Tracking analyses showed that the small osteoblast vesicles (SOVs) had a diameter of ≤1 µm and had a higher speed than large osteoblast
vesicles (LOVs), which were >1 µm in diameter (Fig. 1d). Moreover, time-lapse imaging revealed that SOVs were released to the extracellular space and were taken up by mOBs in vivo within
~20 min (Fig. 1e, f; Supplementary Video 1). SOV release and uptake were also observed in vitro in primary osteoblasts from Col2.3-ECFP mice (Fig. 1g–j; Supplementary Videos 2, 3). The
uptake of SOVs by mOBs was confirmed by co-culture of mOBs and membrane-labeled SOVs (Supplementary Fig. S1a–c; Supplementary Videos 4, 5). We also found that SOVs expressed CD63, a marker
of extracellular vesicles20 (Supplementary Fig. S1d, e). These results suggest that mOBs actively secrete and take up SOVs both in vivo and in vitro, communicating via extracellular SOVs in
a paracrine or autocrine manner. SOVS OF APPROXIMATELY 400 NM IN DIAMETER SUPPRESS OSTEOBLAST DIFFERENTIATION To characterize SOVs, we performed electron microscopy and nanoparticle tracking
analyses to evaluate the morphology and size distribution of isolated SOVs from primary osteoblasts (Fig. 2a–e). Electron microscopy showed that the diameter of SOVs ranged from 100 nm to 1
µm, and that the structures and electron densities of SOVs varied (Fig. 2b). Nanoparticle tracking analyses revealed two peaks associated with different SOV sizes: one around 200 nm in
diameter (hereafter called SOV-F1) and one around 400 nm in diameter (hereafter called SOV-F2) (Fig. 2c). SOV-F1 were isolated by 0.22-µm filtration (Fig. 2a); the collected SOV-F1 had
similar sizes and electron densities (Fig. 2d, e). As the SOVs observed by intravital imaging ranged in size from 0.26 to 1 µm, they were likely SOV-F2. Extracellular vesicles are composed
of a lipid bilayer containing transmembrane proteins, as well as enclosed cytosolic proteins and RNAs (especially mRNAs and miRNAs). Extracellular vesicles are thought to serve as a mode of
communication among neighboring or distant cells21,22. Here, we investigated the role of SOVs in the communication of neighboring osteoblasts. The relative expression levels of genes related
to osteoblast differentiation in primary osteoblasts were analyzed 2 days after treatment with phosphate-buffered saline (PBS), total SOVs (F1 + F2), or SOV-F1 (Fig. 2f). The expression
levels of _runt-related transcription factor 2_ (_Runx2)_ and _Osterix_ (also known as _Sp7_), master transcription factors involved in osteoblast differentiation23,24,25, as well as those
of the osteoblastic matrix proteins type 1 collagen (_Col1a1_) and osteocalcin (also known as _Bglap_), were significantly lower in the SOV-treated group than in the PBS control group (Fig.
2f). Total SOVs (F1 + F2) were more potent than SOV-F1 in suppressing the expression of osteoblast-related genes, suggesting that large SOVs mediate this transcriptional regulation.
Consistently, in the osteoblastic cell line MC3T3-E1, the relative mRNA levels of _Runx2_ and _Sp7_ were significantly lower in the total SOV-treated group than in the PBS control group in a
dose-dependent manner (Supplementary Fig. S2a). SOV-F1 treatment moderately affected the expression of _Runx2_ but not the expression of _Sp7_ (Supplementary Fig. S2b). To exclude the
effects of proteins and RNAs outside the extracellular vesicles, such as membrane fragments and anchor proteins on the SOV membrane, we examined whether proteinase K and/or RNase treatment
modulated the effects of SOVs on _Runx2_ and _Sp7_ expression. Inhibition by SOVs was unaffected by RNase and proteinase K (Supplementary Fig. S2c)26, indicating that components in SOVs, but
not protein and RNA contaminants outside SOVs, were responsible for the inhibition of _Runx2_ and _Sp7_ expression. We performed alkaline phosphatase (ALP; _Alpl_) staining to assess
bone-forming activity in SOV-treated cells. ALP activity was significantly suppressed in the total SOV-treated group but not in the SOV-F1-treated group (Fig. 2g, h). We also assessed
collagen production and mineralization by SOV-treated osteoblasts by Fast Green/Sirius Red staining and Alizarin Red S staining, respectively. Collagen production and mineralization by total
SOV-treated osteoblasts were inhibited, compared with PBS control and SOV-F1-treated osteoblasts (Supplementary Fig. S2d, e). Next, we analyzed the effect of SOVs on cell death using
7-amino actinomycin D (7-AAD) staining; however, we found no significant differences among the groups (Fig. 2i). These results suggest that total SOVs (F1 + F2), but not SOV-F1, suppress
osteoblast differentiation without affecting cell viability. SOV-TREATED OSTEOBLASTS PROMOTE OSTEOCLASTOGENESIS Osteoblast-lineage cells produce RANKL, encoded by the _Tnfsf11_ (also known
as _Rankl_) gene, an essential factor for osteoclastogenesis27,28, and osteoprotegerin (_Opg_), a decoy receptor for RANKL28,29, to regulate osteoclast differentiation and function.
Therefore, we investigated the roles of SOVs in the expression of _Rankl_ and _Opg_. The expression level of _Rankl_ was significantly higher in the total SOV-treated group than in the PBS
control group. In addition, the expression level of _Opg_ was significantly lower in the total SOV-treated group than in the PBS control group. However, SOV-F1 did not affect _Rankl_ or
_Opg_ expression (Fig. 3a). These results suggested an increased osteoclastogenic potential in total SOV-treated mOBs. Therefore, we assessed osteoclast differentiation using bone marrow
macrophages (BMMs) co-cultured with either total SOV-treated osteoblasts or PBS-treated osteoblasts. When starting the co-culture, we washed out SOVs with culture medium to prevent SOVs from
directly affecting BMMs. Tartrate-resistant acid phosphatase (TRAP)-positive mature osteoclasts (mOCs) were generated within 3 days of co-culture of BMMs with total SOV-treated osteoblasts
without additional supplementation of recombinant RANKL. In contrast, no significant mOC generation was observed when BMMs were co-cultured with PBS-treated osteoblasts (Fig. 3b, c). To
confirm the promotion of osteoclastogenesis by SOV-treated osteoblasts, we evaluated the expression levels of mOC marker genes: _Ctsk_, _Acp5_, and _Atp6v0d2_. The expression levels of all
mOC marker genes were significantly higher in BMMs co-cultured with total SOV-treated osteoblasts than in BMMs co-cultured with PBS-treated osteoblasts (Supplementary Fig. S3a). Moreover,
mOCs were exclusively induced on the nodules created by total SOV-treated osteoblasts in this co-culture system (Fig. 3b), indicating that SOVs serve as a local regulator of
osteoclastogenesis by regulating osteoblasts. To exclude the direct effect of SOVs on BMMs, we cultured BMMs with SOVs in the presence or absence of macrophage colony-stimulating factor
(M-CSF) without osteoblasts. At 3 and 7 days after SOV treatment, we evaluated osteoclast differentiation by TRAP staining. Both PBS-treated and SOV-treated BMMs did not differentiate into
mOCs within 3 or 7 days, irrespective of the presence of M-CSF (Supplementary Fig. S3b). Therefore, we concluded that SOVs do not independently affect osteoclastogenesis. In the bone tissues
of Col2.3-ECFP/TRAP-tdTomato mice, in which mOBs and mOCs were labeled with ECFP and tdTomato, respectively19, intravital imaging revealed that TRAP-positive mOCs were preferentially
present in close vicinity of ECFP-positive mOBs actively secreting SOVs (Fig. 3d). Quantitative microscopic analysis showed that TRAP-positive mOCs coincided with mOBs surrounded by SOVs
(Fig. 3e). These results suggest that SOV-treated osteoblasts stimulate osteoclast differentiation. Because SOVs inhibited osteoblast differentiation and SOV-treated osteoblasts promoted
osteoclastogenesis, we evaluated the effects of SOVs on bone formation in vivo. We established bilateral calvarial defects in wild-type (WT) mice. Bone defects were exposed to hydrogels
impregnated with PBS or total SOVs for 8 weeks (Fig. 3f). The affected areas were significantly larger in the SOV-treated group than in the PBS-treated group (Fig. 3g, h), indicating that
SOVs inhibited bone repair in vivo. SOV-DERIVED MIR-143-3P SUPPRESS OSTEOBLAST DIFFERENTIATION BY TARGETING _CBFB_ MRNA To identify the mechanism by which SOVs suppress osteoblast
differentiation, we analyzed miRNAs commonly found in SOVs21,22 via next-generation sequencing. We identified miR-21a-5p, miR-143-3p, and miR-148a-3p as miRNAs enriched in SOVs (Fig. 4a). To
determine the roles of these miRNAs in osteoblast differentiation, we transfected MC3T3-E1 cells with miRNA mimics and analyzed the expression levels of the osteoblastic genes _Runx2_ and
_Sp7_. The miR-143-3p mimics significantly suppressed the expression of _Runx2_ and _Sp7_ (Fig. 4b); they also inhibited ALP activity (Fig. 4c). The effects of miR-143-3p mimics on
osteoblast differentiation were similar to the effects of total SOVs. Furthermore, transfection of miR-143-3p mimics significantly increased the expression of _Rankl_ and suppressed the
expression of _Opg_ in MC3T3-E1 cells, consistent with the effects of SOV-treated osteoblasts on osteoclastogenesis (Supplementary Fig. S4a, b). To determine the molecular mechanisms by
which miR-143-3p controls the expression levels of _Runx2_, _Sp7_, and _Rankl_, we analyzed its potential targets using Target Scan 7.2 and miRbase 22.1. Among hundreds of predicted mRNA
targets, we focused on core-binding factor β (_Cbfb_), which may regulate the expression levels of _Runx2_ and _Sp7_. Cbfb has been reported to form heterodimers with Runx proteins, thereby
enhancing their DNA-binding capacity30. Osteoblast-specific _Cbfb_ conditional deletion in _Col1a1_-cre mice has also been reported to downregulate _Runx2_ and _Sp7_, while inhibiting
osteoblast differentiation31,32,33. Consistent with previous findings, _Cbfb_ silencing in MC3T3-E1 cells significantly decreased the _Runx2_ and _Sp7_ mRNA levels (Fig. 4d). To assess the
ability of miR-143-3p to directly bind to _Cbfb_ mRNA, we generated luciferase reporter constructs containing WT or mutant _Cbfb_ mRNA binding sites (Fig. 4e). Each construct was transfected
into MC3T3-E1 cells in combination with miR-143-3p mimics. The miR-143-3p mimics significantly inhibited luciferase activity in MC3T3-E1 cells expressing the WT _Cbfb_ binding site, but
they did not inhibit luciferase activity in cells expressing the mutant binding site (Fig. 4f). Furthermore, the expression level of _Cbfb_ was significantly decreased in MC3T3-E1 cells
transfected with miR-143-3p mimics (Fig. 4g). These findings suggest that miR-143-3p binds directly to _Cbfb_ mRNA. miR-143-3p drives osteoblast differentiation by targeting histone
deacetylase 7 (_Hdac7_)34. Therefore, we performed a luciferase assay to evaluate the ability of miR-143-3p to bind to _Hdac7_ mRNA. miR-143-3p mimics did not affect luciferase activity in
MC3T3-E1 cells expressing WT or mutant _Hdac7_ binding sites (Supplementary Fig. S4c, d). Total SOVs (F1 + F2), but not SOV-F1, significantly decreased the mRNA level of _Cbfb_ in primary
osteoblasts (Fig. 4h). In contrast, neither total SOVs nor SOV-F1 affected _Hdac7_ expression (Supplementary Fig. S4e), indicating that miR143 in SOVs does not affect the expression level of
_Hdac7_ in SOV-treated osteoblasts. Collectively, these findings suggest that SOV-derived miR-143-3p suppresses osteoblast differentiation by targeting _Cbfb_. To confirm the transfer of
miR-143-3p enclosed in SOVs to recipient osteoblasts, we visualized miR-143-3p in SOVs. We labeled endogenous miR-143-3p by transfecting Alexa555-conjugated miR-143-3p inhibitor into
EGFP-expressing MC3T3-E1 cells and collected SOVs from the transfected cells. These SOVs were administered to non-labeled MC3T3-E1 cells and observed by confocal microscopy. Alexa555-labeled
miR-143-3p colocalized with EGFP-positive vesicles in non-labeled MC3T3-E1 cells (Supplementary Fig. S4f). This finding suggests that miR-143-3p is enclosed in SOVs and transferred into
recipient cells. MIR-143/145 CONDITIONAL KNOCKOUT INCREASES BONE MASS AND PROMOTES BONE MINERALIZATION IN MICE To further investigate the role of miR-143-3p in bone metabolism in vivo, we
generated an osteoblast-specific miR-143/145 knockout (KO) mouse model (miR-143/145Osx−/−) by crossing miR-143/145 flox/flox mice with Osx1-Cre mice, in which Cre expression is regulated by
the _Osterix_ promoter. Because miR-143 and miR-145 are on the same gene locus, the miR-143 and -145 genes were floxed in these mice. Osx-expressing cells during the perinatal period give
rise to osteoblasts, stromal cells, adipocytes, and perivascular cells; in the postnatal period, the expression of _Osterix_ is restricted to osteoblasts35. In Osx1-Cre mice, Cre-mediated
recombination was under the control of doxycycline. Using this system, we generated miR-143/145Osx−/− mice expressing Cre exclusively at the postnatal period when mated to floxed-transgenic
strains. Compared with control 9-week-old mice, miR-143/145Osx−/− mice expressed low levels of miR-143-3p in primary osteoblasts (Supplementary Fig. S5a). The mRNA levels of _Runx2_, _Sp7_,
and _Bglap_ in primary osteoblasts were significantly higher in miR-143/145Osx−/− mice than in littermate control mice (Supplementary Fig. S5b). Micro-computed tomography (CT) analyses
revealed that, compared with control mice, miR-143/145Osx−/− mice had an increased bone volume/tissue volume (BV/TV) and bone mineral density (BMD) (Fig. 5a, b). Similarly, bone morphometric
analyses showed that the parameters of bone formation—including osteoid volume/bone volume (OV/BV), mineral apposition rate (MAR), and bone formation rate/tissue volume (BFR/TV)—were
significantly increased in miR-143/145Osx−/− mice, compared with littermate control mice (Fig. 5c, d). Although the osteoblast surface/bone surface (Ob.S/BS) was comparable between
miR-143/145Osx−/− and control mice (Supplementary Fig. S5c), the cuboidal Ob.S/Ob.S (ratio of Ob.S of mOBs to Ob.S of total osteoblasts) was significantly higher in miR-143/145Osx−/− mice
than in control mice (Fig. 5d). Therefore, osteoblast-specific miR-143/145 depletion increased bone mass and promoted mineralization. MIR-143/145 CONDITIONAL KNOCKOUT DECREASES OSTEOCLAST
ACTIVITY AFTER PARATHYROID HORMONE ADMINISTRATION IN VIVO Because deletion of miR143-3p in osteoblasts in vivo using miR-143/145Osx−/− mice did not influence any parameters of osteoclast
formation or function (Supplementary Fig. S5c), we performed bone morphometric analyses of miR-143/145Osx−/− mice under the high bone-metabolic turnover condition. We intermittently injected
parathyroid hormone (PTH) into WT and miR-143/145Osx−/− mice, then performed micro-CT analysis, bone morphometric analysis, and measurement of the urine C-terminal telopeptide-1 (CTX-1)
level, which reflects osteoclast activity36. Micro-CT and bone morphometric analyses revealed that there were no significant differences in BV/TV between PTH-treated WT mice and PTH-treated
miR-143/145Osx−/− mice (Supplementary Fig. S6a, c). The urine CTX-1 level (corrected for urine creatinine) was significantly lower in miR-143/145Osx−/− mice than in WT mice (Supplementary
Fig. S6b). Consistent with those findings, morphometric analyses revealed that eroded surface/bone surface (ES/BS), osteoclast number/bone surface (N.Oc/BS), and osteoclast surface/bone
surface (Oc.S/BS) were significantly lower in PTH-treated miR-143/145Osx−/− mice than in PTH-treated WT mice (Supplementary Fig. S6c). Therefore, miR-143/145 osteoblast-specific knockout
mice showed significantly decreased osteoclast activity and number compared with WT mice, indicating that miR-143/145 in osteoblasts promotes osteoclastogenesis in vivo under a high
bone-metabolic turnover condition (Supplementary Fig. S6b, c). MIR-143/145-DELETED SOVS REVERSED THE INHIBITION BY SOVS OF BONE REPAIR To investigate the effects of miR-143 in SOVs on
osteoblast differentiation and osteoclastogenesis, we analyzed the effects of SOVs from miR-143/145Osx−/− mice on _Runx2_, _Sp7_, and _Rankl_ expression levels in osteoblasts in vitro. The
miR-143/145-deleted SOVs significantly reversed the inhibition (by WT SOVs) of _Runx2_ and _Sp7_ expression (Supplementary Fig. S7a). In addition, miR-143/145-deleted SOVs significantly
reversed the enhancing effect of WT SOVs on _Rankl_ expression in osteoblasts (Supplementary Fig. S7b). Next, to analyze the function of miR-143 in SOV on bone formation in vivo, bilateral
calvarial defects in WT mice were exposed to gelatin hydrogels impregnated with total SOVs from miR-143/145 KO or WT mice (Fig. 5e). At 2 weeks after the procedure, the affected areas were
significantly smaller in areas treated with total SOVs from miR-143/145 KO mice, than in areas treated with total SOVs from WT mice (Fig. 5f, g), suggesting that miR-143 in SOVs impairs bone
repair. In summary, these results suggest that SOVs inhibit osteoblastic bone formation and stimulate osteoclast formation through an miR-143-mediated mechanism, which promotes reciprocal
reserve phase switch (Fig. 6). DISCUSSION Bone formation by osteoblasts is a long-lasting phase that may last several months and is tightly regulated during bone remodeling37. Although the
signaling and transcriptional regulation of osteoblast differentiation have been investigated38,39, the terminating factors of bone formation and initiating factors of subsequent bone
resorption remain elusive. Using an intravital bone imaging approach, we identified intercellular communication among osteoblasts via SOVs and demonstrated negative regulation of bone
formation and positive regulation of bone resorption by SOVs derived from mOBs. Osteoblasts co-cultured with SOVs inhibited osteoblastogenesis and enhanced the osteoclastogenesis of BMMs.
The effect of SOVs on osteoclastogenesis was not a direct effect of SOVs on BMMs; it was caused by phenotypic changes, such as the upregulation of _Rankl_ in SOV-treated osteoblasts.
Consistent with this finding, mOCs were exclusively induced on nodules that had been created by total SOV-treated osteoblasts in the co-culture system, indicating that osteoblast–osteoblast
communication via SOVs is important for spatiotemporal regulation of osteoclastogenesis. These observations suggest that communication among osteoblasts by means of SOVs induces a phase
transition from bone formation to bone resorption as a spatiotemporal bone remodeling regulation mechanism. It is widely accepted that bone formation follows bone resorption2; however, our
findings suggest that osteoblast–osteoblast communication via SOVs can directly induce osteoclastogenesis, providing further insights into bone homeostasis. The possibility of immediate
transition to bone resorption after the bone formation phase without a resting phase remains controversial6. We believe that direct transition from bone formation to bone resorption may
happen under high turnover conditions and dysregulated remodeling conditions, such as osteoporosis40,41 and bone repair. Future studies are needed to confirm this hypothesis. We identified
_Cbfb_ mRNA as a target of miR-143-3p in osteoblasts. The bone phenotype of miR-143/145Osx−/− mice was consistent with the phenotype of _Cbfb_ conditional KO (_Cbfb_col1a1−/−) mice33.
_Cbfb_col1a1−/− mice in the postnatal period exhibited reduced bone mass, MAR, and _Runx2_ expression. Although the number of osteoblasts was unchanged, the number of active osteoblasts
decreased in _Cbfb_col1a1−/− mice33. Notably, miR-143/145Osx−/− mice exhibited a phenotype opposite to the findings in _Cbfb_col1a1−/− mice (i.e., increased bone mass, MAR, _Runx2_ mRNA
expression, and ratio of mOBs to total osteoblast area [cuboidal Ob.S/Ob.S]). MiR-143 was previously shown to inhibit _Sp7_ mRNA expression in osteoblasts, as indicated by luciferase assay
results using human _Sp7_ mRNA sequences42,43. However, according to two major databases, Target Scan 7.2 and miRBase 22.1, murine _Sp7_ mRNA does not have complementary base sequences to
bind to mmu-miR-143-3p. Thus, the suppressed _Sp7_ expression in murine osteoblasts transfected with miR-143-3p mimics was presumably not caused by direct binding of miR-143-3p mimics to
_Sp7_ mRNA; it was likely dependent on the decreased expression of _Runx2_ caused by miR-143-3p binding to _Cbfb_ mRNA. In addition to the effect of miR-143-3p on osteoblast differentiation,
we demonstrated that miR-143-3p increased the _Rankl/Opg_ ratio in MC3T3-E1 cells. Although increasing _Rankl/Opg_ in osteoblasts should enhance osteoclastogenesis, the parameters of
osteoclast formation and function were not affected in miR-143/145Osx−/− mice at steady state (Supplementary Fig. S5c), consistent with the phenotype of _Cbfb_col1a1−/− mice33. However, the
parameters were significantly decreased in miR-143/145Osx−/−, compared with control mice, following intermittent PTH administration. The phenotypes of osteoclast formation and function in
miR-143/145Osx−/− mice were enhanced by intermittent PTH administration with increasing bone turnover. In addition to endogenous effects in osteoblasts, we evaluated the effects of miR-143
in SOVs. MiR-143-containing SOVs significantly upregulated _Rankl_ expression in SOV-treated osteoblasts; this change was reversed by miR-143/145-deleted SOVs. This finding suggests that
miR-143-3p in SOVs induced a phenotypic change of osteoblasts to enhance osteoclastogenesis. Therefore, miR-143 is essential for the ability of SOVs to inhibit bone formation and promote
bone resorption. Although miR-143 directly binds to _Cbfb_ mRNA and inhibits osteoblast differentiation, the mechanism by which miR-143 increases _Rankl_ expression in osteoblasts is
unknown. Runx2 regulates _Rankl_ expression by condensing the chromatin structure at the _Rankl_ enhancer and promoter regions in a histone deacetylase 3-dependent manner44. Decreased
_Runx2_ expression might have led to _Rankl_ upregulation in osteoblasts treated with SOVs or miR-143-3p mimics. However, the miR-143/145-deleted SOVs did not totally cancel the effect of WT
SOVs on _Runx2_ and _Rankl_ expression, implicating other factors in SOVs. Other proteins and nucleic acids in SOVs may also affect osteoblast differentiation and function. Future studies
are needed to identify functional proteins and/or other components in these vesicles. In conclusion, our findings provide an insight into the in vivo interactions among mOBs via SOVs and
demonstrate that SOVs are critical factors regulating reciprocal reversal switch in a miR-143-dependent mechanism. METHODS MOUSE MODEL C57BL/6J mice were obtained from CLEA Japan (Tokyo,
Japan). The generation of Col1a1*2.3-ECFP and TRAP-tdTomato transgenic mice was described previously18,19. miR-143/145-floxed mice and miR-143/145 KO mice45 were kindly provided by Thomas
Boettger and Thomas Braun, Max-Plank-Institute, Germany. To generate the loxP-mice, we generated a miR-143/145 lox/lox targeting vector by subcloning the miR-143/145 locus45. A loxP site was
inserted into the HindIII site 1 kb upstream of miR-143, and a second loxP site plus a neomycin resistance cassette was inserted into the HindIII site 2.3 kb downstream of miR-145. Mice
were generated as described previously45. Osx1-GFP:Cre mice were obtained from the Jackson Laboratory (Stock Number: 006361). miR-143/145Osx−/− mice and their littermates were fed a diet
containing doxycycline 0.02% (v/v) via breastfeeding until becoming 4 weeks old. Nine-week-old mice were analyzed for bone phenotypic changes. Male mice (10–20 weeks of age) were used unless
indicated otherwise. The number of animals used is indicated in the corresponding figure legend. All mice were housed in specific pathogen-free facilities under a 12 h light/dark cycle and
controlled temperature (19–23 °C) and humidity (55 ± 10%). Mice were given standard laboratory chow diet and water _ad libitum_ unless indicated otherwise. Animal studies were approved by
the Institutional Review Board of Osaka University. CELL CULTURE In vitro osteoblast differentiation has been described previously19,46. Briefly, bone marrow cells (5.3 × 10⁵ per cm2) were
collected by flushing long bones of mice and maintained for 3 days in α-minimum essential medium (α-MEM) containing 10% fetal bovine serum (FBS) and 1% penicillin–streptomycin at 37 °C in a
humidified incubator containing 5% CO2. The cells were maintained in osteogenic medium (α-MEM, 10% FBS, 1% penicillin–streptomycin, 50 mg/mL ascorbic acid, and 10 mM beta-glycerophosphate)
for 14 days to promote osteoblastic differentiation and mineralization. The osteogenic medium was refreshed every 3 days. MC3T3-E1, a clonal osteoblastic cell line derived from newborn mouse
calvaria, was purchased from the American Type Culture Collection (CRL-2593™: ATCC, Manassas, VA, USA). Cells (1.05 × 10⁴ per cm2) were maintained for 2 days in α-MEM containing 10% FBS and
1% penicillin–streptomycin. For osteoblastic differentiation and mineralization, cells were maintained in osteogenic medium, which was refreshed every 3 days. To generate BMMs, non-adherent
bone marrow cells from C57BL/6J mice were seeded in a 10 cm Petri dish and cultured in α-MEM containing 10% FBS, 1% penicillin–streptomycin, and 10 ng/mL M-CSF. After 3 days, adherent cells
were collected in enzyme-free cell dissociation buffer (Millipore, Burlington, MA, USA) at 37 °C and used as BMMs. INTRAVITAL MULTIPHOTON IMAGING Col1a1*2.3-ECFP mice and
Col2.3-ECFP/TRAP-tdTomato double transgenic reporter mice were anesthetized with isoflurane (Escain; 2.5% vaporized in an 80:20 mixture of O2 and air), and the hair on the neck and the scalp
was removed using hair removal lotion (Epilat). The front-parietal skull was exposed after the skin incision, and the head was immobilized in a custom-made stereotactic holder19. Intravital
multiphoton imaging was performed as described previously15,16,17,18,19. The imaging system for Col1a1*2.3-ECFP mice was composed of a multiphoton microscope (LSM 780 NLO; Carl Zeiss)
driven by a laser (Chameleon Vision II Ti: Sapphire; Coherent) at 860 nm and an upright microscope equipped with a 20× water immersion objective (W Plan-APOCHROMAT; Carl Zeiss). The
microscope was enclosed in an optimally customized chamber in which the temperature was controlled to warm the anesthetized mice. The heart rate of the mice was monitored by
electrocardiography. Fluorescent cells were detected by a spectral imaging microscope. The step size was adjusted to 2 μm to create Z-stack images; five slices were captured as the depth was
10 µm. Images were recorded with pixel dimensions of 0.26 μm and a time interval of 5 min. Raw imaging data were processed to 3D images and maximum intensity projection (MIP) on Z with NIS
Elements software (Nikon). Constant g corrections were applied to all images (g = 0.65) with NIS Elements software to enhance the signal-to-noise ratio. MIP data were edited to surface
images with Imaris software (Bitplane). The tracking analysis was performed using the surface function. Surface objects were created manually and filtered according to tracking time (>20
min). The imaging system for Col2.3-ECFP/TRAP-tdTomato mice consisted of an upright multiphoton microscope (A1R MP+; Nikon) with a 25× water immersion objective (CFI75 Apo 25XC W 1300;
Nikon). The system was driven by lasers (Chameleon Vision II Ti: Sapphire; Coherent, Inc.); the main laser was tuned to 860 nm to detect ECFP and second harmonic generation, and the
sub-laser was tuned to 1040 nm to detect tdTomato. Multi-fluorescence images were acquired under a Nikon upright microscope using four external non-descanned detectors equipped with dichroic
and emission filters, including an infrared-cut filter (DM685), three dichroic mirrors (DM458, DM506, and DM605), and three emission filters (417/60 for the second harmonic generation
image, 480/40 for ECFP, 583/22 for tdTomato). IN VITRO TIME-LAPSE IMAGING Primary osteoblasts from Col2.3-ECFP mice cultured for 10–14 days and CD63-GFP MC3T3-E1 cells cultured for 3 days
were observed, and time-lapse images were captured using a Nikon A1-Si confocal laser scanning microscope. Primary osteoblasts and CD63-GFP MC3T3-E1 cells were excited at 457 nm and 561 nm
for primary osteoblasts and 488 nm for CD63-GFP MC3T3-E1 cells (Coherent). Autofluorescence was collected with photomultiplier-type detectors at wavelength emission windows of 482/35 nm for
the 457 nm laser to detect ECFP, 525/50 nm for the 488 nm laser to detect EGFP, and 595/50 nm for the 561 nm laser to detect PKH26. Images were recorded with pixel dimensions of 0.31 or 0.63
µm. Raw imaging data were edited with NIS Elements software (Nikon). Constant g corrections were applied to all images (g = 0.65) to enhance the signal-to-noise ratio. MIP data were edited
to surface images with Imaris software (Bitplane). ISOLATION OF SOVS SOVs were isolated from primary osteoblasts or MC3T3-E1 cells according to a previously described procedure47. Briefly,
the culture medium was replaced with EV-free osteogenic medium (containing 10% EV-free FBS prepared by centrifugation at 70,000 × _g_ overnight instead of 10% FBS) 2 days before SOV
collection. The culture medium was collected, and cells were treated with 0.2% collagenase P (Roche) for 1 h at 37 °C followed by 0.25% trypsin (containing 0.02% EDTA) for 10 min at 37 °C.
The culture medium and digested cells were centrifuged at 300 × _g_ for 5 min at 4 °C to separate cells, and the supernatant was centrifuged at 2000 × _g_ for 20 min at 4 °C to remove
debris. The supernatant was further centrifuged at 16,500 × _g_ for 20 min at 4 °C. The pellet containing SOVs was resuspended in PBS and divided into two groups: total SOVs (F1 + F2) and
SOV-F1 (0.22-µm filtration). Both groups were treated with 0.5 mg/mL RNase A (Nippon Gene) at 37 °C for 20 min and were centrifuged at 16,500 × _g_ for 20 min to wash. For proteinase K
treatment, SOVs were treated with proteinase K (final concentration: 0.1 mg/mL) for 20 min at 37 °C, then incubated for 5 min at 90 °C to inactivate proteinase K. EV experiments were
performed based on the criteria presented by the International Society of Extracellular Vesicles position paper in 201826. PKH-LABELING OF SOVS SOVs were collected from primary osteoblasts
cultured for 14 days. SOVs were then labeled with PKH26 Red Fluorescent Cell Linker Kit (Sigma-Aldrich) at room temperature for 5 min, blocked with FBS, and washed four times with PBS in
accordance with the manufacturer’s instructions. Primary osteoblasts cultured for 10–14 days were treated with PKH-labeled SOVs and were observed under a confocal microscope. GENERATION OF
STABLE CELL LINES The lentiviral vector pCT-CD63-GFP (System Biosciences) and a packaging plasmid for generation of a CD-63-GFP MC3T3-E1 cell line or the pMYs-IRES-GFP Retroviral Vector
(CELL BIOLABS) for generation of a MC3T3-E1 GFP cell line were transfected into HEK293T cells using PEI max (Polysciences). MC3T3-E1 cells were transduced with virus-containing medium from
transfected HEK293T cells and polybrene (Merck) 48 h after transfection. Transduced MC3T3-E1 cells expressing GFP were selected using a cell sorter (SONY), and single cells were cultured to
establish a cell line. IMAGING FLOW CYTOMETRY Primary osteoblast samples from Col1a1*2.3-ECFP transgenic mice were prepared after 14 days of culture and were treated with PKH-labeled total
SOVs. Samples were then analyzed using an ImageStreamX Mark II cytometer (Amnis, EMD Millipore) at a low flow rate and high sensitivity using 60-fold magnification. Cells were collected by
centrifugation at 300 × _g_ after treatment with 0.2% collagenase P (Roche) for 1 h at 37 °C, followed by 0.25% trypsin (containing 0.02% EDTA) for 10 min. Single-cell suspensions (2 ×
107/mL) in flow cytometry (FACS) buffer were incubated with PE-Cy7 conjugated anti-mouse CD45 antibody (BioLegend) diluted in FACS buffer at 1:100 ratio for 15 min. CFP, CD45-PE-Cy7, and
PKH26 were excited at 495 nm (CFP) and 488 nm (CD45-PECy7 and PKH26) and were detected at 435–505 nm (CFP), 745–785 nm (CD45-PECy7), and 642–745 nm (PKH26). Flow cytometric data were
analyzed using IDEAS software (Amnis, EMD Millipore). TRANSMISSION ELECTRON MICROSCOPY Collected total SOVs (F1 + F2) or SOV-F1 were fixed with iPGell (Geno Staff). Samples were washed and
post-fixed in 1% osmium tetroxide at 4 °C for 90 min. Subsequently, samples were dehydrated in graded ethanol with propylene oxide and embedded in epoxy resin. Semi-thin sections (75 nm)
were mounted on copper grids and observed using an H-7650 transmission electron microscope (Hitachi Electronic Instruments). NANOPARTICLE TRACKING ANALYSIS Nanoparticle tracking analysis was
performed using Nanosight LM10 and NTA2.3 software (NanoSight). Samples were diluted 100-fold with PBS, and 30-s videos were recorded at the same camera level and detection threshold on the
same day. The temperature was monitored throughout the measurements. TREATMENT OF SOVS Primary osteoblasts cultured in 24-well plates for 6 days were treated with PBS, total SOVs (F1 + F2),
or SOV-F1. SOVs were collected from primary osteoblasts that had been cultured for 14 days. The final concentrations of total SOVs (F1 + F2) and SOV-F1 were 1–5 × 10⁹/mL. MC3T3-E1 cells
cultured in 24-well plates for 21 days were treated with PBS, total SOVs (F1 + F2), or SOV-F1. SOVs were collected from MC3T3-E1 cells that had been cultured for 28 days. The final
concentrations of total SOVs (F1 + F2) and SOV-F1 were 1–5 × 10⁹/mL. Total RNAs were extracted 2 days after treatment, and ALP staining was performed 5 days after treatment. For collagen and
Alizarin Red S staining, we treated primary osteoblasts cultured in 24-well plates for 3 days with PBS, total SOVs (F1 + F2), or SOV-F1 from primary osteoblasts that had been cultured for
14 days, then stained them 3 days after treatment. RNA ISOLATION AND QUANTITATIVE REAL-TIME PCR Total RNA and cDNA were prepared using the Maxwell 16 LEV RNA purification kit (Promega) and
Superscript III reverse transcriptase (Thermo Fisher Scientific) in accordance with the manufacturer’s instructions. Quantitative real-time PCR (qPCR) was performed using a TP800 Dice
Real-Time Thermal Cycler System (TaKaRa). Gene expression was calculated relative to that of the housekeeping gene β-actin. The primer sequences used are listed in Supplementary Table 1. ALP
AND TRAP STAINING ALP substrate solution was prepared by dissolving 0.006% (w/v) Naphthol AS-MX phosphate (Sigma-Aldrich) in 0.1 M Tris (pH 8.0) and adding 0.1% (w/v) Fast blue BB salt
(Sigma-Aldrich). After fixation in 4% paraformaldehyde, cells were stained with ALP substrate solution for 10 min at room temperature in the dark and were rinsed with distilled water. For
quantitative analyses, ALP activities were assessed using a TRACP & ALP Assay Kit (TaKaRa Bio) in accordance with the manufacturer’s instructions. Cells were washed with saline and were
lysed using a commercial lysis solution. Samples were treated with ALP substrate for 15 min at 37 °C, and the absorbance at 405 nm was measured using a microplate reader. TRAP substrate
solution was prepared by dissolving 0.01% (w/v) Naphthol AS-MX phosphate (Sigma-Aldrich) in TRAP buffer (pH 5.0, 66 mM sodium acetate and 45 mM sodium tartrate) supplemented with 0.06% (w/v)
Fast Red Violet LB salt (Sigma-Aldrich). After fixation in 4% paraformaldehyde, cells were permeabilized with acetone ethanol (1:1) solution and stained with TRAP substrate solution for 5
min at room temperature. COLLAGEN STAINING AND ALIZARIN RED S STAINING For collagen staining, after fixation in Kahle Fixative, cells were stained with a dye solution in accordance with the
manufacturer’s instructions (Chondex). For Alizarin Red S staining, after fixation in 4% paraformaldehyde cells were stained with 2% Alizarin Red S solution (Fujifilm Wako Pure Chemical
Corporation). CELL DEATH ANALYSIS Primary osteoblasts cultured for 6 days were treated with PBS, total SOVs (F1 + F2), or SOV-F1 for 6 days. Cells were analyzed using a cell sorter (SH800,
Sony) to detect 7-AAD signals. Single-cell suspensions (1 × 10⁶/mL) were incubated with CD45-PECy7 (BioLegend) diluted in FACS buffer at 1:100 ratio for 15 min, and stained with 10 μg/ml
7-AAD (BD Biosciences) immediately before analysis to detect dead cells. Flow cytometry data were analyzed using FlowJo software (TreeStar). CO-CULTURE SYSTEM FOR OSTEOCLASTOGENESIS IN VITRO
BMMs were co-cultured with total SOV-treated osteoblasts or PBS-treated osteoblasts using a modified osteoclast culture method48. Primary osteoblasts cultured for 6 days were treated with
total SOVs or PBS. The culture medium containing SOVs or PBS was removed 2 days after treatment; BMMs (0.63 × 10⁵/cm2) were co-cultured with the osteoblasts in osteogenic medium with 100
ng/mL 1 alpha,25-dihydroxyvitamin D3 (Calcitriol, Fujifilm Wako Pure Chemical Corporation). Three days later, TRAP-positive multinucleated cells were counted as mOCs after TRAP staining and
qRT-PCR of mature osteoclast marker genes were performed. To evaluate the direct effect of SOVs on osteoclastogenesis, BMMs (1.5 × 10⁵/cm2) were cultured for 2 days with 10 ng/mL M-CSF. SOVs
(final concentration of 1–5 × 10⁹/mL) were added to the BMMs with or without 10 ng/mL M-CSF. Three and seven days later, TRAP staining was performed. MIRNA ISOLATION AND QPCR Total RNA
containing miRNAs was prepared using a miRNeasy Mini Kit (Qiagen). qPCR was performed using a TaqMan Advanced miRNA kit in accordance with the manufacturer’s instructions. The expression
level of each miRNA was calculated relative to that of miR-423-5p. NEXT-GENERATION MIRNA SEQUENCING SOV-derived RNAs from primary osteoblasts cultured for 14 days were isolated using
miRNeasy Mini Kit (Qiagen). Small RNA libraries were constructed using the NEBNext Small RNA Library Prep Set for Illumina (NEB) in accordance with the manufacturer’s instructions, and
libraries were sequenced on the HiSeq 2500 platform (Illumina) in 75-base pair single-end reads. The miRNA-seq analysis was conducted using CLC Genomics Workbench v9.5.3 (Qiagen) in
accordance with the small RNA alignment and small RNA analysis pipeline using default parameters. Adapters were trimmed to retain only reads of length 15–25 bp. Of 1,927,614 trimmed reads,
832,524 were then mapped and annotated against the miRBase (version 21). Read counts of the annotated miRNAs were exported from the CLC Genomics Workbench. Raw data were deposited in the
NCBI GEO database (GSE144512). TRANSFECTION OF MIRNA MIMICS MC3T3-E1 cells were maintained with serum- and antibiotic-free medium for 24 h. miRNA mimics of miR-143-3p, miR-21-5p, and
miR-148-3p and mimic negative control (mirVana™ miRNA mimics, Thermo Fisher Scientific) were transfected into MC3T3-E1 cells using Lipofectamine RNAiMAX (Thermo Fisher Scientific). RNA was
extracted 2 days after transfection. TRANSFECTION OF SIRNAS Cbfb siRNAs (Stealth RNAi™ siRNA, Thermo Fisher Scientific) or negative control siRNAs (Stealth RNAi™ siRNA Negative Control Lo
GC, Thermo Fisher Scientific) were transfected into MC3T3-E1 cells using Lipofectamine RNAiMAX (Thermo Fisher Scientific). RNA was extracted 2 days after transfection. LUCIFERASE REPORTER
ASSAY WT _Cbfb_ or _Hdac7_ sequence fragments containing predicted miR-143-3p binding sites were chemically synthesized and cloned downstream of the luciferase gene in the pmirGLO
Dual-Luciferase miRNA Target Expression Vector (Promega) between _SacI_ and _XbaI_ sites. Fragments with mutant binding sites were also synthesized and cloned as controls. MC3T3-E1 cells
cultured in 96-well plates (1 × 10⁴/well) were co-transfected with the recombinant reporter plasmids and miR-143-3p mimic or scramble negative controls using Lipofectamine 2000 (Invitrogen).
Cells were harvested 48 h after transfection, and luciferase activity was measured using the Dual-Glo Luciferase Assay System (Promega) and Luminescent Micro Plate Reader (Centro XS3 LB960,
Berthold Technologies). Firefly luciferase activity was normalized to that of Renilla luciferase. VISUALIZATION OF TRANSFER OF MIR-143-3P IN SOVS MC3T3-E1 EGFP cells were transfected with
Alexa Fluor 555-conjugated miR-143-3p inhibitor (mirVana miRNA Inhibitor, Thermo Fisher Scientific). SOVs were collected from the transfected cells 1 day after transfection. MC3T3-E1 cells
were treated with the collected SOVs, and the cells were observed with a confocal microscope (Nikon A1-Si) 1 day after treatment. Autofluorescence was collected with photomultiplier-type
detectors at wavelength emission windows of 452/45 nm (for the 488 nm laser to detect EGFP) and 525/50 nm (for the 488 nm laser to detect Alexa Fluor 555). Images were recorded with pixel
dimensions of 0.05 µm. The step size was adjusted to 0.1 μm to create Z-stack images; 96 slices were captured using a depth of 9.6 µm. Raw imaging data were edited using NIS Elements
software (Nikon). MICROSTRUCTURE ANALYSIS The right femurs were extracted from 9-week-old osteoblast-specific deletion of miR-143/145 (miR-143/145Osx−/−) and floxed (miR-143/145flox/+) male
mice (body weight: 20–24 g). A cone-beam X-ray micro-CT system (ScanXmate-RB090SS150; Comscantecno) was used to obtain CT images of the distal ends of femurs. The settings were as follows:
tube voltage, 70 kV; tube current, 0.1 mA; and voxel size, 12.0 µm. The 3D images were reconstructed and analyzed using TRI/3D-BON software (RATOC System Engineering). Regions of interest
were drawn 50 µm from the end of each epiphyseal growth plate to points 0.5 mm along the cortical wall. BONE MORPHOMETRIC ANALYSIS The left femurs were extracted from 9-week-old
osteoblast-specific deletion of miR-143/145 (miR-143/145Osx−/−) and floxed (miR-143/145flox/+ or miR-143/145flox/+) male mice and were performed bone morphometric analysis as described
previously49. For toluidine blue staining, femurs were excised, fixed in 100% ethanol, and embedded in glycolmethacrylate. For double staining of cortical bone surfaces, mice were injected
subcutaneously with calcein (8 mg/kg) at 4 days or 1 day before being sacrificed. PHENOTYPE OF OSTEOBLAST-SPECIFIC DELETION OF MIR-143/145 IN VITRO Primary osteoblasts from 9-week-old
miR-143/145Osx−/− and littermate floxed (miR-143/145flox/flox) male mice were analyzed. RNA extraction was performed 10 days after starting osteoblast differentiation. The expression of
miR-143-3p in primary osteoblasts cultured for 14 days was assessed. PTH ADMINISTRATION IN VIVO Intermittent PTH injections were conducted to 5-week-old female WT and miR-143/145Osx−/− mice
(PTH: human PTH (1–34) [teriparatide; Asahi Kasei Pharma Corporation]). The dose of human PTH (1–34) was 40 µg/kg body weight per day for 5 days per week, delivered via subcutaneous
injection for 4 weeks, as described previously36. Micro-CT analysis, bone morphometric analysis, and measurement of the urine C-terminal telopeptide-1 (CTX-1) level were performed after PTH
administration at 9 weeks of age (body weight 18–22 g). The right femurs were extracted for micro-CT analysis, and the left femurs were used for bone morphometric analyses with Villanueva
bone staining embedded in methylmethacrylate as described above. For measurement of CTX-1, mice were fasted for 12 h before urine sampling by bladder puncture. CTX-1 and creatinine levels in
the urine samples were measured by enzyme-linked immunosorbent assay (RatLaps TM; Immunodiagnostics Systems) and enzymatic method (Wako), respectively. The CTX-1 level was corrected for the
creatinine concentration. SOV TRANSPLANTATION ON CALVARIAL BONE DEFECTS C57BL/6 J male mice were anesthetized with isoflurane, and an incision was made on the head skin to expose the
calvaria. Artificial calvarial defects were created on both sides using surgical punches and needles. Round defects with diameters of 1.0 mm were created for comparison between the total
SOV-treated group and PBS-treated group; round defects with diameters of 1.5 mm were created for comparison of the effect of total SOVs from miR-143/145 KO mice with the effect of total SOVs
from WT mice. A gelatin hydrogel sheet (MedGel II PI9, Nitta-gelatin, Japan) was cut to the same size as the defect and impregnated with PBS or SOVs (1–5 × 10⁹). The hydrogels were
transplanted into either side of the calvaria defect. A micro-CT assessment was performed after 8 weeks (for the PBS- and total SOV-treated groups) or 2 weeks (for total SOVs from WT and
total SOVs from miR-143/145 KO mice). Defect areas were measured using ImageJ. TREATMENT OF MIR-143/145-DELETED SOVS IN VITRO Primary osteoblasts from WT and miR-143/145Osx−/− female mice
were cultured for 14 days. SOVs were collected and named WT-SOV and KO-SOV, respectively. Primary osteoblasts from WT female mice were cultured for 6 days and treated with PBS, WT-SOV or
KO-SOV. RNA extraction was performed 2 days after treatment. STATISTICS AND REPRODUCIBILITY Differences between two groups were analyzed using two-tailed paired, unpaired, or Welch’s
_t_-tests. Differences among three or more groups were analyzed by one-way analysis of variance (ANOVA) with Dunnett’s multiple comparison _post hoc_ test. Welch’s ANOVA followed by
Bonferroni’s multiple comparisons test was used when the data demonstrated unequal variance. Statistical analyses were performed using Prism ver. 6 (GraphPad Software) and JMP16. Numbers of
samples and animals are indicated in the figure legends. All data are representative of those of at least three independent experiments unless otherwise indicated. Biological replicates
comprised samples from different mice. We estimated the required sample sizes by considering variations and means, and sought to reach reliable conclusions using sample sizes that were as
small as possible. REPORTING SUMMARY Further information on research design is available in the Nature Research Reporting Summary linked to this article. DATA AVAILABILITY The RNA-seq data
of SOVs from primary mouse osteoblasts have been deposited in the NCBI Gene Expression Omnibus (GEO) database under accession number and hyperlinks: GSE144512. All other data that support
the findings of this study are available from the corresponding author upon reasonable request. Source data are provided with this paper. REFERENCES * Hattner, R., Epker, B. N. & Frost,
H. M. Suggested sequential mode of control of changes in cell behavior in adult bone remodeling. _Nature_ 206, 489–490 (1965). Article ADS CAS PubMed Google Scholar * Takahashi, H.,
Epker, B. N. & Frost, H. M. Resorption precedes formative activity. _Surg. Forum_ 15, 437–438 (1964). CAS PubMed Google Scholar * Frost, H. M. Tetracycline-based histological analysis
of bone remodeling. _Calcif. Tissue Res._ 3, 211–237 (1969). Article CAS PubMed Google Scholar * Parfitt, A. M. The coupling of bone formation to bone resorption: a critical analysis of
the concept and of its relevance to the pathogenesis of osteoporosis. _Metab. Bone Dis. Relat. Res._ 4, 1–6 (1982). Article CAS PubMed Google Scholar * Martin, T. J. & Sims, N. A.
Osteoclast-derived activity in the coupling of bone formation to resorption. _Trends Mol. Med._ 11, 76–81 (2005). Article CAS PubMed Google Scholar * Sims, N. A. & Martin, T. J.
Osteoclasts provide coupling signals to osteoblast lineage cells through multiple mechanisms. _Annu. Rev. Physiol._ 82, 507–529 (2020). Article CAS PubMed Google Scholar * Ryu, J. et al.
Sphingosine 1-phosphate as a regulator of osteoclast differentiation and osteoclast-osteoblast coupling. _EMBO J._ 25, 5840–5851 (2006). Article CAS PubMed PubMed Central Google Scholar
* Takeshita, S. et al. Osteoclast-secreted CTHRC1 in the coupling of bone resorption to formation. _J. Clin. Invest._ 123, 3914–3924 (2013). Article CAS PubMed PubMed Central Google
Scholar * Koga, T. N. et al. Suppression of bone formation by osteoclastic expression of semaphorin 4D. _Nat. Med._ 17, 1473–1480 (2011). Article Google Scholar * Zhao, C. et al.
Bidirectional ephrinB2-EphB4 signaling controls bone homeostasis. _Cell Metab._ 2, 111–121 (2006). Article Google Scholar * Ikebuchi, Y. et al. Coupling of bone resorption and formation by
RANKL reverse signaling. _Nature_ 561, 195–200 (2018). Article ADS CAS PubMed Google Scholar * Denk, W., Strickler, J. H. & Webb, W. W. Two-photon laser scanning fluorescence
microscopy. _Science_ 248, 73–76 (1990). Article ADS CAS PubMed Google Scholar * Condeelis, J. & Segall, J. E. Intravital imaging of cell movement in tumours. _Nat. Rev. Cancer_ 3,
921–930 (2003). Article CAS PubMed Google Scholar * Pitett, J. M. & Weissleder, R. Intravital imaging. _Cell_ 147, 983–991 (2011). Article Google Scholar * Ishii, M. et al.
Sphingosine-1-phosphate mobilizes osteoclast precursors and regulates bone homeostasis. _Nature_ 458, 524–528 (2009). Article ADS CAS PubMed PubMed Central Google Scholar * Ishii, M.,
Kikuta, J., Shimazu, Y., Meier-Schellerscheim, M. & Germain, R. N. Chemorepulsion by blood S1P regulates osteoclast precursor mobilization and bone remodeling in vivo. _J. Exp. Med._
207, 2793–2798 (2010). Article CAS PubMed PubMed Central Google Scholar * Kikuta, J. et al. Sphingosine-1-phosphate-mediated osteoclast precursor monocyte migration is a critical point
of control in antibone-resorptive action of active vitamin D. _Proc. Natl Acad. Sci. USA_ 110, 7009–7013 (2013). Article ADS CAS PubMed PubMed Central Google Scholar * Kikuta, J. et
al. Dynamic visualization of RANKL and Th17-mediated osteoclast function. _J. Clin. Invest._ 123, 866–873 (2013). CAS PubMed PubMed Central Google Scholar * Furuya, M. et al. Direct
cell–cell contact between mature osteoblasts and osteoclasts dynamically controls their functions in vivo. _Nat. Commun._ 9, 300 (2018). Article ADS PubMed PubMed Central Google Scholar
* Andreu, Z. & Yáñez-Mó, M. Tetraspanins in extracellular vesicle formation and function. _Front. Immunol._ 5, 442 (2014). Article PubMed PubMed Central Google Scholar * Colombo,
M., Raposo, G. & Théry, C. Biogenesis, secretion, and intercellular interactions of exosomes and other extracellular vesicles. _Annu. Rev. Cell Dev. Biol._ 30, 255–289 (2014). Article
CAS PubMed Google Scholar * Tkach, M. & Théry, C. Communication by extracellular vesicles: where we are and where we need to go. _Cell_ 164, 1226–1232 (2016). Article CAS PubMed
Google Scholar * Ducy, P., Zhang, R., Geoffroy, V., Ridall, A. L. & Karsenty, G. Osf2/Cbfa1: a transcriptional activator of osteoblast differentiation. _Cell_ 89, 747–754 (1997).
Article CAS PubMed Google Scholar * Komori, T. et al. Targeted disruption of Cbfa1 results in a complete lack of bone formation owing to maturational arrest of osteoblasts. _Cell_ 89,
755–764 (1997). Article CAS PubMed Google Scholar * Nakashima, K. et al. The novel zinc finger-containing transcription factor osterix is required for osteoblast differentiation and bone
formation. _Cell_ 108, 17–29 (2002). Article CAS PubMed Google Scholar * Théry, C. et al. Minimal information for studies of extracellular vesicles 2018 (MISEV2018): a position
statement of the International Society for Extracellular Vesicles and update of the MISEV2014 guidelines. _J. Extracell. Vesicles_ 23, 1535750 (2018). Article Google Scholar * Yasuda, H.
et al. Osteoclast differentiation factor is a ligand for osteoprotegerin/osteoclastogenesis-inhibitory factor and is identical to TRANCE/RANKL. _Proc. Natl Acad. Sci. USA_ 95, 3597–3602
(1998). Article ADS CAS PubMed PubMed Central Google Scholar * Lacey, D. L. et al. Osteoprotegerin ligand is a cytokine that regulates osteoclast differentiation and activation. _Cell_
93, 165–176 (1998). Article CAS PubMed Google Scholar * Bucay, N. et al. Osteoprotegerin-deficient mice develop early onset osteoporosis and arterial calcification. _Genes Dev._ 12,
1260–1268 (1998). Article CAS PubMed PubMed Central Google Scholar * Ogawa, E. et al. PEBP2/PEA2 represents a family of transcription factors homologous to the products of the
Drosophila runt gene and the human AML1 gene. _Proc. Natl Acad. Sci. USA_ 90, 6859–6863 (1993). Article ADS CAS PubMed PubMed Central Google Scholar * Yoshida, C. A. et al.
Core-binding factor beta interacts with Runx2 and is required for skeletal development. _Nat. Genet._ 32, 633–638 (2002). Article CAS PubMed Google Scholar * Miller, J. et al. The
core-binding factor beta subunit is required for bone formation and hematopoietic maturation. _Nat. Genet._ 32, 645–649 (2002). Article CAS PubMed Google Scholar * Lim, K. E. et al. Core
binding factor beta of osteoblasts maintains cortical bone mass via stabilization of Runx2 in mice. _J. Bone Miner. Res._ 30, 715–722 (2015). Article CAS PubMed Google Scholar * Wang,
R. et al. miR-143 promotes angiogenesis and osteoblast differentiation by targeting HDAC7. _Cell Death Dis._ 11, 179 (2020). Article CAS PubMed PubMed Central Google Scholar *
Mizoguchi, T. et al. Osterix marks distinct waves of primitive and definitive stromal progenitors during bone marrow development. _Dev. Cell_ 29, 340–349 (2014). Article CAS PubMed PubMed
Central Google Scholar * Iida-Klein, A. et al. Effects of cyclic versus daily hPTH(1-34) regimens on bone strength in association with BMD, biochemical markers, and bone structure in
mice. _J. Bone Min. Res._ 21, 274–282 (2006). Article CAS Google Scholar * Hadjidakis, D. J. & Androulakis, I. I. Bone remodeling. _Ann. N. Y. Acad. Sci._ 1092, 385–396 (2006).
Article ADS CAS PubMed Google Scholar * Karsenty, G. & Wagner, E. F. Reaching a genetic and molecular understanding of skeletal development. _Dev. Cell_ 2, 389–406 (2002). Article
CAS PubMed Google Scholar * Raggatt, L. J. & Partridge, N. C. Cellular and molecular mechanisms of bone remodeling. _J. Biol. Chem._ 285, 25103–25108 (2010). Article CAS PubMed
PubMed Central Google Scholar * Seeman, E. & Martin, T. J. Antiresorptive and anabolic agents in the prevention and reversal of bone fragility. _Nat. Rev. Rheumatol._ 15, 225–236
(2019). Article PubMed Google Scholar * Parfitt, A. M. Misconceptions (2): turnover is always higher in cancellous than in cortical bone. _Bone_ 30, 807–809 (2002). Article CAS PubMed
Google Scholar * Gao, Y. et al. Long noncoding RNA MALAT1 promotes osterix expression to regulate osteogenic differentiation by targeting miRNA-143 in human bone marrow-derived mesenchymal
stem cells. _J. Cell Biochem._ 119, 6986–6996 (2018). Article CAS PubMed Google Scholar * Li, E. et al. MiR-143 suppresses osteogenic differentiation by targeting Osterix. _Mol. Cell
Biochem._ 390, 69–74 (2014). Article CAS PubMed Google Scholar * Mori, K. et al. Modulation of mouse RANKL gene expression by Runx2 and PKA pathway. _J. Cell Biochem._ 98, 1629–1644
(2006). Article CAS PubMed Google Scholar * Boettger, T. et al. Acquisition of the contractile phenotype by murine arterial smooth muscle cells depends on the _Mir 143/145_ gene cluster.
_J. Clin. Invest._ 119, 2634–2647 (2009). Article CAS PubMed PubMed Central Google Scholar * Hayashi, M. et al. Osteoprotection by semaphorin 3A. _Nature_ 485, 69–74 (2012). Article
ADS CAS PubMed Google Scholar * Crescitelli, R. et al. Distinct RNA profiles in subpopulations of extracellular vesicles: apoptotic bodies, microvesicles and exosomes. _J. Extracell.
Vesicles_ 2, 20677 (2013). Article Google Scholar * Takahashi, N. et al. Osteoclast-like cell formation and its regulation by osteotropic hormones in mouse bone marrow cultures.
_Endocrinology_ 122, 1373–1382 (1988). Article CAS PubMed Google Scholar * Nishikawa, K. et al. DNA methyltransferase 3a regulates osteoclast differentiation by coupling to an
S-adenosylmethionine-producing metabolic pathway. _Nat. Med._ 21, 281–287 (2015). Article CAS PubMed Google Scholar Download references ACKNOWLEDGEMENTS We thank Y. Kawahara (Department
of RNA Biology and Neuroscience, Graduate School of Medicine, Osaka University) for intellectual discussions; E. Oiki and T. Mizuno (Center for Medical Research and Education, Osaka
University) for assistance with transmission electron microscopy; and R. Takao-Kawabata and A. Takakura for assistance with bone morphometric analysis. This work was supported by CREST
(JPMJCR15G1 to M.I.) and PRESTO (JPMJPR18HA to H.M.) from Japan Science and Technology (JST) Agency; Grant-in-Aid for Scientific Research (19H05657 to M.I. and 21H02716 to J.K.) from the
Japan Society for the Promotion of Science (JSPS); Innovative Drug Discovery and Development Project (JP21am0401009 to M.I. and J.K.) and PRIME (JP21gm6210005 to J.K.) from Japan Agency for
Medical Research and Development; grants from the Uehara Memorial Foundation (to M.I.), the Kanae Foundation for the Promotion of Medical Sciences (to M.I.), the Mochida Memorial Foundation
(to M.I.), and the Takeda Science Foundation (to M.I. and J.K.). AUTHOR INFORMATION Author notes * These authors contributed equally: Maki Uenaka, Erika Yamashita. AUTHORS AND AFFILIATIONS *
Department of Immunology and Cell Biology, Graduate School of Medicine and Frontier Biosciences, Osaka University, Suita, Osaka, Japan Maki Uenaka, Erika Yamashita, Junichi Kikuta, Akito
Morimoto, Tomoka Ao, Hiroki Mizuno, Masayuki Furuya, Tetsuo Hasegawa, Hiroyuki Tsukazaki, Takao Sudo, Keizo Nishikawa & Masaru Ishii * WPI-Immunology Frontier Research Center, Osaka
University, Suita, Osaka, Japan Junichi Kikuta, Hiroki Mizuno, Takao Sudo, Keizo Nishikawa & Masaru Ishii * Laboratory of Bioimaging and Drug Discovery, National Institutes of Biomedical
Innovation, Health and Nutrition, Ibaraki, Osaka, Japan Junichi Kikuta, Tomoka Ao & Masaru Ishii * Genome Information Research Center, Research Institute for Microbial Diseases, Osaka
University, Suita, Osaka, Japan Daisuke Okuzaki & Daisuke Motooka * Division of Molecular and Cellular Medicine, Tokyo Medical University, Shinjuku, Tokyo, Japan Nobuyoshi Kosaka &
Takahiro Ochiya * Core Instrumentation Facility, Immunology Frontier Research Center and Research Institute for Microbial Diseases, Osaka University, Suita, Osaka, Japan Fuminori Sugihara *
Max-Plank-Institute for Heart and Lung Research, Bad Nauheim, Germany Thomas Boettger & Thomas Braun Authors * Maki Uenaka View author publications You can also search for this author
inPubMed Google Scholar * Erika Yamashita View author publications You can also search for this author inPubMed Google Scholar * Junichi Kikuta View author publications You can also search
for this author inPubMed Google Scholar * Akito Morimoto View author publications You can also search for this author inPubMed Google Scholar * Tomoka Ao View author publications You can
also search for this author inPubMed Google Scholar * Hiroki Mizuno View author publications You can also search for this author inPubMed Google Scholar * Masayuki Furuya View author
publications You can also search for this author inPubMed Google Scholar * Tetsuo Hasegawa View author publications You can also search for this author inPubMed Google Scholar * Hiroyuki
Tsukazaki View author publications You can also search for this author inPubMed Google Scholar * Takao Sudo View author publications You can also search for this author inPubMed Google
Scholar * Keizo Nishikawa View author publications You can also search for this author inPubMed Google Scholar * Daisuke Okuzaki View author publications You can also search for this author
inPubMed Google Scholar * Daisuke Motooka View author publications You can also search for this author inPubMed Google Scholar * Nobuyoshi Kosaka View author publications You can also search
for this author inPubMed Google Scholar * Fuminori Sugihara View author publications You can also search for this author inPubMed Google Scholar * Thomas Boettger View author publications
You can also search for this author inPubMed Google Scholar * Thomas Braun View author publications You can also search for this author inPubMed Google Scholar * Takahiro Ochiya View author
publications You can also search for this author inPubMed Google Scholar * Masaru Ishii View author publications You can also search for this author inPubMed Google Scholar CONTRIBUTIONS
M.U., J.K., and M.I. conceived the study. M.U. and A.M. performed the in vivo imaging experiments; M.U. and E.Y. performed the in vitro and in vivo experiments with the assistance of J.K.,
A.M., T.A., H.M., M.F., T.H., H.T., T.S., K.N., and F.S. Furthermore, D.O. and D.M. performed the RNA-seq analysis. N.K. and T.O. provided the CD63-GFP vector and discussed the results. T.
Boettger and T. Braun provided the miR-143/145 fl/fl mouse line and miR-143/145 KO line. M.U., D.O., and T. Boettger wrote the initial draft. J.K. and M.I. revised the final draft.
CORRESPONDING AUTHORS Correspondence to Junichi Kikuta or Masaru Ishii. ETHICS DECLARATIONS COMPETING INTERESTS The authors declare no competing interests. PEER REVIEW PEER REVIEW
INFORMATION _Nature Communications_ thanks Lavinia Raimondi and the other, anonymous, reviewer(s) for their contribution to the peer review of this work. ADDITIONAL INFORMATION PUBLISHER’S
NOTE Springer Nature remains neutral with regard to jurisdictional claims in published maps and institutional affiliations. SUPPLEMENTARY INFORMATION SUPPLEMENTARY INFORMATION REPORTING
SUMMARY DESCRIPTION OF ADDITIONAL SUPPLEMENTARY FILES SUPPLEMENTARY VIDEO 1 SUPPLEMENTARY VIDEO 2 SUPPLEMENTARY VIDEO 3 SUPPLEMENTARY VIDEO 4 SUPPLEMENTARY VIDEO 5 SOURCE DATA SOURCE DATA
RIGHTS AND PERMISSIONS OPEN ACCESS This article is licensed under a Creative Commons Attribution 4.0 International License, which permits use, sharing, adaptation, distribution and
reproduction in any medium or format, as long as you give appropriate credit to the original author(s) and the source, provide a link to the Creative Commons license, and indicate if changes
were made. The images or other third party material in this article are included in the article’s Creative Commons license, unless indicated otherwise in a credit line to the material. If
material is not included in the article’s Creative Commons license and your intended use is not permitted by statutory regulation or exceeds the permitted use, you will need to obtain
permission directly from the copyright holder. To view a copy of this license, visit http://creativecommons.org/licenses/by/4.0/. Reprints and permissions ABOUT THIS ARTICLE CITE THIS
ARTICLE Uenaka, M., Yamashita, E., Kikuta, J. _et al._ Osteoblast-derived vesicles induce a switch from bone-formation to bone-resorption in vivo. _Nat Commun_ 13, 1066 (2022).
https://doi.org/10.1038/s41467-022-28673-2 Download citation * Received: 12 February 2021 * Accepted: 07 February 2022 * Published: 24 February 2022 * DOI:
https://doi.org/10.1038/s41467-022-28673-2 SHARE THIS ARTICLE Anyone you share the following link with will be able to read this content: Get shareable link Sorry, a shareable link is not
currently available for this article. Copy to clipboard Provided by the Springer Nature SharedIt content-sharing initiative