- Select a language for the TTS:
- UK English Female
- UK English Male
- US English Female
- US English Male
- Australian Female
- Australian Male
- Language selected: (auto detect) - EN
Play all audios:
ABSTRACT The characteristics of COVID-19 patients with persistent SARS-CoV-2 infection are not yet well described. Here, we compare the clinical and molecular features of patients with long
duration of viral shedding (LDs) with those from patients with short duration patients (SDs), and healthy donors (HDs). We find that several cytokines and chemokines, such as interleukin
(IL)-2, tumor necrosis factor (TNF) and lymphotoxin α (LT-α) are present at lower levels in LDs than SDs. Single-cell RNA sequencing shows that natural killer (NK) cells and CD14+ monocytes
are reduced, while regulatory T cells are increased in LDs; moreover, T and NK cells in LDs are less activated than in SDs. Importantly, most cells in LDs show reduced expression of
ribosomal protein (RP) genes and related pathways, with this inversed correlation between RP levels and infection duration further validated in 103 independent patients. Our results thus
indicate that immunosuppression and low RP expression may be related to the persistence of the viral infection in COVID-19 patients. SIMILAR CONTENT BEING VIEWED BY OTHERS UNTIMELY TGFΒ
RESPONSES IN COVID-19 LIMIT ANTIVIRAL FUNCTIONS OF NK CELLS Article 25 October 2021 ADAPTIVE IMMUNE RESPONSES TO SARS-COV-2 INFECTION IN SEVERE VERSUS MILD INDIVIDUALS Article Open access 14
August 2020 SINGLE-CELL LANDSCAPE OF IMMUNOLOGICAL RESPONSES IN PATIENTS WITH COVID-19 Article 12 August 2020 INTRODUCTION Currently, the world is witnessing a major devastating pandemic of
coronavirus disease 2019 (COVID-19) caused by severe acute respiratory syndrome coronavirus-2 (SARS-CoV-2)1. On March 11th 2020, the World Health Organization has declared it a pandemic,
which has had a profound impact on the global culture and economy2. Disease manifestation is highly heterogeneous, ranging from asymptomatic infection through mild to severe disease leading
to death3. Moreover, the duration of viral shedding has been reported to vary dramatically, ranging from 6 to 105 days, with a median duration of 20 days from disease onset4,5,6,7. We
previously reported that even in the 5th week after symptoms onset, the viral PCR positive rate of the tested samples remained around 20%8. More importantly, Victoria A et al.7 reported that
even 70 days after diagnosis, virus particles were observed in SARS-CoV-2 cultured in nasopharyngeal swabs though scanning and transmission electron microscopy, supporting persistent
SARS-CoV-2 infection with shedding of infectious virus. Therefore, persistent infection potentially increases the risk of spread, resulting in the consumption of additional hospital
resources and greater economic costs. Accordingly, in addition to focus on the severity of the COVID-19 disease, it is also important to explore the clinical, molecular characteristics and
mechanism of long duration of viral infection. However, up to now, we have a limited understanding of the clinical and molecular characteristics of COVID-19 with long-term SARS-CoV-2
shedding. The key point in SARS-CoV-2 persistent infection could be the depletion of antiviral defenses related to immune response9. The innate immune system is the first line of defense
against infection from viruses10. While cytokines, such as interferon (IFN)-α/β/γ, TNF, and LT-α, have the potential to trigger the activation of intracellular antiviral pathways, other
cytokines, such as interleukin (IL)-1α/β, IL-2, IL-6, and IL-12, are believed to indirectly promote antiviral responses by regulating various aspects of the immune response, including the
autocrine or paracrine upregulation of IFN-α/β/γ and TNF11. On the contrary, accumulating evidences suggest that the overproduction of inflammatory cytokines response to SARS-CoV-2,
so-called “cytokine storm”, can cause organ damage, increase the mortality rate12. Furthermore, host adaptive immune responses are ultimately responsible for clearing respiratory viral
infections. CD4+ and CD8+ T cells can perform various functions including: lysis of virally infected cells, production of cytokines to orchestrate the immune response, and initiation of a B
cell response capable of producing antigen-specific IgG and IgA antibodies13. In contrast, regulatory T cells (Treg) inhibit the activation of both innate and adaptive immune cells via
inhibitory surface molecules (like cytotoxic T-lymphocyte antigen-4 (CTLA-4) and lymphocyte-activation gene-3) and secretion of immunosuppressive cytokines (IL-10, transforming growth
factor-β, and IL-35)14. Exploring the status and changes of adaptive immunity in long duration of viral shedding patients will give us a deeper understanding of the interaction of immune
response and SARS-CoV-2. In all biological cells, the task of synthesizing proteins is performed by complex molecular machines known as ribosomes. Ribosomes interact with messenger RNAs
(mRNAs), which serve as blueprints for protein synthesis, and translate the nucleotide sequence of each mRNA into the amino-acid sequence of the corresponding protein15. Moreover, the
production of ribosome is dysregulated by virus infection16. Decreased ribosome biogenesis may contribute to a poor immune response, including reduced IFN and antibodies production.
Recently, several studies reported that nonstructural protein 1 (Nsp1) from SARS-CoV-2 efficiently interferes with 40S ribosome subunit, inhibits all cellular antiviral defense mechanisms,
and then facilitates efficient viral replication and immune evasion17,18. However, whether ribosome biogenesis will impact the intrinsic immune responses of COVID-19 patients with persistent
SARS-CoV-2 infection remains to be explored. Herein, we examine the 48 serum cytokine/chemokine levels in 38 SDs, 12 LDs, and 22 HDs. Furthermore, fresh PBMCs from 3 HDs, 9 SDs and 5 LDs
are collected and 10× Genomics single-cell RNA sequencing (scRNA-seq) is performed to dissect and compare the potential changes associated with persistent virus infection. We find that
several cytokines/chemokines (IL-2, TNF and LT-α) are present at lower levels in LDs than SDs. Single-cell RNA sequencing indicates immunosuppression status and low RP genes expression in
LDs. Further, we provide a resource to reveal the clinical and molecular features of COVID-19 patients with persistent SARS-CoV-2 infection, which may have important implications for
understanding and controlling COVID-19. RESULTS DEMOGRAPHIC CHARACTERISTICS The duration of virus shedding was defined as the interval from illness onset until successive negative detection
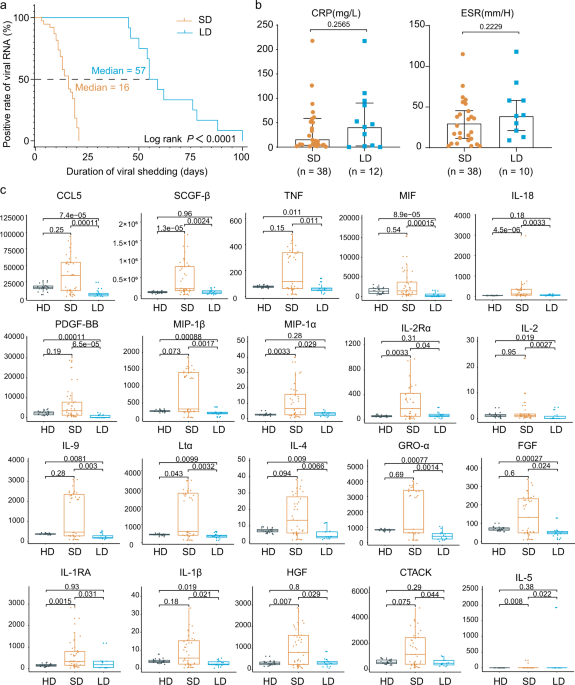
of SARS-CoV-2 RNA, consistent with other studies of COVID-1919,20. As of April 30, 2020, a total of 12 non-critical COVID-19 in-patients exhibited long duration of viral shedding (>45
days). Given that the median SARS-CoV-2 viral shedding duration is ~3 weeks21, we also collected 38 age- and gender-matched non-critical COVID-19 in-patients whose viral shedding durations
were <21 days for comparison (Supplementary Table 1). All the patients were identified as laboratory-confirmed SARS-CoV-2 infected patients at Tongji Hospital, Wuhan, China. The median
viral shedding duration was 57 days (range: 45–100 days) and 16 days (range: 3–21 days) in LDs and SDs, respectively (log-rank _p_ < 0.0001) (Supplementary Table 1). The basic demographic
information and clinical parameters comparison of these patients are detailed in Supplementary Table 1. Notably, there were no significant differences between LDs and SDs in comorbidities,
complete blood counts (white blood counts, lymphocyte counts, neutrophil counts, platelet counts, and hemoglobin), blood biochemistry (alanine/aspartate aminotransferase and lactate
dehydrogenase), and coagulation function (prothrombin, activated partial thromboplastin time, and D-dimer). Moreover, inflammatory markers, such as procalcitonin, erythrocyte sedimentation
rate (ESR), and c-reactive protein (CRP), which have been well reported as high-risk factors of the development of severe COVID-1922,23,24, were also comparable in LDs and SDs. Therefore,
further investigation is urgently needed to identify new indicators for viral shedding duration and the underlying mechanism of persistent viral shedding. CYTOKINES IN SDS, LDS, AND HDS
Cytokines are central to the pathophysiology of COVID-19 and a “cytokine storm” has been described as a feature of COVID-19 severity, which is associated with adverse outcomes25,26. To
further elucidate the immune response associated with the viral shedding duration, we examined the serum cytokine/chemokine levels in 38 SDs, 12 LDs, and 22 HDs. Intriguingly, among the 48
cytokines/chemokines detected, 21 inflammatory cytokines/chemokines had the lowest levels in LDs when compared to SDs or HDs (Fig. 1c). Of these, platelet-derived growth factor (PDGF-BB)
(_p_ = 0.000065), C-C motif ligand 5 (CCL5) (_p_ = 0.00011), and macrophage migration inhibitory factor (MIF) (_p_ = 0.00015) showed the most significant changes (Fig. 1c and Supplementary
Fig. 1). In addition, IL-1β, IL-2, IL-2R, IL-9, IL-18, TNF, and LT-α, the upregulation of which contributed to lung injury, multiorgan failure, and ultimately death27,28,29, were present at
lower levels in LDs (Fig. 1c). Collectively, persistent viral shedding is associated with a weaker inflammatory response characterized by low circulating concentrations of cytokines and
chemokines. CELL COMPOSITIONS DIFFERENCES OF PBMCS IN SDS, LDS, AND HDS To characterize the immunological features of LDs and SDs compared to HDs, we performed 10× Genomics scRNA-seq to
study the transcriptomic profiles of PBMCs from 3 HDs, 9 SDs and 5 LDs (Supplementary Table 2). The demographics, clinical features, and laboratory findings of these patients are listed in
Supplementary Table 2. After the unified single-cell analysis pipeline (see Methods), a total of 167,946 cells from all subjects (an average of 9879 cells per sample) were integrated into an
unbatched and comparable dataset (Supplementary Table 2). In accordance with previous reports30, we did not detect SARS-CoV-2 RNA expression in the PBMCs of these patients (Supplementary
Fig. 2). Using unsupervised clustering of uniform manifold approximation and projection (UMAP), we identified 20 cell populations based on the expression of canonical cell-type gene markers
(Fig. 2a-b, Supplementary Fig. 3). To reveal the differences in cell composition across LDs and SDs and to compare them with that of HDs, we investigated the relative proportions of immune
cells among the three groups (Fig. 2c-d). The proportion of NK cells in LDs was significantly reduced (Fig. 2d). CD14+ monocytes were lowest in LDs and exhibited a marginally significant
decreasing trend in LDs when compared to SDs (_p_ = 0.06). Notably, inflammatory monocytes, induced by T cells, have been reported to incite the cytokine storm in COVID-1931. The massive
decreases in NK cells and CD14+ monocytes in LDs were in accordance with the observed decrease in inflammatory cytokines in LDs32. Moreover, the proportion of Treg was significantly highest
in the LDs among three groups (Fig. 2d). Given the importance of Treg in secreting immunosuppressive cytokines and inhibiting the activation of both innate and adaptive immune cells33,34,
the statistically significant elevated levels of Treg may contribute to the suppression immune response observed in LDs. Taken together, the decreasing trend of NK cells and CD14+ monocytes,
and the increased Treg may be associated with the immunosuppression status and the persistence of the virus in LDs. TRANSCRIPTIONAL SIGNATURES ASSOCIATED WITH LDS Next, we performed
hierarchical clustering based on relative gene expression changes with respect to the HDs to evaluate the molecular difference of each cell type in LDs and SDs. Unexpectedly, all cell types
among the PBMCs clustered together according to the disease groups rather than by cell-types, with the exception of plasma B cells and megakaryocytes (Supplementary Fig. 4). This indicates
that the molecular features of PBMCs in LDs and SDs are markedly different, regardless of the cell type. Therefore, we sought to identify variations in the relevant biological functions in
individual cell types through differentially expressed genes (DEGs) and Gene Oncology (GO) analysis. Most importantly, we found that protein targeting to the membrane, endoplasmic reticulum
(ER) related pathways, and translation related pathways were consistently downregulated in all cell types in LDs, with the exception of gamma delta (γδ) T cells, mucosal associated invariant
T cells (MAIT), and megakaryocytes (Fig. 3a). In agreement with the GO analysis results, many genes encoding RP and immune related genes were specifically downregulated in LDs (Fig. 3b-c).
Particularly, RPL41, RPS29, RPL36A, RPS27, RPS21, RPS10, RPL38, RPL39, and RPS28 localize to the ER and participate in protein synthesis, folding, and assembly, as detailed in the
information provided on https://www.proteinatlas.org. TMA735, TAF1036, and PTOV137 were also specifically downregulated in LDs. These genes have previously been reported to be associated
with ribosomes, and their overexpression promotes global protein synthesis. Given that antibodies38 and cytokines39 are synthesized, folded, modified, and assembled by the rough ER and
attached ribosomes, these findings suggest that immune cells of LDs tend to have reduced cytokine synthesis, folding, and assembly functions, which is consistent with the lower levels of
inflammatory cytokines observed in LDs (Fig. 1c). CEBPD and MAP2K2, which are involved in the production of proinflammatory cytokines, and RAC140, which is involved in IL-2 production, were
selectively reduced in LDs (Fig. 3b-c). In addition, genes involved in T-cell activation (PCBP1, ARPC2), migration (FMNL1), cytotoxic function (GNLY, SRM), transcription factors (LYN), and
downstream signal transduction (COTL1) were all reduced in LDs (Fig. 3b-c). Given that cytokines are produced by several immune cells, including adaptive T cells41, the reduced cytokine
levels in LDs are at least partially explained by these findings. In addition, to better support the generalizability of the observations, we further reclassified, filtered published
scRNA-seq data from a recent study42. Patients with fresh PBMC were included in the analysis if they met the following criteria: (1) HDs: Control group; (2) SDs: Days after symptom onset
within 21 and is already during convalescence; (3) LDs: Symptoms are still developing more than 45 days after onset. Finally, the data of 38 COVID-19 patients (20 HDs, 16 SDs, and 2 LDs)
were selected for analysis. Since the samples in LDs only have T-cell data (sorted by flow cytometry (CD3+)), we compared and analyzed T cells in this part of the data analysis. Using
unsupervised clustering of UMAP, 9 cell populations based on the expression of canonical cell-type gene markers were identified (Supplementary Fig. 5a-c). In line with our results, GO
analysis showed that in almost all T-cell subtypes in LDs, protein targeting to the membrane, ER related pathways, translation related pathways and immune response pathways were consistently
downregulated (Supplementary Fig. 5d). These results collectively supported that cytokine synthesis, folding, and assembly functions in LDs may be reduced. To further assess the association
between ribosome proteins (RP) levels and the duration of virus shedding, we integrated bulk RNA-seq data from 103 independent COVID-19 patients. Remarkably, we found that lower expression
of RPs was associated with longer viral shedding durations, including the following RPs identified in scRNA-seq data: RPL38, RPL41, and RPS10 (Fig. 3d-e). In summary, there is a negative
correlation between RP levels and the duration of virus shedding. It is worthwhile to further explore whether specific RPs can be applied as indicators of persistent virus infection.
MOLECULAR FEATURES OF T AND NK CELLS IN LDS AND SDS We next performed sub-clustering analysis on T and NK cells considering their crucial antiviral effects43,44. UMAP embedding of T and NK
cells from all the samples identified substantial differences in the cellular phenotypes of CD4+ T, CD8+ T, NKT, and NK cells (Fig. 4a-b). Also, the correlation matrix revealed that the
molecular features differed between the two groups (Fig. 4c), such as memory CD8+ T cells and NK cells. For example, in memory CD8+ T cells, DEGs involved in T-cell activation (SELENOK, FYN,
CCL5, and RNF125), positive regulation of cytokine production (IRF1, SELENTOK, and HMGB2), proinflammatory mediators of secretion, and IFN-γ pathways (IRF1, HLA-DRB1, CCL5, and CCL4) were
specifically downregulated in LDs, while they were upregulated in SDs compared to HDs (Fig. 5a-b). Given the importance of Treg in inhibiting the activation of both innate and adaptive
immune cells32,45. Besides comparing the number of Treg (Fig. 2d), we further calculated their regulation score (see Methods) and the function score of Treg were unchanged between the three
groups (Supplementary Fig. 6a). Conversely, CD8+ cytotoxic T lymphocytes play a key role in cell-mediated cytotoxicity against virus-infected target cells46. Another possibility was raised
that immunosuppression LDs may have more exhausted cells. Therefore, we have developed exhaustion score to evaluate the exhaustion of cytotoxic T cell in three groups (see Methods). Notably,
cytotoxic T cells in LDs showed significantly highest exhausted scores (Supplementary Fig. 6b). Once again, elevated counts of Treg and exhausted cytotoxic T cells may associate with
immunosuppression status and persistence of viral shedding in LDs. Next, we reconstructed T cell antigen receptor (TCR) sequences from the TCR sequencing data. Briefly, more than 70% of the
cells in all the subsets had matched TCR information, with the exception of the γδT, NK and NKT subsets (Fig. 5c). Compared to HDs, clonal expansion was obvious in patients with COVID-19,
especially in those with SDs of viral shedding (Fig. 5d). Consistent with reduced T cell and NK cell immune activation shown above, the proportion of large clonal expansions (clonal size
>30), primarily in cytotoxic cells in LDs was low (Fig. 5d). To explore the preferential V and J combinations in SDs and LDs, we first analyzed and listed the V and J combinations most
frequently observed in the TCRs in all samples (Fig. 5e). Among these combinations, relatively frequent pairings of the TCR in HDs were TRBV28::TRVJ2-7 and TRAV29/DV5::TRAJ20, while
TRAV29/DV5::TRAJ49 and TRBV9::TRBJ1-3 were frequent in LDs, and TRAV17::TRAJ48 and TRBV15::TRBJ2-5 were frequent in SDs (Fig. 5e). The selective usage of V(D)J genes suggests that different
immunodominant epitopes may drive the molecular composition of T-cell responses and may be associated with long- or short- term virus infection. In addition, in NK cells, DEGs associated
with the positive regulation of T-cell activation pathways (ZFP36L2, KLF2, IRF1, LYN, RAC1, JUNB and CXCR4) were also profoundly reduction in LDs compared with SDs (Fig. 6a-b). Altogether,
these results implied reduced T cell and NK cell immune activation, supporting the immunosuppressive status in LDs. FEATURES OF B CELL SUBSETS IN LDS Some T cells and cytokines prime B cells
for maturation, which go on to become plasma cells and produce pathogen neutralizing antibodies47. We subclustered B cells into three subsets according to the expression and distribution of
canonical B-cell markers (Supplementary Fig. 7a-b). Compared with HDs, plasma B cells were not significantly increased in SDs, which may be due to sampling during the convalescent period48
(Supplementary Fig. 7a, Fig. 2d). In LDs, despite viral persistence, the proportion of plasma cells was also extremely low, which may indicate that LDs fail to produce sufficient
neutralizing antibodies (Supplementary Fig. 7a, Fig. 2d). Previous studies6,49 have suggested that antibodies produced by plasma cells in response to SARS-CoV-2 during initial exposure
disappeared within a few weeks, but memory B cells persisted for much longer. Therefore, we compared the expression profiles of memory B cells in the three groups. Interestingly, the
pathways involved in T-cell differentiation (CD83, ZFP36L2, and GPR183) and cell growth and activation (CD83, ZFP36L2, GPR183, and PELI1) were selectively enriched in SDs but not LDs,
indicating that B and T cells in LDs might fail to synergize to clear the virus (Supplementary Fig. 7c-d). Moreover, RAC1 and PDE4B, which positively regulate the production of cytokines
such as IL-2, and the pathways involved in leukocyte chemotaxis (LYN, DUSP1, and RAC1) were exclusively enriched in SDs (Supplementary Fig. 7c-d). DISCUSSION The duration of viral shedding
has been reported to vary dramatically and the longest period of viral PCR positive lasts more than 100 days7. Our previous study8 showed that even in the 5th week after the onset of
symptoms, the positive rate of viral PCR in the tested samples remained around 20%. More alarmingly, recent study7 reported that virus particles were still observed in SARS-CoV-2 cultured in
nasopharyngeal swabs though transmission electron microscopy even 70 days after diagnosis, supporting that SARS-CoV-2 has the ability to alive for a long time and persistently contagious.
Therefore, persistent infection potentially increases the risk of transmission, leading to the consumption of additional hospital resources and greater economic costs. Accordingly, in
addition to paying attention to the severity of the COVID-19 disease, it is also important to explore the clinical, molecular characteristics and mechanisms of long-term of viral infections.
In this report, we found that clinical indexes, including contemporaneous CRP, D-dimers, IL-6, IL-8, and ESR (Fig. 1b, Supplementary Fig. 1) failed to distinguish the patients with
persistent viral shedding. Interestingly, Treg were particularly elevated in LDs (Fig. 2d), though function score were comparable between three groups. We also observed decreases in NK cells
and CD14+ monocytes in LDs, which were in accordance with the observed decrease in inflammatory cytokines in LDs. Notably, cytotoxic T cells in LDs showed significantly highest exhausted
scores. Meanwhile, GO analysis and DEGs implied reduced T cell and NK cell immune activation, leading to lower proportion of large clonal expansions, primarily in cytotoxic cells in LDs.
These results collectively reveal the immunosuppression status of LDs. The immunological mechanisms for control of SARS-CoV-2 infection have not yet been clearly elucidated. There is no
doubt that insufficient activation of type I and type III IFNs is a key contributor to innate immune failure to control viral persistence. Moreover, decades of immunological mechanistic
research have showed that an intact T cell-mediated adaptive immune response is essential for clearing and maintaining long-term suppression of viral infections. This is supported by a
significantly increased risk of viral reactivation in patients whose adaptive immune system is suppressed50,51. In addition, Marie Helleberg et al.52 reported that in a severe COVID-19
patient with T- and B-cells impairment, after discontinuation of antiviral drug (remdesivir), the fever recurred and abnormalities of blood tests worsened, which indicated that remdesivir
suppressed viral replication but was unable to eradicate the infection in immunocompromised individuals. Coincidentally, our previous study8 found a poor immune response in persistent viral
infectious patients. Similarly, Victoria A et al.7 also reported that immunocompromised individuals may shed infectious virus longer than previously recognized. All these results unanimously
support our findings: immunosuppression may be related to the persistent viral infection. In this study, the unique immunosuppression mediated by elevated Treg and exhausted cytotoxic T
cells may responsible for limiting excessive inflammation and play a vital role in preventing host tissues damage53. However, impaired viral clearance due to immunosuppression also cause
prolonged contagious period after viral infection in LDs, increased risk of spread, consumption of additional hospital resources, and greater economic costs. Accordingly, we need to develop
different treatment strategies for persistent viral infections but uncritically ill patients. For these patients, it would be worth to further explore a combination of antiviral therapy (for
example, remdesivir54 or convalescent plasma7) and immune activation therapy (anti-PD-L1 or CTLA-4 antibody55). Recently, several studies reported that Nsp1 from SARS-CoV-2 efficiently
interferes with the cellular translation machinery (40S ribosome subunit), inhibits all cellular antiviral defense mechanisms, including the IFN response and other proinflammatory cytokines,
and then facilitates efficient viral replication and immune evasion17,18,56. Indeed, we observed massively decreased RP expression in LDs in our study. However, whether the reduced levels
of RPs in LDs are the cause or the consequence of viral persistence requires further investigation. We used single-cell transcriptomics to characterize and visualize the peripheral immune
responses in LDs compared to the responses in SDs and in HDs. We observed marked changes in the immune cell composition, molecular characteristic, and immunological features in LDs. Thus,
this work provides new insights into the pathophysiology of COVID-19 and a resource for understanding peripheral immune heterogeneity in patients with long duration of viral shedding.
Lastly, there are a few limitations of our study. For example, our sample size is small, and the timing of the clinical presentation of the patients varied, which may influence their
transcriptional landscapes. In addition, only peripheral blood was evaluated as it was challenging to obtain immune cells from the bronchoalveolar lavage fluid owing to biosafety concerns
during the COVID-19 outbreak when this study was performed. Therefore, future studies with longitudinal samples from lesion sites, such as the lung, and with more patients can provide a more
systematic overview and more comprehensive conclusions. METHODS PATIENT INFORMATION AND DATA SOURCE This study was reviewed and approved by the Institutional Review Board of Tongji
Hospital, Tongji Medical College, Huazhong University of Science and Technology (TJ-IRB20200405). All the enrolled patients signed an informed consent form, and all the blood samples were
collected using the rest of the standard diagnostic tests, with no burden to the patients. A waiver of informed consent was obtained to query the patient electronic health records. As April
30, 2020, serum from 50 patients and 22 healthy donors as controls were for the multiplex cytokine panel measurements. And PBMCs isolated from 14 patients and 3 healthy donors as controls
were performed 10× scRNA-seq. Routine laboratory measurements and blood counts were obtained as part of standard medical care. CYTOKINE MEASUREMENTS The levels of serum cytokines were
determined by Bio-Plex Pro Human Cytokines 48-Plex Screening assay (Bio-Rad Life Sciences, Hercules, CA, USA) using a Luminex FlEXMAP 3D system (Luminex, Austin, TX, USA) according to the
manufacturer’s protocols. The 48-Plex Screening panel: Basic FGF, CTACK, eotaxin, G-CSF, GM-CSF, GRO-α, HGF, ICAM-1, IFN-α2, IFN-γ, IL-1α, IL-1ra, IL-2, IL-2Rα, IL-3, IL-4, IL-5, IL-6, IL-7,
IL-8, IL-9, IL-10, IL-12, IL-13, IL-15, IL-16, IL-17A, IL-18, IP-10, LIF, MCP-1, MCP-3, M-CSF, MIF, MIG, MIP-1α, MIP-1β, β-NGF, PDGF-BB, RANTES, SCF, SCGF-β, SDF-1α, TNF, LT-α, TRAIL,
VCAM-1, VEGF-A. Data were analyzed using Bio-Plex Manager 6.2 software (Bio-Rad Life Sciences, Hercules, CA, USA). Undetected values were inputted with a random value between 0 and the limit
of detection 1 to avoid an artificial reduction in the standard deviation. SCRNA LIBRARY CONSTRUCTION SEQUENCING BY 10× GENOMICS For both patients with COVID-19 and healthy controls, blood
was collected into heparin tubes (Becton, Dickinson and Co.) and PBMCs were isolated by density gradient centrifugation using Ficoll-Paque Plus medium (GE Healthcare) and washed with
Ca/Mg-free PBS. Blood was processed within 4 h of collection for all samples, and within 1 h for most. PBMC cells were examined by microscope after 0.4% Trypan blue coloring. When the
viability of cells was higher than 80%, the experiment of library construction was performed using the ChromiumTM Controller and ChromiumTM Single Cell 5′ Reagent Version 2 Kit (10×
Genomics, Pleasanton, CA). Briefly, single cells, reagents and Gel Beads containing barcoded oligonucleotides were encapsulated into nanoliter-sized GEMs (Gel Bead in emulsion) using the
GemCode Technology. Lysis and barcoded reverse transcription of polyadenylated mRNA from single cells were performed inside each GEM. Post RT-GEMs were cleaned up and cDNA were amplified.
cDNA was fragmented and fragments end were repaired, as well A-tailing was added to the 5′ end. The adaptors were ligated to fragments which were double sided SPRI selected. Another double
sided SPRI selecting was carried out after sample index PCR. The final library was quality and quantitated in two methods: check the distribution of the fragments size using the Agilent 2100
bioanalyzer, and quantify the library using real-time quantitative PCR (TaqMan Probe). The final products were sequenced using the MGISEQ-2000RS platform (BGIShenzhen, China). TCR V(D)J
SEQUENCING Full-length TCR V(D)J segments were enriched from amplified cDNA from 5′ libraries via PCR amplification using a Chromium Single-Cell V(D)J Enrichment kit according to the
manufacturer’s protocol (10× Genomics). DETECTION OF SARS-COV-2 TRANSCRIPTS Mock sample with SARS-CoV-2 transcripts was generated by add 200 SARS-CoV-2 paired reads to the health control.
SARS-CoV-2 transcripts were identified from sequencing data using Viral-Track57 and Cell Ranger (version 3.0.1, 10× Genomics) with a modified reference contain SARS-CoV-2 genome
(NC_045512.2). SINGLE CELL RNA-SEQ DATA PROCESSING The sequencing data of patients were processed using Cell Ranger against the GRCh38 human reference genome. Quality of cells were then
assessed based on the UMI counts per cell, genes expressed per cell and the proportion of mitochondrial gene counts using Seurat (version 4.0.0). Cells that had UMIs between 500 and 30,000,
more than 200 genes expressed and fewer than 15% of UMIs from mitochondrial genes were considered high quality and retained for further analysis. We next identified and removed the doublets
following previous described method58. After removing the doublets, a total of 167,946 cells were retained for downstream analysis. To remove batch effect, the function “NormalizeData” and
“FindVariableFeatures” in Seurat was performed respectively for each sample. After that, the dataset was scaled and PCA conducted with features exclude ribosomal protein and mitochondria
protein. Then, the dataset was integrated using Harmony59 (version 1.0) and the cells were clustered using “FindNeighbors” and “FindClusters” function with parameter set to “resolution = 1”.
Finally, the cells were visualized by UMAP using the top 30 principal components. CELL TYPES ANNOTATION The markers of each clusters identified by the “FindAllMarker” function, as well as
some canonical markers, were visualized using violin plot and feature plot, the expression of them were used to classify and annotate the clusters. HFSC cells and clusters expression more
than 2 canonical cell type markers were excluded and 163,498 cells were retained for further analysis. DEGS ANALYSIS AND GO ENRICHMENT DEGs were performed using “FindMarkers” function with
MAST algorithm in Seurat based on a Bonferroni-adjusted _p_ < 0.05 and a log fold change > 0.25. For GO enrichment, DEGs identified were conducted using function enrichGO in
ClusterProfier (version 3.1.8.1) with parameter set to “OrgDb = org.Hs.eg.db, ont = ’BP’, pAdjustMethod = ’BH’”. HIERARCHICAL CLUSTERING OF GENE EXPRESSION CHANGES AT CELL TYPE RESOLUTION
Hierarchical clustering of gene expression changes was conducted following previous described method60. Briefly, the UMI count of each gene were normalized by the total UMI count in each
cell type and multiplied by 100,000. The gene expression of each disease groups was divided by the values in the healthy donors and the highly variable genes in terms of the top 3000
standard deviation followed by log2-transformation. Hierarchical clustering was conducted based on the Pearson correlation coefficient (PCC) of the highly variable genes. HIERARCHICAL
CLUSTERING OF RIBOSOMAL GENES IN WHOLE BLOOD RNA-SEQ Bulk RNA-seq data were downloaded from EMBL-EBI and accession codes is ERP127339. RNA-seq data of COVID-19 patients with duration time of
viral shedding were enrolled in this study. Finally, 103 patients were divided into three groups separated by 21 days and 45 days were aligned to the reference genome using hisat2 and the
gene expression level (FPKM) was calculated by RSEM. The expression of ribosomal genes was log2 transformed followed by z-transformation, which was used for hierarchical clustering. ANALYSIS
OF T CELLS, NK CELLS AND B CELLS T and NK cells were extracted from PBMCs and the cells were principal component analysis and visualized as described above. B cells in PBMCs were also
extracted and processed using the procedure used for T cells. DEFINING CELL REGULATION AND EXHAUSTION SCORES The regulation score in Treg based on the average expression of nine
regulation-associated genes (CTLA4, PDCD1, TIGIT, LAG3, FOXP3, CCR7, LGALS3, TRAF1, IL2RA)61. The exhaustion scores were based on the average expression of six exhaustion-associated genes 6
exhaustion-associated genes (CTLA4, PDCD1, TIGIT, LAG3, HAVCR2, TOX)62, the function “AddModuleScore” in Seurat was used to calculate the score with default parameters. HIERARCHICAL
CLUSTERING OF DEGS DEGs of COVID-19 groups compared to HDs were selected and the expression of them in individuals are calculated by the function “Average Expression” in Seurat followed by
z-transformation. Then the scaled expression was used for hierarchical clustering. TCR V(D)J ANALYSIS The sequencing data were performed using Cell Ranger V(D)J pipeline with GRCh38 as
reference. The TCR matrix containing barcode information and clonotype frequency was obtained, the cells with at least one productive TRA and one productive TRB were retained for further
analysis. Each unique TRA(s)-TRB(s) pair was defined as a clonotype. ANALYSIS SCRNA-SEQ DATA OF COVID-19 PATIENTS FROM ZHANG.ET42 scRNA-seq data of the study were downloaded from NCBI GEO
database (GSE158055). Patients with fresh PBMC were included in the analysis if they met the following criteria: (1) HDs: Control group (_n_ = 20); (2) SDs: Days after symptom onset within
21 and is already during convalescence (_n_ = 16); (3) LDs: Symptoms are still developing more than 45 days after onset (_n_ = 2). The data of selected samples was extracted and processed as
described in our dataset. After annotation of clusters, the T cells were retained for downstream analysis. BOXPLOT All of the box plots in this paper were performed using “ggboxplot()”
function in ggpubr R package. Each point represents for one sample. The horizontal line with each box represents the median, and the top and bottom of each box indicate the 25th and 75th
percentile. STATISTICAL ANALYSIS One-sided Wilcoxon rank-sum test were performed using R (version 4.0.2) in this study, *_p_ < 0.05, **_p_ < 0.01, ***_p_ < 0.001. The two-sided
log-rank test was performed using GraphPad Prism (version 8.0.2) in Fig. 1a. Non-paired two-tailed student _t_ test was performed using GraphPad Prism (version 8.0.2) in Fig. 1b. Non-paired
two-tailed student _t_ test and Fisher’s exact test was performed using SPSS (version 22.0) in supplementary table 1. REPORTING SUMMARY Further information on research design is available in
the Nature Research Reporting Summary linked to this article. DATA AVAILABILITY All data are available within the Article and Supplementary Files. The single-cell sequencing RNA data have
been deposited to the European Bioinformatics Institute (EMBL-EBI,) and accession codes is ERP128255. We download and analysis scRNA-seq data from NCBI GEO database
(https://www.ncbi.nlm.nih.gov/geo/) and accession codes is GSE158055. We also download and analysis bulk RNA-seq data of 103 COVID-19 patients from EMBL-EBI and accession codes is ERP127339.
Source data are provided with this paper. CODE AVAILABILITY Computer code is available from GitHub under https://github.com/FlyPythons/Singlecell_COVID19_persistent_infection. REFERENCES *
Zhu N. et al. A novel coronavirus from patients with pneumonia in China, 2019. _N. Engl. J. Med._ 382, 727–733 (2020). * Wu, F., Zhao, S., Yu, B., Chen, Y. M. & Zhang, Y. Z. A new
coronavirus associated with human respiratory disease in China. _Nature_ 579, 1–8 (2020). Article Google Scholar * Guan W. J., Ni Z. Y., Hu Y., Liang W. H. & Zhong N. S. Clinical
characteristics of coronavirus disease 2019 in China. _N. Engl. J. Med._ 382, 1708–1720 (2020). * Young, B. E. et al. Epidemiologic features and clinical course of patients infected with
SARS-CoV-2 in Singapore. _Jama_ 323, 1488–1494 (2020). Article CAS Google Scholar * Widders, A., Broom, A. & Broom, J. SARS-CoV-2: the viral shedding vs infectivity dilemma. _Infect.
Dis. Health_ 25, 210–215 (2020). Article Google Scholar * Long, Q.-X. et al. Clinical and immunological assessment of asymptomatic SARS-CoV-2 infections. _Nat. Med._ 26, 1200–1204 (2020).
Article CAS Google Scholar * Avanzato, V. A. et al. Case study: prolonged infectious SARS-CoV-2 shedding from an asymptomatic immunocompromised individual with cancer. _Cell_ 183,
1901–1912.e9 (2020). Article CAS Google Scholar * Fu Y. et al. Dynamics and correlation among viral positivity, seroconversion, and disease severity in COVID-19: a retrospective study.
_Ann. Intern. Med._ 174, 453–461 (2020). * Blanco-Melo, D. et al. Imbalanced host response to SARS-CoV-2 drives development of COVID-19. _Cell_ 181, 1036–1045.e9 (2020). Article CAS Google
Scholar * O’Connell P. & Aldhamen Y. A. Systemic innate and adaptive immune responses to SARS-CoV-2 as it relates to other coronaviruses. _Human Vaccines Immunother._ 16, 2980–2991
(2020). * Guidotti, L. G. & Chisari, F. V. Cytokine-mediated control of viral infections. _Virology_ 273, 221–227 (2000). Article CAS Google Scholar * Song P., Li W., Xie J., Hou Y.
& You C. Cytokine storm induced by SARS-CoV-2. _Clin. Chimica Acta_ 509, 280–287 (2020). * Newton A. H., Cardani A. & Braciale T. J. The host immune response in respiratory virus
infection: balancing virus clearance and immunopathology. _Seminars in immunopathology _38, 471–482 (2016). * Stephen-Victor E. et al. Potential of regulatory T-cell-based therapies in the
management of severe COVID-19. _Eur. Respir. J._ 56, 2002182 (2020). * Ramakrishnan, V. Ribosome structure and the mechanism of translation. _Cell_ 108, 557–572 (2002). Article CAS Google
Scholar * Bianco, C. & Mohr, I. Ribosome biogenesis restricts innate immune responses to virus infection and DNA. _Elife_ 8, e49551 (2019). Article Google Scholar * Schubert, K. et
al. SARS-CoV-2 Nsp1 binds the ribosomal mRNA channel to inhibit translation. _Nat. Struct. Mol. Biol._ 27, 959–966 (2020). Article CAS Google Scholar * Thoms, M. et al. Structural basis
for translational shutdown and immune evasion by the Nsp1 protein of SARS-CoV-2. _Science_ 369, 1249–1255 (2020). Article ADS CAS Google Scholar * Xu K. et al. Factors associated with
prolonged viral RNA shedding in patients with COVID-19. _Clin. Infect. Dis._ 71, 799–806 (2020). * Qi L. et al. Factors associated with duration of viral shedding in adults with COVID-19
outside of Wuhan, China: a retrospective cohort study. _Int. J. Infect. Dis._ 96, 531–537 (2020). * He, X. et al. Temporal dynamics in viral shedding and transmissibility of COVID-19. _Nat.
Med._ 26, 672–675 (2020). Article CAS Google Scholar * Ling W. C-reactive protein levels in the early stage of COVID-19. _Medecine et Maladies Infectieuses_ 50, 332–334 (2020). * Gao Y.
et al. Diagnostic utility of clinical laboratory data determinations for patients with the severe COVID‐19. _J. Med. Virol._ 92,791–796 (2020). * Qin C. et al. Dysregulation of immune
response in patients with COVID-19 in Wuhan, China. _Clin. Infect. Dis._ 71, 762–768 (2020). * Mehta, P. et al. COVID-19: consider cytokine storm syndromes and immunosuppression. _Lancet_
395, 1033–1034 (2020). Article CAS Google Scholar * Ye, Q., Wang, B. & Mao, J. The pathogenesis and treatment of the 'cytokine storm' in COVID-19. _J. Infect._ 80, 607–613
(2020). Article CAS Google Scholar * Shimizu M. Clinical Features of Cytokine Storm Syndrome. In: _Cytokine Storm Syndrome_. (Springer, 2019). * Huang, C. et al. Clinical features of
patients infected with 2019 novel coronavirus in Wuhan, China. _Lancet_ 395, 497–506 (2020). Article CAS Google Scholar * Chen G. et al. Clinical and immunologic features in severe and
moderate forms of Coronavirus Disease. _J. Clin. Invest. _130, 2620–2629 (2019). * Zhu L. et al. Single-cell sequencing of peripheral blood mononuclear cells reveals distinct immune response
landscapes of COVID-19 and influenza patients. _Immunity_ 53, 685–696.e3 (2020). * Zhou Y. et al. Pathogenic T-cells and inflammatory monocytes incite inflammatory storms in severe
COVID-19 patients. _Natl Sci. Rev. _7, 998–1002 (2020). * Lee, D. C. et al. CD25+ natural regulatory T cells are critical in limiting innate and adaptive immunity and resolving disease
following respiratory syncytial virus infection. _J. Virol._ 84, 8790–8798 (2010). Article CAS Google Scholar * Stephen-Victor E. et al. Potential of regulatory T cell-based therapies in
the management of severe COVID-19. _Eur. Respir. J._ 56, 2002182 (2020). * Chen Z., Wherry E. J. T cell responses in patients with COVID-19. _Nat. Rev. Immunol._ 20, 529–536 (2020). *
Fleischer, T. C., Weaver, C. M., McAfee, K. J., Jennings, J. L. & Link, A. J. Systematic identification and functional screens of uncharacterized proteins associated with eukaryotic
ribosomal complexes. _Genes Dev._ 20, 1294–1307 (2006). Article CAS Google Scholar * Kamenova, I. et al. Co-translational assembly of mammalian nuclear multisubunit complexes. _Nat.
Commun._ 10, 1740 (2019). Article ADS Google Scholar * Marques, N. et al. Regulation of protein translation and c-Jun expression by prostate tumor overexpressed 1. _Oncogene_ 33,
1124–1134 (2014). Article CAS Google Scholar * Van Anken, E. et al. Efficient IgM assembly and secretion require the plasma cell induced endoplasmic reticulum protein pERp1. _Proc. Natl
Acad. Sci._ 106, 17019–17024 (2009). Article ADS Google Scholar * So, J.-S. Roles of endoplasmic reticulum stress in immune responses. _Mol. Cells_ 41, 705–716 (2018). CAS PubMed
PubMed Central Google Scholar * Guo, F., Cancelas, J. A., Hildeman, D., Williams, D. A. & Zheng, Y. Rac GTPase isoforms Rac1 and Rac2 play a redundant and crucial role in T-cell
development. _Blood, J. Am. Soc. Hematol._ 112, 1767–1775 (2008). CAS Google Scholar * Cronkite D. A. & Strutt T. M. The regulation of inflammation by innate and adaptive lymphocytes.
_J. Immunol. Res._ 2018, 1467538 (2018). * Ren X. et al. COVID-19 immune features revealed by a large-scale single-cell transcriptome atlas. _Cell_ 184, 1895–1913.e19 (2021). * Zheng, M. et
al. Functional exhaustion of antiviral lymphocytes in COVID-19 patients. _Cell. Mol. Immunol._ 17, 533–535 (2020). Article CAS Google Scholar * Maucourant C. et al. Natural killer cell
immunotypes related to COVID-19 disease severity. _Sci. Immunol._ 5, eabd6832 (2020). * Okeke, E. B. & Uzonna, J. E. The pivotal role of regulatory T cells in the regulation of innate
immune cells. _Front. Immunol._ 10, 680 (2019). Article CAS Google Scholar * Andersen, M. H., Schrama, D., thor Straten, P. & Becker, J. C. Cytotoxic T cells. _J. Investig. Dermatol._
126, 32–41 (2006). Article CAS Google Scholar * LeBien, T. W. & Tedder, T. F. B lymphocytes: how they develop and function. _Blood_ 112, 1570–1580 (2008). Article CAS Google
Scholar * Zhang J.-Y. et al. Single-cell landscape of immunological responses in patients with COVID-19. _Nat. Immunol._ 21,1107–1118 (2020). * Kellam P., Barclay W. The dynamics of humoral
immune responses following SARS-CoV-2 infection and the potential for reinfection. _J. General Virol._ 101, 791–797 (2020). * Broers, A. E. et al. Increased transplant-related morbidity and
mortality in CMV-seropositive patients despite highly effective prevention of CMV disease after allogeneic T-cell–depleted stem cell transplantation. _Blood J. Am. Soc. Hematol._ 95,
2240–2245 (2000). CAS Google Scholar * Shah, K. V., Daniel, R. W., Zeigel, R. F. & Murphy, G. P. Search for BK and SV40 virus reactivation in renal transplant recipients.
_Transplantation_ 17, 131–134 (1974). Article CAS Google Scholar * Helleberg, M. et al. Persistent COVID-19 in an immunocompromised patient temporarily responsive to two courses of
remdesivir therapy. _J. Infect. Dis._ 222, 1103–1107 (2020). Article CAS Google Scholar * Kusnadi A. et al. Severely ill COVID-19 patients display impaired exhaustion features in
SARS-CoV-2-reactive CD8+ T cells. _Sci. Immunol._ 6, eabe4782 (2021). * Grein, J. et al. Compassionate use of remdesivir for patients with severe Covid-19. _N. Engl. J. Med._ 382, 2327–2336
(2020). Article CAS Google Scholar * Pickles, O. J. et al. Immune checkpoint blockade: releasing the breaks or a protective barrier to COVID-19 severe acute respiratory syndrome? _Br. J.
Cancer_ 123, 691–693 (2020). Article CAS Google Scholar * Zhang, K. et al. Nsp1 protein of SARS-CoV-2 disrupts the mRNA export machinery to inhibit host gene expression. _Sci. Adv._ 7,
eabe7386 (2021). Article ADS CAS Google Scholar * Bost, P. et al. Host-viral infection maps reveal signatures of severe COVID-19 patients. _Cell_ 181, 1475–1488.e12 (2020). Article CAS
Google Scholar * Pijuan-Sala, B. et al. A single-cell molecular map of mouse gastrulation and early organogenesis. _Nature_ 566, 490–495 (2019). Article ADS CAS Google Scholar *
Korsunsky, I. et al. Fast, sensitive and accurate integration of single-cell data with Harmony. _Nat. Methods_ 16, 1289–1296 (2019). Article CAS Google Scholar * Lee J. S. et al.
Immunophenotyping of COVID-19 and influenza highlights the role of type I interferons in development of severe COVID-19. _Sci. Immunol._ 5, eabd1554 (2020). * Pfoertner, S. et al. Signatures
of human regulatory T cells: an encounter with old friends and new players. _Genome Biol._ 7, 1–18 (2006). Article Google Scholar * Kim, K. et al. Single-cell transcriptome analysis
reveals TOX as a promoting factor for T cell exhaustion and a predictor for anti-PD-1 responses in human cancer. _Genome Med._ 12, 1–16 (2020). Article CAS Google Scholar Download
references ACKNOWLEDGEMENTS We thank the anonymous referees for their useful suggestions and all the enrolled patients for their dedication to science. AUTHOR INFORMATION Author notes *
These authors contributed equally: Bin Yang, Junpeng Fan, Jia Huang. * These authors jointly supervised this work: Kezhen Li, Chaoyang Sun. AUTHORS AND AFFILIATIONS * Department of
Obstetrics and Gynecology, Tongji Hospital, Tongji Medical College, Huazhong University of Science and Technology, Wuhan, China Bin Yang, Junpeng Fan, Jia Huang, Ensong Guo, Yu Fu, Si Liu,
Rourou Xiao, Chen Liu, Funian Lu, Tianyu Qin, Chao He, Zizhuo Wang, Xu Qin, Dianxing Hu, Lixin You, Xi Li, Tian Wang, Peng Wu, Gang Chen, Kezhen Li & Chaoyang Sun * Cancer Biology
Research Center, Tongji Hospital, Tongji Medical College, Huazhong University of Science and Technology, Wuhan, China Bin Yang, Junpeng Fan, Jia Huang, Ensong Guo, Yu Fu, Si Liu, Rourou
Xiao, Chen Liu, Funian Lu, Tianyu Qin, Chao He, Zizhuo Wang, Xu Qin, Dianxing Hu, Lixin You, Xi Li, Tian Wang, Peng Wu, Gang Chen, Kezhen Li & Chaoyang Sun * Department of Hematology,
Tongji Hospital, Tongji Medical College, Huazhong University of Science and Technology, Wuhan, China Jianfeng Zhou Authors * Bin Yang View author publications You can also search for this
author inPubMed Google Scholar * Junpeng Fan View author publications You can also search for this author inPubMed Google Scholar * Jia Huang View author publications You can also search for
this author inPubMed Google Scholar * Ensong Guo View author publications You can also search for this author inPubMed Google Scholar * Yu Fu View author publications You can also search
for this author inPubMed Google Scholar * Si Liu View author publications You can also search for this author inPubMed Google Scholar * Rourou Xiao View author publications You can also
search for this author inPubMed Google Scholar * Chen Liu View author publications You can also search for this author inPubMed Google Scholar * Funian Lu View author publications You can
also search for this author inPubMed Google Scholar * Tianyu Qin View author publications You can also search for this author inPubMed Google Scholar * Chao He View author publications You
can also search for this author inPubMed Google Scholar * Zizhuo Wang View author publications You can also search for this author inPubMed Google Scholar * Xu Qin View author publications
You can also search for this author inPubMed Google Scholar * Dianxing Hu View author publications You can also search for this author inPubMed Google Scholar * Lixin You View author
publications You can also search for this author inPubMed Google Scholar * Xi Li View author publications You can also search for this author inPubMed Google Scholar * Tian Wang View author
publications You can also search for this author inPubMed Google Scholar * Peng Wu View author publications You can also search for this author inPubMed Google Scholar * Gang Chen View
author publications You can also search for this author inPubMed Google Scholar * Jianfeng Zhou View author publications You can also search for this author inPubMed Google Scholar * Kezhen
Li View author publications You can also search for this author inPubMed Google Scholar * Chaoyang Sun View author publications You can also search for this author inPubMed Google Scholar
CONTRIBUTIONS C.S. and K.L. conceived the experiments. B.Y. and J.H. collected the samples and performed single-cell library construction. J.F. and C.S. performed single-cell data analysis.
E.G., Y.F., S.L., R.X., C.L., F.L., Z.W., X.L., T.Q., X.Q., D.H., L.Y., T.W., C.H., J.Z. collected clinical information, interpretation of data. B.Y., J.F. and J.H. wrote the paper and C.S.,
K.L., P.W., G.C., E.G., Y.F., S.L., R.X., X.W., C.L., F.L., Z.W., X.L., T.Q., X.Q., D.H., L.Y., T.W. C.H. and J.Z. revised it. P.W., G.C., K.L. and C.S. provided expertize and feedback.
C.S. and K.L. conceived and coordinated the project. CORRESPONDING AUTHORS Correspondence to Kezhen Li or Chaoyang Sun. ETHICS DECLARATIONS COMPETING INTERESTS The authors declare no
competing interests. ADDITIONAL INFORMATION PEER REVIEW INFORMATION _Nature Communications_ thanks Yasunobu Yoshikai and the other, anonymous, reviewer(s) for their contribution to the peer
review of this work. Peer reviewer reports are available. PUBLISHER’S NOTE Springer Nature remains neutral with regard to jurisdictional claims in published maps and institutional
affiliations. SUPPLEMENTARY INFORMATION SUPPLEMENTARY INFORMATION PEER REVIEW FILE REPORTING SUMMARY SOURCE DATA SOURCE DATA RIGHTS AND PERMISSIONS OPEN ACCESS This article is licensed under
a Creative Commons Attribution 4.0 International License, which permits use, sharing, adaptation, distribution and reproduction in any medium or format, as long as you give appropriate
credit to the original author(s) and the source, provide a link to the Creative Commons license, and indicate if changes were made. The images or other third party material in this article
are included in the article’s Creative Commons license, unless indicated otherwise in a credit line to the material. If material is not included in the article’s Creative Commons license and
your intended use is not permitted by statutory regulation or exceeds the permitted use, you will need to obtain permission directly from the copyright holder. To view a copy of this
license, visit http://creativecommons.org/licenses/by/4.0/. Reprints and permissions ABOUT THIS ARTICLE CITE THIS ARTICLE Yang, B., Fan, J., Huang, J. _et al._ Clinical and molecular
characteristics of COVID-19 patients with persistent SARS-CoV-2 infection. _Nat Commun_ 12, 3501 (2021). https://doi.org/10.1038/s41467-021-23621-y Download citation * Received: 20 September
2020 * Accepted: 08 May 2021 * Published: 09 June 2021 * DOI: https://doi.org/10.1038/s41467-021-23621-y SHARE THIS ARTICLE Anyone you share the following link with will be able to read
this content: Get shareable link Sorry, a shareable link is not currently available for this article. Copy to clipboard Provided by the Springer Nature SharedIt content-sharing initiative