- Select a language for the TTS:
- UK English Female
- UK English Male
- US English Female
- US English Male
- Australian Female
- Australian Male
- Language selected: (auto detect) - EN
Play all audios:
ABSTRACT Associations between gut microbiota and colorectal cancer (CRC) have been widely investigated. However, the replicable markers for early-stage adenoma diagnosis across multiple
populations remain elusive. Here, we perform an integrated analysis on 1056 public fecal samples, to identify adenoma-associated microbial markers for early detection of CRC. After adjusting
for potential confounders, Random Forest classifiers are constructed with 11 markers to discriminate adenoma from control (area under the ROC curve (AUC) = 0.80), and 26 markers to
discriminate adenoma from CRC (AUC = 0.89), respectively. Moreover, we validate the classifiers in two independent cohorts achieving AUCs of 0.78 and 0.84, respectively. Functional analysis
reveals that the altered microbiome is characterized with increased ADP-l-glycero-beta-d-manno-heptose biosynthesis in adenoma and elevated menaquinone-10 biosynthesis in CRC. These findings
are validated in a newly-collected cohort of 43 samples using quantitative real-time PCR. This work proves the validity of adenoma-specific markers across multi-populations, which would
contribute to the early diagnosis and treatment of CRC. SIMILAR CONTENT BEING VIEWED BY OTHERS TOWARDS A METAGENOMICS MACHINE LEARNING INTERPRETABLE MODEL FOR UNDERSTANDING THE TRANSITION
FROM ADENOMA TO COLORECTAL CANCER Article Open access 10 January 2022 POOLED ANALYSIS OF 3,741 STOOL METAGENOMES FROM 18 COHORTS FOR CROSS-STAGE AND STRAIN-LEVEL REPRODUCIBLE MICROBIAL
BIOMARKERS OF COLORECTAL CANCER Article Open access 03 June 2025 DYSBIOSIS OF HUMAN GUT MICROBIOME IN YOUNG-ONSET COLORECTAL CANCER Article Open access 19 November 2021 INTRODUCTION
Colorectal cancer (CRC) is one of the most common cancers with an overall high mortality rate. According to the report of the International Agency for Research on Cancer (IARC), there were
over 1,800,000 new CRC cases and over 860,000 deaths in 20181. And CRC accounted for approximately 10% of all new cancer cases globally2. It is estimated that the national expenditures in
the United States on cancer care, specifically colorectal cancer, were about 16.63 billion dollars in 20183, and the CRC burden is continuously growing over years. Colorectal adenomas are
recognized as precursors for the majority of CRC2. The early detection of CRC at precancerous-stage adenoma has brought the 5-year relative survival rate to around 90%, significantly
facilitating early decision making, alleviating the incidence of CRC, and reducing economic burden2,4. Gut microbiome is a stool-based non-invasive biomarker for metabolic diseases and
cancers5,6. Many studies have reported that the gut microbiome is an important etiological element in the initiation and progression of CRC4,7 and have identified some fecal microbial
markers of CRC8,9,10. However, it is not clear whether these biomarkers could precisely detect adenomas, early-stage CRC. Furthermore, current knowledge of the associations between the
microbiome and colorectal adenoma is limited. Only a few studies have investigated the microbial alterations in colorectal adenoma4,7,11,12,13. Besides, substantial variations on microbial
makers exist among these studies, which could be due to various biological factors influencing gut microbiome composition and inconsistent processing of microbial sequencing data.
Meta-analysis offers a set of tools that are powerful, informative, and unbiased to reduce the noise of biological and technical confounders so that consistent and robust alterations across
multiple studies could be identified. Recently, several meta-analyses on multi-studies have identified universal microbial markers across multiple diseases, such as CRC11,13,14,15,
obesity16, inflammatory bowel disease (IBD)17, via 16S rRNA sequencing or whole metagenome shotgun sequencing (WMS) technique. However, universal microbial markers specific for colorectal
adenoma were less frequently reported or showed relatively lower accuracies for diagnosis11,13. Thomas et al11 identified a few microbial markers of colorectal adenomas from a WMS-based
meta-analysis and their classifiers showed low accuracy in distinguishing adenomas from healthy controls (area under the ROC curve (AUC) = 0.54) or CRC (AUC = 0.69)11, probably due to the
limited coverage of taxonomy and high dependence on reference genomes in WMS taxonomic profiling18. A recent meta-analysis study based on 16S rRNA mainly investigated colonic cancerous
tissues and identified some tissue-based microbial markers for colorectal adenoma13. Tissue-based microbial markers were invasive and less accessible than stool-based microbial markers.
Additionally, the commonly used non-invasive stool-based screening test, fecal immunochemical test (FIT), has drawbacks such as poor sensitivity to early and advanced adenoma (7.6% and 38%,
respectively)19. Therefore, it is urgent to explore and identify stool-based microbial markers that could more precisely and efficiently diagnose colorectal adenoma. In this work, we perform
an integrated analysis on a total of 1056 samples with published 16S rRNA data from multiple studies considering that 16S rRNA-based profiles are better representations of the “real
community”20. Based on the discovery dataset comprising 775 samples, we construct the Random Forest (RF) model achieving a high accuracy (AUC = 0.80) with 11 important features to
distinguish colorectal adenoma from non-tumor control. Similarly, the AUC of the RF model for distinguishing colorectal adenoma from CRC with 26 important features is 0.89. Through
study-to-study transfer validation and leave-one-dataset-out (LODO) validation across multiple data sets, the important features can overcome technical and geographical discrepancies with an
average AUC of 0.76 in the adenoma-control model and 0.89 in the adenoma-cancer model. These important features are validated with two additional independent cohorts comprising 281 samples
and are specific to adenoma against other microbiome-linked diseases. Furthermore, pooled functional analysis based on the Phylogenetic Investigation of Communities by Reconstruction of
Unobserved States (PICRUSt2) reveals that altered microbiome is characterized by increased ADP-l-glycero-beta-d-manno-heptose (ADP-heptose) biosynthesis in adenoma and elevated menaquinol-10
(MK-10) biosynthesis (_P_ < 0.05) in CRC. These findings are validated with a newly collected cohort of 43 samples using quantitative real-time PCR (qRT-PCR). The integrated analyses of
heterogeneous studies prove the validity of adenoma-specific markers across multi-populations, which would contribute to the early diagnosis and treatment of CRC. RESULTS CHARACTERISTICS OF
THE DATA SETS IN META-ANALYSIS In this study, we investigated 16S rRNA sequencing data from four studies to evaluate the gut microbiome changes as CRC progresses (from control to adenoma to
cancer) and to identify the biomarkers specific to adenoma. In total, we collected 306 samples from colorectal adenoma patients, 217 from CRC subjects, and 252 samples from healthy controls.
The demographic information was listed in Table 1. All samples were sequenced at sufficient depth except one sample in US1 (SRR5184891), which was excluded for further analysis. The average
count of sequencing reads in each sample is 85,637. Consistent processing was performed for all raw sequencing data on the Quantitative Insights Into Microbial Ecology 2 (QIIME2) platform.
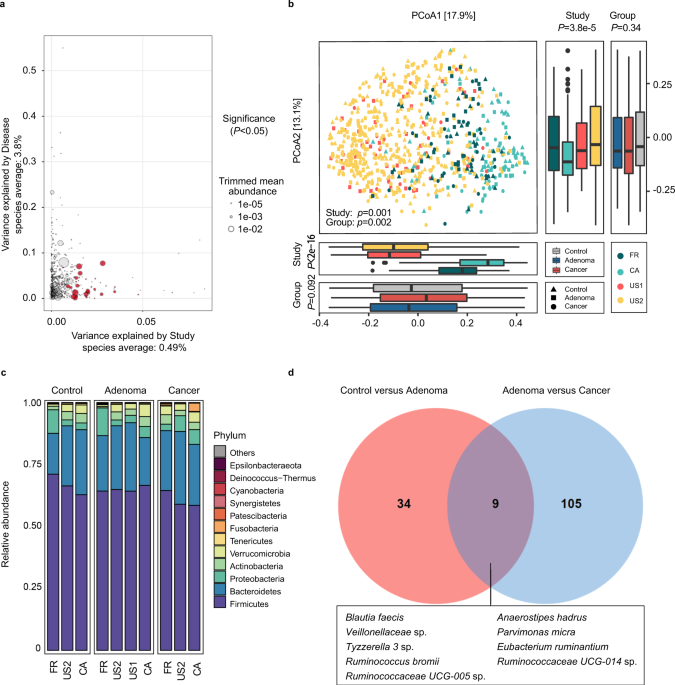
IDENTIFICATION OF THE POTENTIAL CONFOUNDER IN META-ANALYSIS Since differences existed among these studies in both technical and biological aspects, we first investigated the potential
confounders. The variances explained by disease status for each amplicon sequence variants (ASVs) were calculated to quantify the effects of potential confounders (see “Confounder analysis”
section, Fig. 1a and Supplementary Fig. 1, 2). The variance of ASVs explained by “study” was greater than that by disease status and by other potential confounders. Additionally, beta
diversity varied among different studies (_P_ = 0.001, Fig. 1b). These results revealed that the factor “study” had a predominant impact on microbial composition at both the single taxon
level and community level. Therefore, we treated “study” as a blocking factor in the subsequent analysis and used a two-sided blocked Wilcoxon rank-sum test to adjust the batch effect and
identify differential ASVs that were less affected by “study”. ALTERATIONS OF GUT MICROBIAL COMPOSITION IN COLORECTAL ADENOMA Gut microbiota highly varied among different disease statuses
(_P_ = 0.002, Fig. 1b). Moreover, the Shannon index showed no significant differences between groups (Supplementary Fig. 3a), while the Simpson’s Index of Diversity was significantly higher
in the adenoma groups (_P_ = 0.043) and in the control groups (_P_ = 0.020, Supplementary Fig. 3b) than that in the cancer groups when blocking the “study” confounder. At the phylum level,
the gut microbiota was dominated by members of Firmicutes and Bacteroidetes, followed by Proteobacteria, Actinobacteria, Verrucomicrobia, Tenericutes, and Fusobacteria in healthy controls,
adenomas, and CRC (Fig. 1c). These dominant phyla were similar to those reported in the previous studies21. Furthermore, the phylum Fusobacteria, the most CRC-associated bacteria as
reported22, had significantly decreased abundance (_P_ < 0.05) in adenoma compared to that in cancer, while showed no significant difference between adenoma patients and controls (Fig. 1c
and Supplementary Data 1). At the ASV level, 43 ASVs were identified with distinguishable differential abundances in the comparison of gut communities between controls and patients with
adenoma. Specifically, there were six ASVs depleted in adenoma, which were assigned as _Bifidobacterium longum_, _Anaerostipes hadrus_, _Lactococcus taiwanensis_, _Aminipila butyrica_, etc.
Besides, the abundances of 37 ASVs were increased in adenoma compared with control, and they were assigned as _Eubacterium coprostanoligenes_, _Methanobrevibacter millerae_,
_Christensenellaceae R-7_ group sp., etc (Supplementary Data 2). Moreover, we also identified 114 differentially abundant ASVs between adenoma and cancer. Among these, 56 ASVs were in lower
abundance in adenoma compared with cancer, which were assigned as _Lachnoclostridium_ sp., _[Ruminococcus] gnavus_ group sp., _[Clostridium] scindens_, _Escherichia-Shigella_ sp., etc. The
ASVs in higher abundance in adenoma than cancer were assigned as _Blautia obeum_, _Butyricicoccus faecihominis_, _Erysipelotrichaceae UCG-003_ sp., _Dorea longicatena_, etc (Supplementary
Data 3). Additionally, pathogenic bacteria with increased abundance were detected in adenoma or cancer compared with control. For instance, ASVs assigned as _Parvimonas micra_ was enriched
in adenoma compared with control (Supplementary Data 2) while ASVs assigned as _Fusobacterium nucleatum_, _Porphyromonas_ sp. _HMSC077F02_, _Porphyromonas asaccharolytica, Peptostreptococcus
stomatis_, _P. micra_, and _Escherichia-Shigella_ sp. were enriched in cancer compared with adenoma (Supplementary Data 3). Notably, between control versus adenoma and adenoma versus
cancer, there were only nine common differential ASVs, which were assigned as _Blautia faecis_, _A. hadrus_, _P. micra_, _Tyzzerella 3_ sp., _Eubacterium ruminantium,_ etc (Fig. 1d). The two
sets of differential ASVs with a Jaccard distance of 0.939 indicate that the microbiota has a remarkable difference between adenoma and control or cancer. MICROBIAL CLASSIFICATION MODELS
FOR COLORECTAL ADENOMA Next, we constructed stratified 10-fold cross-validation RF models, by pooling all samples to distinguish adenoma from control and cancer. Besides using differential
ASVs as key metrics, alpha diversity indices including Shannon Index, Simpson Index, and Observed ASVs, and three patient metadata, age, sex, and body mass index (BMI) were also included in
model building. To obtain the best performing models and important features, an iterative feature elimination (IFE) step was further applied. A robust RF model was eventually constructed
with a core set of important features, including eight differential ASVs (as biomarkers) together with age, sex, and BMI, which achieved an AUC of 0.80 for distinguishing control subjects
from adenoma patients (accuracy: 0.73, sensitivity: 0.82, specificity: 0.62, precision: 0.73 and F1 score: 0.77, Fig. 2a, c, Supplementary Data 4, and Supplementary Table 1). Among these,
the ASV assigned as _Christensenellaceae R-7_ group sp. was the highest-ranking biomarker (Fig. 2a). The biomarkers also included ASVs assigned as _E. coprostanoligenes_, _Ruminiclostridium
9_ sp., _Christensenellaceae R-7_ group sp., _Ruminococcaceae UCG-005_ sp., and _Veillonella parvula_ of increased abundance as well as _Rothia dentocariosa_ and _A. butyrica_ of decreased
abundance in adenoma (Fig. 2a). Similarly, the RF model in distinguishing adenoma from cancer achieved an AUC of 0.89 (accuracy: 0.80, sensitivity: 0.66, specificity: 0.90, precision: 0.83
and F1 score: 0.72, Fig. 2b, d and Supplementary Table 1). The RF model was built with 24 ASVs together with age and BMI (Fig. 2b and Supplementary Data 5). Among these, the ASV belonging to
_Streptococcus thermophilus TH1435_ was the top-ranking biomarker (Fig. 2b), followed by ASVs assigned as _P. micra_, _Bacteroides dorei_, _C. scindens_, _Erysipelatoclostridium ramosum_,
_Blautia_ sp., _[Eubacterium] coprostanoligenes_ group sp., and _Lachnospira pectinoschiza_ (Fig. 2b). The _C. scindens_ was significantly (_P_ < 0.001) enriched in cancer compared with
adenoma. Additionally, the abundance of ASVs assigned as _C. scindens_, _Blautia_ sp., _[Eubacterium] coprostanoligenes_ group sp. and _P. micra_ increased in CRC while _S. thermophilus
TH1435_, _E. ruminantium_, _E. ramosum_ and _L. pectinoschiza_ increased in adenoma (Fig. 2b). In these two models, age was ranked as the top and third predictor in the testing phase,
respectively. In the two sets of biomarkers, there was only one common ASV classified as _E. ruminantium_. Moreover, we also identified that a core set of 34 ASVs, together with age, sex,
and BMI, collectively had the highest capability to distinguish control from cancer (AUC = 0.93, Supplementary Fig. 4). The ASVs ranked as the top important markers assigned as _F.
nucleatum_ and _P. asaccharolytica_, which were also ranked as top markers in two recent meta-analysis of CRC based on WMS data (Supplementary Data 6). Moreover, we found that there were six
common biomarkers between CRC-vs-control biomarker set and CRC-vs-adenoma biomarker set, while there was no common ASV in the two sets of biomarkers between control-vs-adenoma and
control-vs-CRC (Supplementary Fig. 5). These results highlighted that microbial markers aimed to detect CRC are specific and exclusive, not as applicable for diagnosing adenoma.
CO-OCCURRENCE AND CLUSTERING ANALYSIS OF MICROBIOTA We next constructed the co-occurrence network of differential ASVs, using the SparCC algorithm23. In the co-occurrence network of
differential ASVs between adenoma and control, we found widespread negative correlations among these ASVs, indicating a status of many competitions among community members in an unstable
community (Supplementary Fig. 6a and Supplementary Data 7). Notably, most of the negative correlations were associated with the ASV assigned as _A. hadrus_ (the 2nd ASV), which may protect
against colon cancer in humans by producing butyric acid24. The first and second ranking biomarkers between adenoma and control, assigned as _Christensenellaceae R-7_ group sp. and
_Ruminococcaceae UCG-005_ sp., were highly correlated to other ASVs, indicating important roles in the microbial community. Moreover, a module containing 8 nodes and 15 interactions was
identified by MCODE25 with the highest score (Supplementary Fig. 6b). In this module, the biomarker assigned as _Ruminococcaceae UCG-005_ sp. acted as the hub node, and associated with a
wide range of ASVs assigned as _R. dentocariosa_, _A. hadrus_ (the 2nd ASV), _Ruminococcaceae UCG-002_ sp. (the 15th ASV), and _B_. _longum_ (the 1st ASV). Additionally, we constructed the
co-occurrence network of differential ASVs between adenoma and CRC (Supplementary Fig. 6c and Supplementary Data 8). Positive correlations among the adenoma- and CRC-enriched ASVs were
observed in general while negative correlations were also observed. Two modules were identified by the MCODE from this network (Supplementary Fig. 6d). One module comprised 14 nodes and 72
edges with a score of 11.08. In this module, the top-ranking biomarker, _S. thermophilus TH1435_ was correlated with multiple nodes, such as _[Ruminococcus] gnavus_ group sp., _[Eubacterium]
nodatum_ group sp. (the 62nd ASV), and _Faecalibacterium prausnitzii A2-165_ (the 24th ASV). The other module contained five nodes and 10 edges, in which the biomarker assigned as _C.
scindens_ was capable of converting primary bile acids to toxic secondary bile acids inducing cancer26. In summary, our results suggested that most of the identified biomarkers have a broad
and large impact on the members of the microbial networks. To gain further insight, we analyzed and compared the pattern of biomarkers in adenoma and control groups, which were further
assembled into four clusters with distinct taxonomic compositions (Supplementary Fig. 7a). These clusters are not tightly associated with patient characteristics such as age, sex, and BMI
(Supplementary Fig. 8a). Moreover, we also explored the CRC patient gut microbiota for co-occurrences among a panel of 24 biomarkers and yielded three clusters (Supplementary Fig. 7b).
Cluster 1 had the fewest ASVs that were assigned as species from Lachnospiraceae family, and cluster 2 was heterogeneous in taxonomy with a relatively high prevalence in CRC individuals.
Notably, cluster 3 demonstrated strong taxonomic consistency, primarily belonging to Clostridiales. We then investigated associations of these clusters with various tumor characteristics.
These biomarker clusters were not biased by patients’ age, BMI or cancer stage, but cluster 1 was significantly enriched in female CRC patients. (Supplementary Fig. 8b). Considering the
impact of different studies, all of these tests were adjusted by blocking “study” (see “Co-occurrence and clustering analysis” section). VALIDATION OF THE COLORECTAL ADENOMA CLASSIFIERS To
test whether the identified important features are universal and robust across multiple studies, we performed study-to-study transfer validation and LODO validation on the entire samples. In
the control versus adenoma models, the AUC values of study-to-study transfer validation ranged from 0.52 to 0.81, with an average of 0.64 (Fig. 3a). Notably, the US2 study served as a
better training set than other studies achieving relatively higher testing AUCs (average AUC = 0.70). This may be explained by the larger size of the dataset. Moreover, to compare the
diagnostic performance of the important features with the FIT, the most widely used non-invasive stool test, we collected the publicly available FIT samples (including 172 control
individuals and 198 adenoma patients) from a published study27. The performance of the RF model constructed with FIT being the only feature for distinguishing adenoma from control is 0.60
(AUC). The model constructed with important features tested on the cohorts in this study was proved to be superior to that of the FIT, with an AUC of 0.78. Moreover, the combination of FIT
with the important features further improved the diagnostic accuracy for adenoma (about 3%) and achieved the best performance of 0.81 (AUC) (Supplementary Fig. 10). Altogether, our results
demonstrate that the microbial-derived biomarker panel is superior to FIT for detecting colorectal adenoma and their combination can improve the accuracy of non-invasive diagnosis of
adenoma. Additionally, the AUC values of LODO analysis ranged from 0.63 to 0.93 (average AUC = 0.76), which was better than those achieved in study-to-study transfer validation owing to
using a larger amount of training data (Fig. 3a). Furthermore, with the increase of training samples, the AUC values of LODO analysis increased in parallel (Supplementary Fig. 11),
predicting a trend of improved diagnostic accuracy as more public adenoma data sets become available. Similar results were observed in the adenoma versus cancer models (Fig. 3b). The AUC
values of study-to-study transfer validation ranged from 0.59 to 0.93 (average AUC = 0.76). Moreover, the AUC values were also elevated in the LODO analysis, ranging from 0.86 to 0.95 with
an average of 0.89 (Fig. 3b). Additionally, control versus cancer models showed robustness through study-to-study transfer validation (average AUC = 0.83) and LODO validation (average AUC =
0.90) (Supplementary Fig. 12). We noticed that the classifiers performed better in adenoma versus cancer and control versus cancer than that in control versus adenoma, likely because the
adenoma-associated stool microbiome closely resembles that of the healthy status7,11,21. Furthermore, we tested the diagnostic capability of several sets of features including all ASVs,
differential ASVs and all important features (Supplementary Fig. 13). In both study-to-study transfer validation (Fig. 3c, d) and LODO validation (Supplementary Fig. 14a, b), the set of all
important features performed better than the other two sets of ASVs, except for the CA study. This may be due to the small sample size and geographic heterogeneity in the CA study. When the
number of top-ranking features decreased, the accuracy of classifiers decreased conformably (Fig. 3c, d). Therefore, these results supported the use of all important features as the main
feature set for adenoma diagnosis. VALIDATION OF COLORECTAL ADENOMA MARKERS IN INDEPENDENT COHORTS To further validate our meta-analysis results, two additional independent cohorts from
America (validation cohort1) and China (validation cohort2) were incorporated into this study. The validation cohort1 is comprised of 70 controls and 102 adenoma patients, while there are 57
adenoma patients and 52 CRC patients in the validation cohort2 (Supplementary Table 2). The reconstructed RF models in the two independent cohorts achieved AUCs of 0.78 (accuracy: 0.70,
sensitivity: 0.76, specificity: 0.59, precision: 0.71 and F1 score: 0.77) and 0.84 (accuracy: 0.79, sensitivity: 0.79, specificity: 0.80, precision: 0.78 and F1 score: 0.72) for
distinguishing adenoma from controls or cancer, respectively (Supplementary Fig. 15a, b). Notably, only microbial biomarkers and sex information were used in the validation cohort2 due to
the unavailability of age and BMI information, which achieved a relatively higher AUC. Additionally, the features’ ranks were consistent with that in the discovery RF models, for instance,
ASVs assigned as _Ruminococcaceae UCG-005_ sp. and _Christensenellaceae R-7_ group sp. were confirmed as the top-ranking biomarkers between controls and adenoma patients in validation
cohort1 (Supplementary Data 9). Furthermore, ASVs assigned as _P. micra_, and _B. dorei_ were also confirmed as the top-ranking biomarkers for distinguishing between adenoma and CRC patients
in validation cohort2 (Supplementary Data 10). THE SPECIFICITY OF COLORECTAL ADENOMA PREDICTIVE MODELS Since improving the specificity of markers could reduce false positives in clinical
diagnosis17, it is necessary to further evaluate the specificity of our identified adenoma markers, such as in the context of other microbiome-linked diseases11. In this analysis, five
non-CRC diseases including Crohn’s disease (CD), ulcerative colitis (UC), irritable bowel syndrome (IBS), non-alcoholic fatty liver disease (NAFLD), and type 2 diabetes (T2D) were considered
(Supplementary Table 2). The AUC values of non-CRC disease models were significantly lower than that of an independent adenoma model (Supplementary Fig. 16), which indicated that our
markers have high specificity for adenoma. MICROBIAL FUNCTIONAL CHANGES IN COLORECTAL ADENOMA We examined the microbiome-based functional alterations on multiple different disease status.
There were 27 differential pathways between control and adenoma (Supplementary Data 11) and 41 differential pathways between adenoma and cancer (Supplementary Data 12) consistently detected
across studies. A total of 64 differential pathways (4 pathways were overlapped) were clustered based on their generalized fold change scores (Fig. 4). In detail, in comparison between
adenoma and control, pathways of carbohydrate biosynthesis (e.g., ADP-heptose biosynthesis), inorganic nutrient metabolism, and nucleoside and nucleotide biosynthesis were enriched in
adenoma, whereas, pathways of aromatic compound degradation, and secondary metabolite biosynthesis were decreased in adenoma samples. In comparison between adenoma and CRC, pathways of
cofactor, prosthetic group, electron carrier, vitamin biosynthesis (e.g., MK-10 biosynthesis), and amino acid degradation and fermentation were enriched in cancer. On the other hand, cell
structure biosynthesis and fatty acid and lipid biosynthesis/degradation pathways were decreased in adenoma. Notably, the abundance of biosynthesis of ADP-heptose, a key metabolic
intermediate in the biosynthesis of lipopolysaccharide (LPS) was significantly enriched in adenoma compared with control. It was associated with the activation of the nuclear factor-κB
(NF-κB) and a strong pro-inflammatory response28, which led to colorectal adenoma. The ASV assigned as _V. parvula_, one of the biomarkers differentiating healthy controls from adenoma
samples (Fig. 2a), was a major contributor to the ADP-heptose biosynthesis (ranked 9 out of 624 in adenoma patients and ranked 16 in controls, Supplementary Data 13). There are four
rate-limiting enzymes encoded by _hldE_, _rfaD_, _gmhA_, and _gmhB_ in the biosynthesis of ADP-heptose. These four genes were consistently enriched in adenoma compared with control
(Supplementary Table 3). Further, we validated the abundance of these key genes based on qRT-PCR using newly collected samples. Consistent with the PICRUSt2 results, _hldE_ and _rfaD_ genes
were enriched in adenoma compared with control (Fig. 5a), especially that the abundance of _hldE_ gene was significantly increased in adenoma. Moreover, it was worth noting that menaquinone
(vitamin K2) biosynthesis was significantly enriched in cancer compared with adenoma, especially the MK-10 biosynthesis. MK-10 was mainly produced by the ASV assigned as _B. dorei_, one of
the biomarkers between adenoma and cancer (Fig. 2b), and was the 3rd and 4th contributor to MK-10 biosynthesis in adenoma and cancer among all ASVs (Supplementary Data 14). Collectively, the
elevated production of vitamin K2 by microbiota may serve as a response to compensate for the induction of feedback inhibition in colorectal cancer cells29. Furthermore, we found a
significantly increased abundance of _menH_, _menF,_ and _menC_ in CRC samples compared with that of adenoma in pooled data sets by a two-sided blocked Wilcoxon rank-sum test (Supplementary
Table 4). These results were also confirmed by qRT-PCR with our newly-collected samples (Fig. 5b), showing that _menH_ and _menF_ genes were significantly increased in the CRC samples than
those in the adenoma samples. DISCUSSION This study comprehensively assessed the alterations of CRC-associated gut microbiome and the capability of microbial markers for early detection of
CRC at precancerous-stage adenoma. The best performing model achieved a high accuracy (AUC = 0.80) with 11 important features to distinguish colorectal adenoma from non-tumor control (Fig.
2c). Similarly, the AUC of the best model for detecting colorectal adenoma from CRC with 26 important features was 0.89 (Fig. 2d). Through study-to-study transfer validation and LODO
validation across multiple data sets, the important features could overcome technical and geographical discrepancies with an average AUC of 0.76 in the adenoma-control model (Fig. 3a) and
0.89 in the adenoma-cancer model (Fig. 3b). These important features were validated with two additional independent cohorts (Supplementary Fig. 15a, b) and were specific to adenoma against
other microbiome-linked diseases (Supplementary Fig. 16). It has long been reported that fecal bacteria could serve as biomarkers for non-invasive diagnosis of CRC, such as _F. nucleatum_,
_Escherichia coli_, and _Bacteroides fragilis_8,30,31,32. However, large variations existed among studies for these microbial markers17, indicating the necessity of multi-cohort integration
analysis. Two pioneering studies11,14 have performed cross-cohort analyses focusing on distinguishing CRC patients from controls based on WMS data. In contrast, our study aimed at
identifying adenoma-specific microbial markers, because early screening of CRC is of the paramount value for the patients. In Thomas’s work, adenoma-related classifiers showed lower
accuracies in distinguishing adenomas from healthy controls (AUC = 0.54) or CRC (AUC = 0.69)11. One explanation is that the adenoma-associated stool microbiome closely resembles that of the
health status7,11,21. Besides, it is probably also influenced by the limited coverage of taxonomy and the high dependence on reference genomes in WMS taxonomic profiling20,33. WMS data is
well-recognized to possess the advantage of species- and even strain-level resolution. However, the current strategies for characterizing microbial community compositions with WMS are
“closed annotation” that strongly rely on the known reference genome database18,34,35, which is likely missing some species without known genomes or marker genes. It will thus result in
biases in relative abundance estimation. Consequently, in this study, we included fecal 16S rRNA sequencing studies considering that 16S rRNA gene-based profiles are better representations
of the “real community”20. Moreover, considering inconsistent abundance changes among ASVs assigned as the same species, we constructed classifiers at the ASV level to capture the most
informative ASVs that could effectively distinguish patients from controls. The control-CRC model built in this study with 16S rRNA profiling achieved an AUC of 0.93, whose accuracy was
significantly higher than that based on WMS (AUC = 0.84)11,14. Similarly and more importantly, we constructed models using sets of microbial markers that distinguish colorectal adenoma from
controls (AUC = 0.80) and CRC (AUC = 0.89) with high accuracy. These markers were validated for effectiveness via study-to-study transfer validation and LODO validation as well as with
independent cohorts. Furthermore, we confirmed that the identified panel of markers was colorectal adenoma-specific rather than other microbiome-associated diseases, such as IBD and NAFLD
(Supplementary Fig. 16). Overall, all these validations strongly support the robustness of the classifiers and provided evidence that stool-based microbial markers could serve as an
effective non-invasive clinical indicator for colorectal adenoma. Microbial communities varied in both colorectal adenoma and cancer during the progression of CRC. A large-cohort CRC study
revealed distinct stage-specific shifts of microbiome and metabolome and found elevated _Atopobium parvulum_ in adenoma compared to controls15. Notably, we also found that both differential
ASVs and markers for distinguishing adenoma and cancers from healthy controls varied greatly. The ASV assigned as _E. ruminantium_ was the only common adenoma-associated marker while
_Porphyromonas_ sp. _HMSC077F02_, _L. pectinoschiza_, _Hungatella hathewayi WAL-18680_, etc were common cancer-associated biomarkers. _F. nucleatum_, one of the universal biomarkers in our
cancer-control model and the two recent CRC meta-analysis11,14, was neither a differential bacterium nor a biomarker between controls and adenomas. In addition, prior work indicated that the
diagnostic capability of _Fusobacterium_ sp. for colorectal adenoma was inferior to that of strain “_m3_” of the _Lachnoclostridium_ sp.4. These results indicated that the CRC-associated
biomarkers were not effective for the detection of colorectal adenoma and highlighted the importance of adenoma-specific signatures. Additionally, the adenoma-specific markers may contribute
to the early screening and consequently reduce the risk of CRC. What’s more, the combination of the important adenoma-specific markers and FIT improved the classifier’s accuracy (AUC =
0.81) compared to microbial makers (AUC = 0.78) or FIT (AUC = 0.60) alone (Supplementary Fig. 10), indicating that the non-invasive FIT test could be used as complementary tool to gut
microbiota analysis for early screening of adenoma. Recently, a 16S rRNA analysis investigated microbiome dysbiosis in adjacent tissues of colonic cancerous tissue and the identified
signatures could discriminate colorectal adenomas from healthy controls effectively13, though tissue-based markers are invasive and less accessible than stool-based markers. The functional
analysis sheds light on the convoluted underlying mechanisms and would greatly enhance our understanding and interpretation of CRC carcinogenesis (Supplementary Fig. 17). In particular, we
found that the biosynthesis of ADP-heptose and the key gene _hldE_ were significantly enriched in adenoma compared with control. ADP-heptose has been identified as a bacteria-linked
carcinogen36 and the key metabolic intermediate in the biosynthesis of LPS. It is a potent trigger for the activation of NF-κB signaling, which has been shown to promote tumorigenesis37 and
may be critical in perpetuating inflammation38. The increased abundance pattern of ADP-heptose biosynthesis pathway from control to adenoma and to CRC suggests that the elevated activity of
this pathway may be one important factor that induced the sustained aggravation of NF-κB signaling during the development of CRC. Notably, the pathway abundance of ADP-heptose biosynthesis
was significantly increased in adenoma compared to control, while showed no significant enrichment in CRC compared to adenoma. This may suggest that ADP-heptose played a critical role in
adenoma and maintained such a role in CRC progression39. Moreover, a series of vitamin K2 biosynthesis genes, such as _menH_ and _menF_ were also significantly different between adenoma and
cancer. Previous studies indicated that vitamin K2 played important roles in the antitumor effect via cell-cycle arrest, cell differentiation, and cell apoptosis29. Therefore, the increased
production of vitamin K2 may be a compensatory effect of the dysregulated microbiota to survive the tumor microenvironment, which also suggests a potential CRC intervention strategy
targeting vitamin K2 biosynthesis bacteria. Though the main pathways differed between the control-adenoma and the adenoma-CRC models, all these differential microbial pathways could offer
promising perspectives and evidence for intervention and treatment in CRC carcinogenesis. Being mainly a bioinformatics paper, we recognize the weakness of the study in validation, that is,
no intervention study was designed to prove the thesis. To compensate for this weakness, we strived to strengthen the evidence from other perspectives of the study design and provided
different types of validations of the identified microbial biomarkers for adenoma, for the purpose of early detection of CRC. Taken together, through extensive and statistically rigorous
validation, we identified microbial-derived markers for distinguishing adenoma from healthy control and CRC across multiple studies. Independent validation confirmed that the
microbial-derived markers exhibited high accuracy and specificity in detecting adenoma. These microbial-derived markers may contribute to the non-invasive diagnosis of colorectal adenoma and
could be targeted to suppress the CRC carcinogenesis. Furthermore, we proposed that the alteration of microbiome-mediated the ADP-heptose biosynthesis activated inflammation in adenoma
while the disordered microbiome played a compensatory effect via elevated vitamin K2 production in CRC carcinogenesis. METHODS PUBLIC DATA COLLECTION We collected data from published studies
in PubMed.gov containing 16S rRNA sequencing data on patients with CRC, adenomas, and healthy controls. Only four studies with accessible metadata of samples and performance of
high-throughput sequencing targeting the V4 region of the 16S rRNA gene were included in this work. Raw sequencing data of these studies were downloaded using SRA toolkit (V.2.9.1) from
Sequence Read Archive (SRA) and European Nucleotide Archive (ENA) using identifiers: PRJNA389927 for Zeckular et al.12, PRJEB6070 for Zeller et al.21, PRJNA290926 for Baxter et al.27 and
PRJNA362366 for Sze et al.40. Besides, two additional cohorts (Supplementary Table 2) were used as independent cohorts with accession numbers PRJNA53451141 and PRJNA28002642. Sequencing data
of four non-CRC studies were utilized to evaluate the specificity of adenoma features. These four data sets were generated from patients who suffered from diseases other than CRC:
PRJNA8211143, PRJNA54472144, PRJEB2835045, and PRJNA54133246 (Supplementary Table 2). PATIENT RECRUITMENT AND SAMPLE COLLECTION Stool samples were collected from patients with adenoma, CRC,
and healthy controls at Fudan University Shanghai Tumor Center with informed consent. Patient recruitment and sample collection were approved by the Medical Ethics Committee of Fudan
University Shanghai Tumor Center. Written informed consent was obtained from each participant. This study protocol is in agreement with the world medical association declaration of Helsinki
(2008) and the Belmont Report. Patients were recruited for initial diagnosis and had never received any treatment before fecal sample collection. Patients with hereditary CRC syndromes, and
patients with a previous history of CRC were excluded from the study. Based on pathology and colonoscopy results, recruited subjects were classified into three groups: (1) healthy subjects,
namely controls: individuals with colonoscopy negative for tumor, adenoma, or other diseases; (2) patients with adenoma: individuals with colorectal adenoma(s); and (3) patients with CRC:
individuals with newly diagnosed CRC. A total of 94 subjects were initially recruited. Based on inclusion criteria in addition to similar sex, age, and BMI, 43 samples were enrolled: 30
patients with CRC, 6 adenomas, and 7 controls. The stool was collected in fecal collection tubes and was stored at −80 °C. DNA was extracted from fecal samples using Stool Genomic DNA Kit
(CW20925, CWBIO, China) following the manufacturer’s instructions. The patient characteristics for qRT-PCR were summarized in Supplementary Table 5. DATA PREPROCESSING The 16S rRNA
sequencing data were analyzed using QIIME2 (V.2018.11), a plugin-based platform for microbiome analysis47. DADA2 (V.2018.11) software, wrapped in QIIME2, was used to filter out sequencing
reads with quality score _Q_ > 25 and denoise reads into ASVs (i.e., 100% exact sequence match), resulting in feature tables and representative sequences. Taxonomy classification was
assigned based on the naive Bayes classifier using the classify-sklearn package48 against the Silva-132-99 reference sequences. ASVs that could not be precisely annotated to species were
reassigned to ones having the most similar sequences in the same genus (or family) using NCBI Blast. Subsequently, representative sequences were aligned using Fast Fourier Transform (MAFFT,
V.2018.11) in Multiple Alignment and a phylogenetic tree was generated with the Fast-Tree (V.2018.11) plugin. Then, the feature tables were converted to relative abundance tables. A set of
ASVs that were confidently detectable in at least three studies and were present in at least 20% of samples was selected for further analysis. One sample (SRR5184891 in PRJNA362366)
sequenced at insufficient depth was excluded from the analysis. CONFOUNDER ANALYSIS We used ANOVA-like analysis14 to quantify the effect of potential confounding factors and disease status.
The total variance of a given ASV was compared to the variance explained by disease status (control, adenoma, and cancer) and the variance by confounding factors (age, BMI, diabetes,
nonsteroidal anti-inflammatory drug (NSAID), platform, race, sex, and study) akin to a linear model. Variance calculations were performed on ranks to account for non-Gaussian distribution of
microbiome abundance data14. Potential confounding factors with continuous values were transformed into discrete variables either as quartiles or in the case of BMI as groups of lean
(>25), overweight (25–30), and obese (>30) based on conventional cutoffs. META-ANALYSIS OF DIFFERENTIALLY ABUNDANT ASVS The significance of differential abundance was tested on a
single ASV using a two-sided blocked Wilcoxon rank-sum test implemented in the R (V.3.5.2) “coin” package (_P_ values < 0.05 were deemed as significant in all differential analysis).
Confounder with high variance explanation was defined as a block to adjust the batch effects in the differential analysis. Significance was tested against a conditional null distribution
derived from permutations of the observed data. Permutations were performed within “study” to control variations in block size and composition14. For further analysis, we evaluated a
generalization of the (logarithmic) fold change for each ASV. This quantity is widely applied to genomic sequencing data such as RNA sequencing (RNA-seq) and Global run-on sequencing
(GRO-seq) and further improved for better resolution of sparse microbiome profiles49. The generalized fold change was calculated as the averaged difference between predefined quantiles
(ranging from 0.1 to 0.9 in increments of 0.1 in this study) of the logarithmic control and adenoma, and between adenoma and cancer distributions. MODEL CONSTRUCTION AND FEATURES EXTRACTION
Following the differentially abundant ASVs analysis, we built RF models in the scikit-learn (V.0.19.2) package with stratified 10-fold cross-validation to distinguish adenoma from cancer or
control. The features used for model building consist of patient metadata as well as differential ASVs and alpha diversity indices. The alpha diversity indices consisted of Shannon Index,
Simpson Index, and Observed ASVs, while the patient metadata features consisted of age, sex, and BMI. The RF models were built with 501 estimator trees and each tree had 10% of the total
features. And the stratified 10-fold cross-validation was used to configure training and testing data sets. Then an IFE step was used to optimize the performance of subsequent RF models. The
top features from the top-performing model were selected as “important features” and the top microbial features as “biomarkers” (Supplementary Fig. 13). Finally, the AUC, accuracy,
sensitivity, specificity, precision, and F1 score were used to evaluate the performance of the optimized models. MODEL EVALUATION To assess the generalizability of microbial-based adenoma
classifiers across contexts, such as geographic variation and technical differences in microbial data generation and processing over multiple patient populations, both study-to-study
transfer validation and LODO validation were performed. In study-to-study transfer validation, classifiers were trained in one single study and externally assessed on all other studies
(off-diagonal cells in Fig. 3a, b). Meanwhile, we applied a nested cross-validation procedure on the training study to calculate within-study accuracy (diagonal cells in Fig. 3a, b). In LODO
validation, data from one study was set as the testing set, while data from the remaining three studies were pooled as the training set. We applied RF models in study-to-study transfer
validation and LODO validation, the input features were the “important features”. Since multiple studies were involved, variations or batch effects are commonly observed50. To further
improve the model’s ability to process batch effects among studies, fine-tuning model with bagging K-Nearest Neighbors (KNN) was performed in certain cases. KNN is measured by a distance
metric of multiple features to reduce the dependence on the specific value of a feature, which can effectively avoid overfitting51,52. To evaluate whether the important features would
achieve the best performances in study-to-study transfer validation and LODO validation, we constructed models with three different sets of input features, including (1) all ASVs, (2)
differential ASVs and (3) all important features. Then we sought to identify if there was a minimal set of important features that could achieve higher accuracy. A few of the top-ranking
important features were always included in the minimal set as prior. We used the same methods as the study-to-study transfer validation and LODO validation and then calculated the average
AUC of each testing study as each point in Fig. 3c, d. Finally, we compared the predictive values in the testing set across models with different sets of input features. CO-OCCURRENCE AND
CLUSTERING ANALYSIS To construct co-occurrence networks of bacterial communities, network analysis was performed with the relative abundance of differential ASVs using the SparCC algorithm,
which is known for its robustness for compositional data that are often characterized by diversity and sparsity of the members of the community23. Correlation coefficients were estimated as
the average of 50 inference iterations with the default strength threshold. _P_ values were calculated from 1000 bootstrap correlations. Correlation coefficients with _P_ values < 0.05
(defined as significant) and with a magnitude above 0.1 (control versus adenoma) or above 0.3 (adenoma versus cancer) were selected for further visualization in Cytoscape (V.3.8.0). Modular
structure and groups of highly interconnected nodes were analyzed using the MCODE application with standard parameters25. To further analyze the co-occurrence of biomarkers, the relative
abundances of biomarkers were discretized into binary values “positive” or “negative”. A sample was labeled “positive” when the relative abundance of biomarker ASV was above 014. Based on
the binarized markers-by-sample matrix, biomarkers were then clustered using the Jaccard index. Associations between clusters and metadata were calculated in a Cochran–Mantel–Haenszel test,
using “study” as a blocking factor. THE DIAGNOSTIC ABILITY OF FIT FOR COLORECTAL ADENOMA To evaluate the diagnostic ability of traditional non-invasive test, FIT, we collected the publicly
available FIT samples (including 172 control individuals and 198 adenoma patients) from a published study27. We constructed the RF models using important features, FIT or their combination
for differentiating adenoma from control. The parameters of the RF models were the same as described in “Model construction and features extraction” section. ADDITIONAL VALIDATION WITH
INDEPENDENT STUDIES AND NON-CRC DISEASES As an external test, we used additional independent data to validate the performance of the important features to differentiate adenoma from cancer
or control. Since the sequencing data of independent cohorts were not targeting the V4 region (details in Supplementary Table 2), ASVs from this dataset do not match with those of the
discovery dataset. Consequently, we reconstructed RF models with the same hyperparameters as the discovery RF models. Considering the limited resolution of the 16S rRNA gene and incomplete
reference database53, not all ASVs could be assigned at the species level. Thus all ASVs with the same taxonomy assignments (at genus level), as well as patient metadata (only used ASVs for
validation cohort2 for lack of the patient metadata), were used as the input features. To assess the specificity of the important features for colorectal adenoma, we examined the
performances of these features in five non-CRC diseases (CD, UC, IBS, NAFLD, T2D)43,44,45,46. For each disease, RF models were constructed to discriminate the non-CRC diseases from controls.
Similar to the validation with independent studies above, the input features were the ASVs with the same taxonomy assignments (at genus level) as the input features as well as patient
metadata (only used ASVs, age, and sex as input features for CD and UC samples as BMI is not available) (Supplementary Data 15). FUNCTIONAL PROFILE ANALYSIS The functions of the gut
microbiome were inferred from 16S rRNA sequences with PICRUSt2 (V.2.0.3-b) as previously published54. Functional profiles that have more than 80% samples with relative abundance < 1 ×
10−5 and show up in less than three of the studies were removed. The differential analysis and generalized fold change calculations were performed on pathway profiles in the same way as on
ASVs profiles (see Methods data preprocessing). Then, we evaluated the contribution of each ASV to overall differential pathways. The contribution was defined as the ratio of one ASV
functional abundance to the total functional abundance of all ASVs in a given pathway. QRT-PCR VALIDATION To quantify the abundance and expression of genes from two selected biosynthesis,
qRT-PCR analysis was performed in triplicates on 7 healthy controls, 6 adenoma, and 30 CRC samples. For these samples, the gDNA was extracted with the FecalGen DNA Kit (Cat# e9604) according
to the manufacturer’s instructions. We used the primes in Supplementary Table 6 for candidate genes; standard primers F515 and R806 for 16S rRNA. To perform the qRT-PCR reaction, the final
primer concentration was diluted to 0.5 μM including 5 ng of gDNA in a 20 μl final reaction volume with the SYBR Green qPCR Mix (Thermo Fisher Scientific). The adopted qRT-PCR program was as
follows: pre-denaturation at 95 °C for 10 min; denaturation at 95 °C for 15 s for 40 cycles; annealing at 60 °C for 60 s followed by melt curve analysis14. The qRT-PCR analysis was to
calculate 2−ΔΔCt values between candidate genes and 16S Ct values. The significance of the comparison between adenoma and control or CRC samples was tested by a two-sided Wilcoxon rank-sum
test (_P_ < 0.05). REPORTING SUMMARY Further information on research design is available in the Nature Research Reporting Summary linked to this article. DATA AVAILABILITY The raw 16S
rRNA gene sequencing data are available from the Sequence Read Archive (SRA) (https://www.ncbi.nlm.nih.gov/sra) and European Nucleotide Archive (ENA) (https://www.ncbi.nlm.nih.gov/), with
project ID: PRJNA389927, PRJEB6070, PRJNA290926, PRJNA362366, PRJNA534511, PRJNA280026, PRJEB28350, PRJNA544721, PRJNA541332, and PRJNA82111. The remaining data are available within the
Article, Supplementary Information, or available from the authors upon request. Source data are provided with this paper. CODE AVAILABILITY The codes and scripts are available at
https://github.com/Yuanqiwu/CRC (https://doi.org/10.5281/zenodo.4739990)55. The customized code was written in Python 3.7.1 and R 3.5.2. REFERENCES * Bray, F. et al. Global cancer statistics
2018: GLOBOCAN estimates of incidence and mortality worldwide for 36 cancers in 185 countries. _CA Cancer J. Clin._ 68, 394–424 (2018). Article PubMed Google Scholar * Wong, S. H. &
Yu, J. Gut microbiota in colorectal cancer: mechanisms of action and clinical applications. _Nat. Rev. Gastroenterol. Hepatol._ 16, 690–704 (2019). Article CAS PubMed Google Scholar *
Mariotto, A. B., Yabroff, K. R., Shao, Y., Feuer, E. J. & Brown, M. L. Projections of the cost of cancer care in the United States: 2010–2020. _J. Natl Cancer Inst._ 103, 117–128 (2011).
Article PubMed PubMed Central Google Scholar * Liang, J. Q. et al. A novel faecal _Lachnoclostridium_ marker for the non-invasive diagnosis of colorectal adenoma and cancer. _Gut_ 69,
1248–1257 (2020). Article CAS PubMed Google Scholar * Ren, Z. G. et al. Gut microbiome analysis as a tool towards targeted non-invasive biomarkers for early hepatocellular carcinoma.
_Gut_ 68, 1014–1023 (2019). Article CAS PubMed Google Scholar * Jiao, N. et al. Suppressed hepatic bile acid signaling despite elevated production of primary and secondary bile acids in
Nafld. _Gastroenterology_ 152, S1068 (2017). Article Google Scholar * Feng, Q. et al. Gut microbiome development along the colorectal adenoma-carcinoma sequence. _Nat. Commun._ 6, 6528
(2015). Article ADS CAS PubMed Google Scholar * Yu, J. et al. Metagenomic analysis of faecal microbiome as a tool towards targeted non-invasive biomarkers for colorectal cancer. _Gut_
66, 70–78 (2017). Article CAS PubMed Google Scholar * Coker, O. O. et al. Enteric fungal microbiota dysbiosis and ecological alterations in colorectal cancer. _Gut_ 68, 654–662 (2019).
Article CAS PubMed Google Scholar * Nakatsu, G. et al. Alterations in enteric virome are associated with colorectal cancer and survival outcomes. _Gastroenterology_ 155, 529–541 (2018).
Article PubMed Google Scholar * Thomas, A. M. et al. Metagenomic analysis of colorectal cancer datasets identifies cross-cohort microbial diagnostic signatures and a link with choline
degradation. _Nat. Med._ 25, 667–678 (2019). Article CAS PubMed PubMed Central Google Scholar * Zackular, J. P., Rogers, M. A., Ruffin, M. T. T. & Schloss, P. D. The human gut
microbiome as a screening tool for colorectal cancer. _Cancer Prev. Res._ 7, 1112 (2014). Article CAS Google Scholar * Mo, Z. et al. Meta-analysis of 16S rRNA microbial data identified
distinctive and predictive microbiota dysbiosis in colorectal carcinoma adjacent tissue. _mSystems_ 5, e00138–00120 (2020). Article CAS PubMed PubMed Central Google Scholar * Wirbel, J.
et al. Meta-analysis of fecal metagenomes reveals global microbial signatures that are specific for colorectal cancer. _Nat. Med._ 25, 679–689 (2019). Article CAS PubMed PubMed Central
Google Scholar * Yachida, S. et al. Metagenomic and metabolomic analyses reveal distinct stage-specific phenotypes of the gut microbiota in colorectal cancer. _Nat. Med_. 25, 968–976
(2019). Article CAS PubMed Google Scholar * Walters, W. A., Xu, Z. & Knight, R. Meta-analyses of human gut microbes associated with obesity and IBD. _FEBS Lett._ 588, 4223 (2014).
Article CAS PubMed PubMed Central Google Scholar * Duvallet, C., Gibbons, S. M., Gurry, T., Irizarry, R. A. & Alm, E. J. Meta-analysis of gut microbiome studies identifies
disease-specific and shared responses. _Nat. Commun._ 8, 1784 (2017). Article ADS PubMed PubMed Central Google Scholar * Segata, N. et al. Metagenomic microbial community profiling
using unique clade-specific marker genes. _Nat. Methods_ 9, 811–814 (2012). Article CAS PubMed PubMed Central Google Scholar * Ternes, D. et al. Microbiome in colorectal cancer: how to
get from meta-omics to mechanism? _Trends Microbiol._ 28, 401–423 (2020). Article CAS PubMed Google Scholar * Rausch, P. et al. Comparative analysis of amplicon and metagenomic
sequencing methods reveals key features in the evolution of animal metaorganisms. _Microbiome_ 7, 133 (2019). Article PubMed PubMed Central Google Scholar * Zeller, G. et al. Potential
of fecal microbiota for early-stage detection of colorectal cancer. _Mol. Syst. Biol._ 10, 766 (2014). Article PubMed PubMed Central Google Scholar * Wu, J., Li, Q. & Fu, X.
_Fusobacterium nucleatum_ contributes to the carcinogenesis of colorectal cancer by inducing inflammation and suppressing host immunity. _Transl. Oncol._ 12, 846–851 (2019). Article PubMed
PubMed Central Google Scholar * Friedman, J. & Alm, E. J. Inferring correlation networks from genomic survey data. _PLoS Comput. Biol._ 8, e1002687 (2012). Article ADS CAS PubMed
PubMed Central Google Scholar * Ai, D. M. et al. Identifying gut microbiota associated with colorectal cancer using a zero-inflated lognormal model. _Front. Microbiol._ 10, 826 (2019).
Article PubMed PubMed Central Google Scholar * Bader, G. D. & Hogue, C. W. An automated method for finding molecular complexes in large protein interaction networks. _BMC
Bioinformatics_ 4, 2 (2003). Article PubMed PubMed Central Google Scholar * Ridlon, J. M. et al. Clostridium scindens: a human gut microbe with a high potential to convert
glucocorticoids into androgens. _J. Lipid Res._ 54, 2437–2449 (2013). Article ADS CAS PubMed PubMed Central Google Scholar * Baxter, N. T., Koumpouras, C. C., Rogers, M. A., Ruffin, M.
T. T. & Schloss, P. D. DNA from fecal immunochemical test can replace stool for detection of colonic lesions using a microbiota-based model. _Microbiome_ 4, 59 (2016). Article PubMed
PubMed Central Google Scholar * Cong, Y. ALPK1: a pattern recognition receptor for bacterial ADP-heptose. _Precis. Clin. Med._ 1, 57–59 (2018). Article PubMed PubMed Central Google
Scholar * Kawakita, H. et al. Growth inhibitory effects of vitamin K2 on colon cancer cell lines via different types of cell death including autophagy and apoptosis. _Int. J. Mol. Med._ 23,
709–716 (2009). CAS PubMed Google Scholar * Kostic, A. D. et al. Genomic analysis identifies association of _Fusobacterium_ with colorectal carcinoma. _Genome Res._ 22, 292–298 (2012).
Article CAS PubMed PubMed Central Google Scholar * Wu, S. et al. A human colonic commensal promotes colon tumorigenesis via activation of T helper type 17 T cell responses. _Nat. Med._
15, 1016–1022 (2009). Article CAS PubMed PubMed Central Google Scholar * Gao, R. et al. Dysbiosis signature of mycobiota in colon polyp and colorectal cancer. _Eur. J. Clin. Microbiol.
Infect. Dis._ 36, 2457–2468 (2017). Article CAS PubMed Google Scholar * Laudadio, I., Fulci, V., Stronati, L. & Carissimi, C. Next-generation metagenomics: methodological challenges
and opportunities. _OMICS_ 23, 327–333 (2019). Article CAS PubMed Google Scholar * Milanese, A. et al. Microbial abundance, activity and population genomic profiling with mOTUs2. _Nat.
Commun._ 10, 1014 (2019). Article ADS PubMed PubMed Central Google Scholar * Wood, D. E. & Salzberg, S. L. Kraken: ultrafast metagenomic sequence classification using exact
alignments. _Genome Biol._ 15, R46 (2014). Article PubMed PubMed Central Google Scholar * Bauer, M. et al. The ALPK1/TIFA/NF-KappaB axis links a bacterial carcinogen to R-loop-induced
replication stress. _Nat. Commun._ 11, 5117 (2020). Article ADS CAS PubMed PubMed Central Google Scholar * Koliaraki, V., Pasparakis, M. & Kollias, G. IKKbeta in intestinal
mesenchymal cells promotes initiation of colitis-associated cancer. _J. Exp. Med._ 212, 2235–2251 (2015). Article CAS PubMed PubMed Central Google Scholar * Zhou, P. et al. α-kinase 1
is a cytosolic innate immune receptor for bacterial ADP-heptose. _Nature_ 561, 122–126 (2018). Article ADS CAS PubMed Google Scholar * Patel, M., Horgan, P. G., McMillan, D. C. &
Edwards, J. NF-KappaB pathways in the development and progression of colorectal cancer. _Transl. Res._ 197, 43–56 (2018). Article CAS PubMed Google Scholar * Sze, M. A., Baxter, N. T.,
Ruffin, M. T. T., Rogers, M. A. M. & Schloss, P. D. Normalization of the microbiota in patients after treatment for colonic lesions. _Microbiome_ 5, 150 (2017). Article PubMed PubMed
Central Google Scholar * Dadkhah, E. et al. Gut microbiome identifies risk for colorectal polyps. _BMJ Open Gastroenterol._ 6, e000297 (2019). Article PubMed PubMed Central Google
Scholar * Nakatsu, G. et al. Gut mucosal microbiome across stages of colorectal carcinogenesis. _Nat. Commun._ 6, 8727 (2015). Article ADS CAS PubMed Google Scholar * Morgan, X. C. et
al. Dysfunction of the intestinal microbiome in inflammatory bowel disease and treatment. _Genome Biol._ 13, R79 (2012). Article CAS PubMed PubMed Central Google Scholar * Liu, T. et
al. Microbial and metabolomic profiles in correlation with depression and anxiety co-morbidities in diarrhoea-predominant IBS patients. _BMC Microbiol._ 20, 168 (2020). Article PubMed
PubMed Central Google Scholar * Caussy, C. et al. A gut microbiome signature for cirrhosis due to nonalcoholic fatty liver disease. _Nat. Commun._ 10, 1406 (2019). Article ADS PubMed
PubMed Central Google Scholar * Diener, C. et al. Progressive shifts in the gut microbiome reflect prediabetes and diabetes development in a treatment-naive Mexican cohort. _Front.
Endocrinol_. 11, 602326 (2021). * Bolyen, E. et al. Reproducible, interactive, scalable and extensible microbiome data science using QIIME 2. _Nat. Biotechnol._ 37, 852–857 (2019). Article
CAS PubMed PubMed Central Google Scholar * Pedregosa, F. et al. Scikit-learn: machine learning in python. _J. Mach. Learn. Res._ 12, 2825–2830 (2011). MathSciNet Google Scholar * Feng,
J. et al. GFOLD: a generalized fold change for ranking differentially expressed genes from RNA-seq data. _Bioinformatics_ 28, 2782–2788 (2012). Article CAS PubMed Google Scholar *
Gibbons, S. M., Duvallet, C. & Alm, E. J. Correcting for batch effects in case-control microbiome studies. _PLoS Comput. Biol._ 14, e1006102 (2018). Article ADS PubMed PubMed Central
Google Scholar * Altman, N. S. An introduction to Kernel and Nearest-Neighbor nonparametric regression. _Am. Stat._ 46, 175–185 (1992). Article MathSciNet Google Scholar * Cover, T.
& Hart, P. Nearest neighbor pattern classification. _IEEE Trans. Inf. Theory_ 13, 21–27 (1967). Article Google Scholar * Straub, D. et al. Interpretations of environmental microbial
community studies are biased by the selected 16S rRNA (gene) amplicon sequencing pipeline. _Front. Microbiol._ 11, 550420 (2020). Article PubMed PubMed Central Google Scholar * Douglas,
G. M. et al. PICRUSt2: an improved and extensible approach for metagenome inference. Preprint at https://www.biorxiv.org/content/10.1101/672295v1 (2020). * Wu, Y. et al. Identification of
microbial markers across populations in early detection of colorectal cancer. _Zenodo._ https://doi.org/10.5281/zenodo.4739990 (2021). Download references ACKNOWLEDGEMENTS This work was
supported by National Key R&D Program of China, No. 2017YFC1308800 (to P.L.), Guangdong Province “Pearl River Talent Plan” Innovation and Entrepreneurship Team Project 2019ZT08Y464 (to
L.Z.), National Natural Science Foundation of China 81774152 (to R.Z.), 81770571 (to L.Z.), 31900129 (to N.-N.L.), 82000536 (to N.J.), National Postdoctoral Program for Innovative Talents of
China BX20190393 (to N.J.), China Postdoctoral Science Foundation 2019M651568 (to D.W.), 2019M663252 (to N.J.), Natural Science Foundation of Shanghai 16ZR1449800 (to R.Z.), the National
Key Clinical Discipline of China, the Program for Young Eastern Scholar at Shanghai Institutions of Higher Learning QD2018016 (to N.-N.L.), Fundamental Research Funds for the Central
Universities 19ykzd01 (to L.Z.) and 20kypy07 (to N.J.), Shanghai Pujiang Program 18PJ1406600 (to N.-N.L.), and Innovative research team of high-level local universities in Shanghai, Medicine
and Engineering Interdisciplinary Research Fund of Shanghai Jiao Tong Univesity YG2019QNB39 (to N.-N.L.). The funders had no role in study design, data collection, and analysis, decision to
publish, or preparation of the manuscript. AUTHOR INFORMATION Author notes * These authors contributed equally: Yuanqi Wu, Na Jiao. * These authors jointly supervised this work: Ruixin Zhu,
Chuan Tian, Ning-Ning Liu, Lixin Zhu. AUTHORS AND AFFILIATIONS * Department of Gastroenterology, The Shanghai Tenth People’s Hospital, Department of Bioinformatics, School of Life Sciences
and Technology, Tongji University, Shanghai, People’s Republic of China Yuanqi Wu, Ruixin Zhu, Dingfeng Wu, Sa Fang, Liwen Tao & Chuan Tian * Guangdong Institute of Gastroenterology,
Guangdong Provincial Key Laboratory of Colorectal and Pelvic Floor Diseases, Department of Colorectal Surgery, The Sixth Affiliated Hospital, Sun Yat-sen University, Guangzhou, People’s
Republic of China Na Jiao, Yichen Li, Sijing Cheng, Xiaosheng He, Ping Lan & Lixin Zhu * Department of Biomedical Informatics, Harvard Medical School, Boston, MA, USA Yida Zhang * State
Key Laboratory of Oncogenes and Related Genes, Center for Single-Cell Omics, School of Public Health, Shanghai Jiao Tong University School of Medicine, Shanghai, People’s Republic of China
An-Jun Wang & Ning-Ning Liu * School of Medicine, Sun Yat-sen University, Shenzhen, People’s Republic of China Sijing Cheng & Ping Lan * Genome, Environment and Microbiome Community
of Excellence, The State University of New York at Buffalo, Buffalo, NY, USA Lixin Zhu Authors * Yuanqi Wu View author publications You can also search for this author inPubMed Google
Scholar * Na Jiao View author publications You can also search for this author inPubMed Google Scholar * Ruixin Zhu View author publications You can also search for this author inPubMed
Google Scholar * Yida Zhang View author publications You can also search for this author inPubMed Google Scholar * Dingfeng Wu View author publications You can also search for this author
inPubMed Google Scholar * An-Jun Wang View author publications You can also search for this author inPubMed Google Scholar * Sa Fang View author publications You can also search for this
author inPubMed Google Scholar * Liwen Tao View author publications You can also search for this author inPubMed Google Scholar * Yichen Li View author publications You can also search for
this author inPubMed Google Scholar * Sijing Cheng View author publications You can also search for this author inPubMed Google Scholar * Xiaosheng He View author publications You can also
search for this author inPubMed Google Scholar * Ping Lan View author publications You can also search for this author inPubMed Google Scholar * Chuan Tian View author publications You can
also search for this author inPubMed Google Scholar * Ning-Ning Liu View author publications You can also search for this author inPubMed Google Scholar * Lixin Zhu View author publications
You can also search for this author inPubMed Google Scholar CONTRIBUTIONS L.Z., R.Z., N.-N.L., and C.T. conceived and designed the project. Y.W. and N.J. drafted the manuscript. R.Z., Y.Z.,
D.W., A.-J.W., S.F., W.G., Y.L., S.C., X.H., P.L., C.T., N.-N.L. and L.Z. revised the manuscript. All authors read and approved the final manuscript. CORRESPONDING AUTHORS Correspondence to
Ruixin Zhu, Chuan Tian, Ning-Ning Liu or Lixin Zhu. ETHICS DECLARATIONS COMPETING INTERESTS The authors declare no competing interests. ADDITIONAL INFORMATION PEER REVIEW INFORMATION _Nature
Communications_ thanks Jun Yu and the other, anonymous reviewers for their contribution to the peer review of this work. PUBLISHER’S NOTE Springer Nature remains neutral with regard to
jurisdictional claims in published maps and institutional affiliations. SUPPLEMENTARY INFORMATION SUPPLEMENTARY INFORMATION DESCRIPTIONS OF ADDITIONAL SUPPLEMENTARY FILES SUPPLEMENTARY DATA
1 SUPPLEMENTARY DATA 2 SUPPLEMENTARY DATA 3 SUPPLEMENTARY DATA 4 SUPPLEMENTARY DATA 5 SUPPLEMENTARY DATA 6 SUPPLEMENTARY DATA 7 SUPPLEMENTARY DATA 8 SUPPLEMENTARY DATA 9 SUPPLEMENTARY DATA
10 SUPPLEMENTARY DATA 11 SUPPLEMENTARY DATA 12 SUPPLEMENTARY DATA 13 SUPPLEMENTARY DATA 14 SUPPLEMENTARY DATA 15 REPORTING SUMMARY SOURCE DATA SOURCE DATA RIGHTS AND PERMISSIONS OPEN ACCESS
This article is licensed under a Creative Commons Attribution 4.0 International License, which permits use, sharing, adaptation, distribution and reproduction in any medium or format, as
long as you give appropriate credit to the original author(s) and the source, provide a link to the Creative Commons license, and indicate if changes were made. The images or other third
party material in this article are included in the article’s Creative Commons license, unless indicated otherwise in a credit line to the material. If material is not included in the
article’s Creative Commons license and your intended use is not permitted by statutory regulation or exceeds the permitted use, you will need to obtain permission directly from the copyright
holder. To view a copy of this license, visit http://creativecommons.org/licenses/by/4.0/. Reprints and permissions ABOUT THIS ARTICLE CITE THIS ARTICLE Wu, Y., Jiao, N., Zhu, R. _et al._
Identification of microbial markers across populations in early detection of colorectal cancer. _Nat Commun_ 12, 3063 (2021). https://doi.org/10.1038/s41467-021-23265-y Download citation *
Received: 05 September 2020 * Accepted: 20 April 2021 * Published: 24 May 2021 * DOI: https://doi.org/10.1038/s41467-021-23265-y SHARE THIS ARTICLE Anyone you share the following link with
will be able to read this content: Get shareable link Sorry, a shareable link is not currently available for this article. Copy to clipboard Provided by the Springer Nature SharedIt
content-sharing initiative