- Select a language for the TTS:
- UK English Female
- UK English Male
- US English Female
- US English Male
- Australian Female
- Australian Male
- Language selected: (auto detect) - EN
Play all audios:
ABSTRACT Electroencephalogram microstates are recurrent scalp potential configurations that remain stable for around 90 ms. The dynamics of two of the four canonical classes of microstates,
commonly labeled as C and D, have been suggested as a potential endophenotype for schizophrenia. For endophenotypes, unaffected relatives of patients must show abnormalities compared to
controls. Here, we examined microstate dynamics in resting-state recordings of unaffected siblings of patients with schizophrenia, patients with schizophrenia, healthy controls, and patients
with first episodes of psychosis (FEP). Patients with schizophrenia and their siblings showed increased presence of microstate class C and decreased presence of microstate class D compared
to controls. No difference was found between FEP and chronic patients. Our findings suggest that the dynamics of microstate classes C and D are a candidate endophenotype for schizophrenia.
SIMILAR CONTENT BEING VIEWED BY OTHERS EEG MICROSTATES AS BIOMARKER FOR PSYCHOSIS IN ULTRA-HIGH-RISK PATIENTS Article Open access 24 August 2020 ABNORMALITIES IN ELECTROENCEPHALOGRAPHIC
MICROSTATES ARE STATE AND TRAIT MARKERS OF MAJOR DEPRESSIVE DISORDER Article 26 June 2020 REDUCED TEMPORAL VARIABILITY OF CORTICAL EXCITATION/INHIBITION RATIO IN SCHIZOPHRENIA Article Open
access 18 February 2025 INTRODUCTION Schizophrenia is a heterogeneous disease strongly determined by genetics. However, no strong genetic correlates have been found yet1,2. For this reason,
endophenotypes are of crucial interest. Endophenotypes are associated with the illness, state-independent, co-segregate within families, and found in unaffected relatives of individuals with
the disorder at a higher prevalence than in the general population3. Abnormal temporal dynamics of electroencephalogram (EEG) microstates were proposed as an endophenotype for
schizophrenia4,5,6. Microstates are global patterns of scalp potential topographies that remain quasi-stable for around 60–120 ms before changing to a different topography that remains
quasi-stable again, suggesting semi-simultaneity of activity of large-scale brain networks7. EEG microstates are highly reproducible, both within and across participants8. This allows the
use of clustering algorithms to group microstates into a finite set of classes based on their topographical similarity9,10. Even though there is still no general consensus on how to
determine the optimal number of microstate classes5,10,11,12,13 and the optimal number of classes of microstates may depend on the dataset analyzed13,14, in clinical research, usually, four
classes of microstates, labeled A, B, C, and D, are used15 based on pioneering work16,17,18. These four dominant classes of microstates are consistently observed in resting-state EEG
(independently of the number of electrodes, and group of participants), explaining 65–84% of the global variance of the data5. Here, we used these four canonical classes of microstates
because this allows comparison between studies. Several studies have attempted to identify the brain sources underlying these classes of microstates13,16,19,20,21,22. A direct comparison of
the findings is difficult due to the differences in data acquisition and processing as well as the number of microstate classes used and the way the microstates analyses were performed.
Nonetheless, these studies indicate that EEG microstates are closely related to resting-state networks (RSNs) commonly found in resting-state functional magnetic resonance imaging (fMRI)
despite the different time resolutions of the two modalities (see5 for a review). Among the above-mentioned studies, the one by Britz et al.16 is usually referred to when discussing fMRI
correlates of EEG microstates since it used an approach more closely related to the conventional EEG microstate analysis. Britz et al. found that microstate class A was associated with the
auditory RSN, microstate class B with the visual RSN, microstate class C with the salience RSN, and microstate class D with the attention RSN. Similar results were found using source
localization of the EEG microstate classes13, providing further evidence for these associations. However, since both fMRI RSNs and EEG microstates are still lacking a full understanding of
their significance in terms of the functional organization of brain networks, one should be cautious when interpreting these associations. In schizophrenia research, numerous studies have
reported abnormalities in the temporal dynamics of EEG microstates measured in patients with schizophrenia compared with controls4,5. A meta-analysis comprising seven studies from 1999 to
201515 revealed that microstate class C occurred more frequently and for longer durations in patients than in controls, whereas microstate class D occurred less frequently and for shorter
durations. Microstate class B was shorter in patients than controls, but the effect was not significant after correction for multiple comparisons. Similar abnormalities were also observed in
adolescents with 22q11.2 deletion syndrome, a population that has a 30% risk of developing psychosis6,23. These results have prompted researchers to suggest that the abnormal EEG
microstates dynamics may be an endophenotype for schizophrenia6. For an endophenotype, it is important that the siblings of the patients also show abnormal patterns. No such study exists for
microstates. Here, we analyze the microstates dynamics in unaffected siblings of patients with schizophrenia, patients with schizophrenia, and healthy controls. To preface our results,
siblings show abnormalities in microstate classes C and D, similar to patients. Surprisingly, siblings also show increased presence of microstate class B compared with patients. We interpret
this increased presence of microstate class B as a compensation signal, which might prevent unaffected siblings to develop the disorder even if there is a genetic predisposition. In a
second study, we investigate whether patients with a first episode of psychosis (FEP) show similar microstates dynamics as chronic patients with schizophrenia or have the compensation signal
as the siblings (i.e., increased presence of microstate class B), since the disorder has not fully blown. Moreover, we test FEP three times throughout 1 year to assess whether the
microstates dynamics change with the progression on the disorder. Finally, we perform a meta-analysis over studies investigating the EEG microstates dynamics in the schizophrenia spectrum to
provide an up-to-date estimate of the overall effect sizes of microstate anomalies in schizophrenia. RESULTS STUDY 1 We examined 5 min resting-state EEG data of 101 patients with
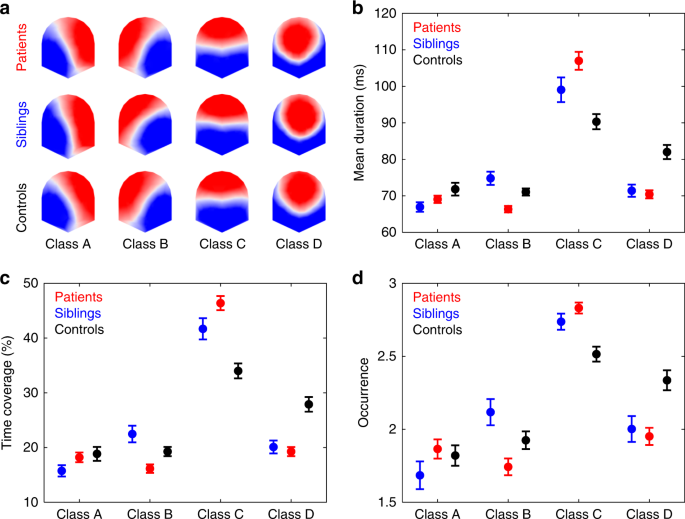
schizophrenia, 43 siblings of patients with schizophrenia, and 75 healthy controls, and we estimated the dynamics of the four canonical EEG microstate classes using Cartool24. The four
microstate classes for patients, siblings, and controls are shown in Fig. 1a. The four microstate classes across participants explained 80.33%, 82.80%, and 78.25% of the global variance in
the patients, siblings, and control group, respectively. In each of the three groups, the four microstates resembled the four class model maps consistently identified in the literature5: two
microstate classes (A and B) with diagonal axis orientations of the topographic map field, one class (C) with anterior–posterior orientation, and one class (D) with a fronto-central extreme
location. For each participant, three per class microstate parameters were computed: mean duration, time coverage, and frequency of occurrence (occurrence). Mean duration (in ms) is the
average time that a given microstate was uninterruptedly present. Time coverage (in %) is the percentage of the total time spent in a given microstate. Occurrence is the mean number of times
a given microstate is occurring per second. Group average statistics are depicted in Fig. 1b–d. For patients vs. controls, three-way repeated measures (rm) ANOVAs showed nonsignificant
Gender × Microstate Class × Group interaction for mean duration (_F_(3,513) = 1.653, _p_ = 0.176, _η_2 = 0.007, 90% CI [<0.001, 0.023]), time of coverage (_F_(3,513)=2.063, _p_ = 0.104,
_η_2 = 0.010, 90% CI [<0.001, 0.027]), and occurrence (_F_(3,513) = 1.136, _p_ = 0.334, _η_2 = 0.005, 90% CI [<0.001, 0.018]). The analyses also yielded significant Microstate Class ×
Group interaction effects for mean duration (_F_(3,513) = 16.246, _p_ = 4.219e − 10, _η_2 = 0.071, 90% CI [0.048, 0.123]), time of coverage (_F_(3,513) = 17.458, _p_ = 8.316e − 11, _η_2 =
0.086, 90% CI [0.053, 0.130]), and occurrence (_F_(3,513) = 8.477, _p_ = 1.664e − 5, _η_2 = 0.035, 90% CI [0.019, 0.076]). These interactions indicate that group differences depend on the
microstate class. Post hoc pairwise group comparisons (Table 1) showed that patients had decreased mean duration of microstate class B compared with controls. For microstate class C,
patients had increased values compared with controls for all the computed microstate parameters. While for microstate class D, patients had decreased values compared with controls for all
computed microstates parameters. No statistically significant group differences were found for microstate class A. For siblings vs. controls, two-way rm-ANOVAs yielded significant Microstate
Class × Group interaction effects duration (_F_(3,348) = 8.061, _p_ = 3.310e − 5, _η_2 = 0.041, 90% CI [0.025, 0.105]), time of coverage (_F_(3,348) = 9.073, _p_ = 8.472e − 6, _η_2 = 0.048,
90% CI [0.030, 0.114]), and occurrence (_F_(3,348) = 6.938, _p_ = 1.511e − 4, _η_2 = 0.031, 90% CI [0.019, 0.094]). Post hoc pairwise group comparisons (Table 2) showed that for microstate
class C, siblings had increased time coverage and occurrence compared with controls. For microstate class D, siblings had decreased values compared with controls for all computed microstates
parameters. Regarding patients vs. siblings comparisons, since 32 out of the 43 siblings were each a sibling of a patient in the current study (referred to as siblings_32 and patients_32,
respectively), we paired these 32 patients to their siblings and compared their difference score (Δ) for each microstate parameter and class against 0 with one sample _t_-tests. Results
revealed that siblings_32 had a longer mean duration of microstate class B than their paired patients_32 (Δ = −7.21 ± 12.50 ms; Table 3 and Supplementary Table 3). The mean duration of
microstate class B and the occurrence of microstate class C of patients_32 correlated with the mean duration of microstate class B and the occurrence of microstate class C in their paired
siblings_32 (Supplementary Table 4). However, the correlations were not significant after correction for multiple comparisons (mean duration of microstate class B: _r_(30) = 0.360, _p_ =
0.043, _p_holm = 0.473; occurrence of microstate class C: _r_(30) = 0.430, _p_ = 0.014, _p_holm = 0.168). We also compared the microstates dynamics of all patients compared with all siblings
(Supplementary Table 5). Results indicated increased mean duration, time coverage, and occurrence of microstate class B in siblings compared with patients. Similar results were found
comparing the microstate dynamics of patients without siblings in the current study (_n_ = 69) against all siblings (Supplementary Table S6). We correlated the values of the computed
microstate parameters of patients with patients’ medication intake (chlorpromazine (CPZ) equivalent), Scales for the Assessment of Negative Symptoms (SANS) and Scales for the Assessment of
Positive Symptoms (SAPS) scores, and illness duration (Supplementary Table S7). CPZ equivalents correlated with the occurrence of microstate class C, but the association was not significant
after correcting for multiple comparisons (_r_(86) = 0.236, _p_ = 0.027, _p_holm = 0.324). STUDY 2 We examined 5 min resting-state EEG data of 22 FEP and 22 chronic patients with
schizophrenia (Patients_22; selected pseudo-randomly from our pool of 101 chronic patients with schizophrenia (see “Study 1”) to match the 22 FEP as closely as possible, regarding to gender,
age, and education). The microstates analysis was the same as in “Study 1”. The four microstate classes for the FEP group are shown in Fig. 2a. The four microstate classes explained 73.97%
of the global variance across participants. The lower percentage of explained variance compared with patients, siblings, controls (“Study 1”), though in the normal range reported in the
literature (65–84%5), might be due to the diverse diagnosis of the FEP group (Supplementary Table 12). Similarly to patients, siblings, and controls (Fig. 1a), the four microstates resembled
the four class model maps consistently identified in the literature. We found no statistically significant differences between the FEP and Patients_22 groups for any of the computed
microstates parameters. Two-way rm-ANOVAs yielded nonsignificant group (FEP and Patients_22) × microstate class (A, B, C, and D) interactions for mean duration (_F_(3,126) = 0.821, _p_ =
0.485, _η_2 = 0.011, 90% CI [<0.001, 0.054]), time of coverage (_F_(3,126) = 0.633, _p_ = 0.595, _η_2 = 0.007, 90% CI [<0.001, 0.042]), and occurrence (_F_(3,126) = 0.860, _p_ = 0.464,
_η_2 = 0.009, 90% CI [<0.001, 0.056]), as well as nonsignificant group differences for mean duration (_F_(1,42) = 1.819, _p_ = 0.185, _η_2 = 0.042, 90% CI [<0.001, 0.170]), time of
coverage (_F_(1,42) = 0.051, _p_ = 0.823, _η_2 = 0.001, 90% CI [<0.001, 0.055]), and occurrence (_F_(1,42) = 0.484, _p_ = 0.490, _η_2 = 0.011, 90% CI [<0.001, 0.110]). Since null
results are relevant to the overall interpretation of the results, we conducted two additional analyses to evaluate the sensitivity of our study and whether there were supporting evidence
for the null hypotheses. First, we conducted a sensitivity analysis with the program G*Power25 to compute the interaction and main effect of group effect sizes that we can detect with a
power of 80%, given 22 participants in each of the two groups and four microstate classes. The analysis revealed that we could detect interaction effects and main effects of group with main
effect sizes with _η_2 of 0.068 and 0.026, which are medium and small effect sizes according to Cohen26. Second, we examined the data by estimating Bayes factors using Bayesian information
criteria27, comparing the fit of the data under the main effects model and the interaction model for each of the computed microstate parameters. JZS Bayes factor ANOVAs28 with default prior
scales revealed that the main effects models were preferred to the interaction model by Bayes factors of 5.545, 6.609, and 6.236, for mean duration, time of coverage, and occurrence,
respectively. In other words, the data provided positive evidence against the hypotheses that Group and Microstate Class interact in any of the computed microstates parameters. We further
compared the main effects models and models without the main effect of Group. Results show that models without the main effect of Group were preferred to the main effects models by Bayes
factors of 4.129, 5.444, and 3.841, for mean duration, time of coverage, and occurrence, respectively. We correlated the values of the computed microstate parameters in FEP with FEP’s
medication intake (CPZ equivalent), SANS and SAPS scores, and illness duration (Supplementary Table 10). We found that SANS scores correlated negatively with the time coverage and occurrence
of microstate class D, but the associations were not significant after correcting for multiple comparisons (time coverage of microstate class D: _r_(20) = −0.516, _p_ = 0.014, _p_holm =
0.168; occurrence of microstate class C: _r_(20) = −0.429, _p_ = 0.046, _p_holm = 0.506). We tested the FEP group three times throughout 1 year to assess whether the microstates dynamics
changed with the progression of the disease. Out of the 22 FEP, 16 participated 6 months later on a second session (FEP_2). Out of these 16, 11 were tested 6 months later on a third session
(FEP_3). Summary statistics of the computed microstates parameters for the FEP group for the three measurements throughout 1 year (FEP_2 and FEP_3) is shown in Fig. 3. For the FEP_2
comparison, two-way rm-ANOVAs yielded no nonsignificant Testing Session (First and Second Session) × Microstate Class (A, B, C, and D) interactions for mean duration (_F_(3,45) = 0.433, _p_
= 0.730, _η_2 = 0.004, 90% CI [<0.001, 0.083]), time of coverage (_F_(3,45) = 0.512, _p_ = 0.676, _η_2 = 0.005, 90% CI [<0.001, 0.095]), and occurrence (_F_(3,45) = 1.060, _p_ = 0.375,
_η_2 = 0.009, 90% CI [<0.001, 0.156]), as well as nonsignificant testing session differences for mean duration (_F_(1,15) = 3.416, _p_ = 0.084, _η_2 = 0.001, 90% CI [<0.001, 0.426]),
time of coverage (_F_(1,15) = 1.000, _p_ = 0.333, _η_2 = 4.729e − 14, 90% CI [<0.001, 0.293]), and occurrence (_F_(1,15) = 0.171, _p_ = 0.685, _η_2 = 2.812e − 4, 90% CI [<0.001,
0.187]). JZS Bayes factor ANOVAs with default prior scales revealed that the main effects models were preferred to the interaction model by Bayes factors of 4.739, 7.957, and 5.824, for mean
duration, time of coverage, and occurrence, respectively. Moreover, the analyses revealed that models without the main effect of Testing Session were preferred to the main effects models by
Bayes factors of 8.440, 5.464, and 5.051, for mean duration, time of coverage, and occurrence, respectively. For the FEP_3 comparison, two-way rm-ANOVAs yielded no nonsignificant Testing
Session (First, Second, and Third Session) × Microstate Class (A, B, C, and D) interactions for mean duration (_F_(6,60) = 0.513, _p_ = 0.796, _η_2 = 0.009, 90% CI [<0.001, 0.061]), time
of coverage (_F_(6,60) = 0.210, _p_ = 0.972, _η_2 = 0.003, 90% CI [<0.001, 0.006]), and occurrence (_F_(6,60) = 0.255, _p_ = 0.955, _η_2 = 0.004, 90% CI [<0.001, 0.008]), as well as
nonsignificant testing session differences for mean duration (_F_(2,20) = 0.885, _p_ = 0.428, _η_2 = 0.002, 90% CI [<0.001, 0.244]), time of coverage (_F_(2,20) = 0.443, _p_ = 0.648, _η_2
= 3.214e − 14, 90% CI [<0.001, 0.176]), and occurrence (_F_(2,20) = 0.289, _p_ = 0.752, _η_2 = 0.001, 90% CI [<0.001, 0.140]). JZS Bayes factor ANOVAs with default prior scales
revealed that the main effects models were preferred to the interaction model by Bayes factors of 14.333, 24.000, and 22.500, for mean duration, time of coverage, and occurrence,
respectively. Moreover, the analyses revealed that models without the main effect of Testing Session were preferred to the main effects models by Bayes factors of 11.628, 13.889, and 11.111,
for mean duration, time of coverage, and occurrence, respectively. META-ANALYSIS Our literature search identified eight independent studies comparing the resting-state dynamics of the four
canonical microstate classes in patients belonging to the schizophrenia spectrum against a control group18,23,29,30,31,32,33,34. In addition to these eight studies, we also included the
current study in the meta-analysis. Forest plots of the mean effect sizes for each microstate parameter (mean duration, time coverage, and occurrence) and microstate class (A, B, C, and D)
are shown in Supplementary Figs. 1–12. Similar to Rieger et al.15, we found consistently increased time coverage (_g_ = 0.447, 95% CI [0.228, 0.666], _p_ = 6.304e − 5, _p_holm = 6.934e − 4)
and occurrence (_g_ = 0.688, 95% CI [0.504, 0.872], _p_ = 2.430e − 13, _p_holm = 2.916e − 12) of microstate class C in patients compared with controls, as well as decreased time coverage
(_g_ = −0.506, 95% CI [−0.839, −0.172], _p_ = 0.003, _p_holm = 0.027) and mean duration (_g_ = −0.540, 95% CI [−0.853, −0.227], _p_ = 7.170e − 4, _p_holm = 0.007) of microstate class D in
patients compared with controls. We also found a decreased mean duration of microstate class B in patients compared with controls; however, the effect was not significant after correction
for multiple comparisons (_g_ = −0.353, 95% CI [−0.642, −0.063], _p_ = 0.017, _p_holm = 0.136). No consistent group differences were found for microstate class A. DISCUSSION Several studies
have consistently identified abnormal temporal dynamics of EEG microstates in patients with schizophrenia6,18,30,31,33,34,35,36. Similar patterns were found in patients with 22q11.2 deletion
syndrome23. Based on these findings, Tomescu et al. suggested that alterations in the temporal dynamics of EEG microstates are a candidate endophenotype for schizophrenia6. For an
endophenotype, it is important that unaffected relatives also show abnormalities, pointing to the genetic underpinnings of the disease3. Here, we showed that siblings and patients show
similar microstates dynamics: increased presence of microstate class C and decreased presence of microstate class D compared with controls. These results suggest that microstate classes C
and D capture some genetic component shared by the patients and their unaffected siblings. For microstate class B, patients showed decreased mean durations compared with controls.
Surprisingly, microstate class B was more present in siblings compared with patients. No statistically significant group differences were found for microstate class A. We also analyzed the
EEG microstates of 22 FEP patients and a subset of 22 chronic patients with schizophrenia, selected pseudo-randomly to match the FEP patients’ demographics as close as possible. We found no
evidence for differences between the two groups in any of the microstate parameters of any of the microstate classes. We re-tested FEP patients two other times, separated by 6 months, and
found that, in general, the microstates dynamics remained stable. However, this interpretation should be taken with care since only a subset of the initial 22 FEP (16 in the second testing
and 11 in the third testing) participated in the three tests. Nevertheless, these results suggest that the microstates abnormalities are present at the beginning of the disease and remain
stable until chronicity is established, which is important for fulfilling the requirements of an endophenotype3. Finally, we conducted a meta-analysis over nine studies investigating the EEG
microstates dynamics in the schizophrenia spectrum (including the current study) to provide an up-to-date estimate of the overall effect sizes of microstate dynamics abnormalities in
schizophrenia. In general, the results of our meta-analysis were similar as the ones reported in a previous meta-analysis15. Namely, increased presence of microstate class C and decreased
presence of microstate class D in patients compared with controls, with medium effect sizes. Decreased mean duration of microstate class B in patients compared with controls, with small
effect size; though this effect was not significant after correcting for multiple comparisons. In sum, the dynamics of resting-state EEG microstates, particularly classes C and D, are a
potential endophenotype for schizophrenia since it meets most of the major criteria proposed by Gottesman and Gould3 and further practicability and explicability criteria proposed by
Turetsky et al.37, discussed one-by-one below. Association with the disease: abnormalities in the temporal metrics of microstate classes C and D have been associated with schizophrenia for
almost 20 years, with medium effect sizes15. Relatives: here, we showed that unaffected siblings show similar abnormalities as their ill relatives. State independency: here, we showed that
FEP show similar microstates dynamics as chronic patients and that, in FEP, the dynamics remain stable throughout 1 year. We did not directly compare the FEP against healthy controls or the
effects of medication, but several other studies have done so and found that FEP and un-medicated chronic patients also show similar microstate classes C and D
deviations15,18,32,33,34,35,36. Practicability: resting-state EEG is easily recorded in a 5 min session, and EEG montages with as low as 19 electrodes can be used for microstates analysis38.
Moreover, even though differences in EEG preprocessing and temporal smoothing parameters might influence the results of microstate analysis, it has been shown that microstate analysis has a
high test–retest reliability, independently of the clustering algorithms applied and the number of electrodes used8. Explicability: the abnormal microstates dynamics in schizophrenia are
viewed as an imbalance between processes that load on saliency (microstate class C), which are increased, and processes that integrate contextual information (microstate class D), which are
reduced15. This interpretation goes in line with the view of schizophrenia as a state of abnormal assignment of saliency39 and a disorder affecting attentional processes, context update, and
executive control40. Heritability: we currently have no information on the heritability of the patterns of microstate dynamics. However, we found positive correlations between the values of
microstate parameters in patients and their siblings for occurrence of microstate class C and mean duration of microstate class B. Although the current study was not conceived to study
heritability and these correlations did not survive multiple comparisons, these correlations provide some weak evidence that patterns of microstate dynamics might be heritable. Further
studies, designed to address the heritability issue, might provide further evidence for this hypothesis. We speculate that EEG microstate dynamics are not only a candidate endophenotype, but
also, as our results suggest, they might reveal a potential compensation signal in unaffected siblings of patients with schizophrenia. We associate this compensation signal with the
increased presence of microstate class B present in this population. More specifically, even though patients and siblings share similar traits, e.g., dynamics of microstate classes C and D,
which might indicate vulnerability for schizophrenia, siblings can somehow counteract these traits by having an increased presence of microstate class B. Little is known about microstate
class B. It has been related to a resting-state visual network in fMRI13,16. In healthy participants, it is the shortest and least frequent microstate from adolescence on38,41. Moreover, the
visual network is expected to reach maturation much earlier than higher order cognitive networks42. Combined together, these observations suggest that the dynamics of microstate class B
might be an early marker to discriminate people that are at risk to develop schizophrenia from those that might compensate for their vulnerability. Regarding associations between
psychopathological symptoms and microstate dynamics, in FEP, we observed negative correlations between the SANS scores and the time coverage of microstate class D as well as between the SANS
scores and the occurrence of microstate class D; however, the correlations were not significant after correcting for multiple comparisons. For chronic patients with schizophrenia, we found
no significant correlations between psychopathological symptoms and the microstate parameters for any of the microstate classes. Nonetheless, the coefficients of the Pearson correlation
between the SANS scores of patients with schizophrenia and their microstate parameters for microstate class D were negative as in FEP (mean duration: _r_(99) = −0.144, _p_ = 0.150; time
coverage: _r_(99) = −0.190, _p_ = 0.057; occurrence: _r_(99) = −0.183, _p_ = 0.067; Supplementary Table 7). In the literature, the duration of microstate class D has been found to correlate
negatively with scores of paranoid-hallucinatory symptomatology18 and with acute hallucination experiences43 in patients with schizophrenia. More recently, it has been reported that the time
coverage of microstate class A correlated positively with avolition–apathy scores, even though there were no group differences between patients and controls30. Finally, in a sample of
adolescents with 22q11.2 deletion syndrome, the mean durations of microstate class C were associated with increased hallucination subscores of the structured interview for prodromal
syndromes23. These results suggest that there might be an association between the microstate dynamics and psychopathological symptoms; however, the results in the literature are too
heterogeneous to make firm conclusions at this point. There are several considerations that should be taken into account. First, there are demographics differences between patients with
schizophrenia, their siblings, and controls. Tomescu et al.41 showed evidence for age- and gender-specific effects on the microstates dynamics. Here, we tried to minimize these effects by
using age as a covariate and gender as a factor in the analyses. Second, schizophrenia is a heterogeneous disease and our samples may be too small to cover the full schizophrenia spectrum.
Third, we cannot exclude the potential effects of treatment in the microstate class B differences between siblings and patients. Most of our patients were medicated and, in chronic patients
with schizophrenia, we found a positive association with medication intake (CPZ equivalents) and the occurrence of microstate class C (although not significant after correction for multiple
comparisons), providing evidence that medication interact with microstates dynamics. This potential interaction is also supported by previous work that has shown that perospirone (an
antipsychotic drug) can increase the duration of microstate class D in healthy controls44. In addition, antipsychotic medication has been shown to normalize microstate dynamics (decrease
presence of microstate class C and increase presence of microstate class D) in patients that respond well to antipsychotic treatment33. While most of the studies included in our
meta-analysis only investigated the microstates dynamics in medication naïve patients, few studies investigated patients taking antipsychotic medication. One of these studies found that
microstate class D was decreased in FEP compared with controls31, while another found increased duration and time coverage of microstate class C in patients with schizophrenia compared with
controls30. In addition, a recent study with FEP also identified decreased mean durations of microstate class A in FEP compared with controls, a result that does not align with the
literature29. However, since most of the studies of EEG microstates in schizophrenia have small samples (_n_ < 30), it is expected that, due to sampling error and the heterogeneity of the
disorder, some effects might not be significant in some studies and even reversed in a few studies if the effect sizes are small. In conclusion, this is the first study on the temporal
dynamics of the four canonical EEG microstates in siblings of patients with schizophrenia. Results indicate that the dynamics of resting-state EEG microstates, particularly classes C and D,
is a potential endophenotype for schizophrenia. Since the dynamics of microstates can be altered by neurofeedback45 and transcranial magnetic stimulation46, these results open avenues for
the development of new treatments for the disorder. METHODS AND MATERIALS GENERAL INFORMATION ABOUT PARTICIPANTS Participants were no older than 55 years old. All participants have
participated in a previous study on masking and evoked-related potentials (ERPs). Masking and ERP data of some participants have been already published, while data of other participants have
not been analyzed yet. All participants signed informed consent and were informed that they could quit the experiments at any time. All procedures complied with the Declaration of Helsinki
and were approved by the Ethical Committee of Institute of Postgraduate Medical Education and Continuous Professional Development (Georgia). Protocol number: 09/07. Title: “Genetic
polymorphisms and early information processing in schizophrenia”. PARTICIPANTS OF STUDY 1 Three groups of participants joined study 1: chronic patients with schizophrenia (_n_ = 101),
unaffected siblings of patients with schizophrenia (_n_ = 43), and healthy controls (_n_ = 75). Resting microstate dynamics data of 27 patients and 27 controls have already been published in
previous work6. Masking and ERP data of 89 patients, 39 siblings, and 63 controls have already been published47,48,49. Patients with schizophrenia and their siblings were recruited from the
Tbilisi Mental Health Hospital or the psycho-social rehabilitation center. Patients participated in the study when they had recovered sufficiently from an acute psychotic episode.
Thirty-one were inpatients; 70 were outpatients. Patients were diagnosed using the Diagnostic and Statistical Manual of Mental Disorders Fourth Edition (DSM-IV) by means of an interview
based on the Structured Clinical Interview for DSM-IV, Clinician Version, information from staff, and study of patients’ records. Psychopathology of patients with schizophrenia was assessed
by an experienced psychiatrist using the SANS and SAPS. Out of the 101 patients, 88 were receiving neuroleptic medication. CPZ equivalents are indicated in Table 4. We included siblings of
the patients with schizophrenia only when they had no history of psychoses. Controls were recruited from the general population, aiming to match patients and siblings as closely as possible.
All siblings and controls were free from psychiatric axis I disorders. Family history of psychosis was an exclusion criterion for the control group. General exclusion criteria were alcohol
or drug abuse, severe neurological incidents or diagnoses (including head injury), development disorders (autims spectrum disorder or intellectual disability), or other somatic mind-altering
illnesses, assessed through interview by certified psychiatrists. Group characteristics are presented in Table 4. Since patients and controls differed in terms of gender (_X_2(1) = 35.762,
_p_ = 2.229e − 9) and education (_t_(174) = −3.915, _p_ = 1.297e − 4), but not in terms of age (_t_(174) = 1.399, _p_ = 0.164) nor handedness (_X_2(1) = 0.030, _p_ = 0.863), gender was used
as a factor while education was used as a covariate in subsequent analyses. Siblings and controls had similar characteristics: gender (_X_2(1) = 0.109, _p_ = 0.741), age (_t_(116) = −1.976,
_p_ = 0.051), education (_t_(174) = −1.653, _p_ = 0.101), and handedness (_X_2(1) = 0.026, _p_ = 0.871). Out of the 43 siblings, 32 were each a sibling of a single patient in the current
study (hereinafter referred to as siblings_32 and patients_32). The remaining 11 siblings were siblings of patients that performed a battery of tests but did not participate in the current
EEG experiment. Group characteristics of patients_32 and siblings_32 are presented in Table 4. In subsequent analyses, for each of the computed microstate parameters, the score of
siblings_32 was subtracted from their patients_32 pair, resulting in a difference score (Δ), which was submitted for statistical analysis. PARTICIPANTS OF STUDY 2 Twenty-two FEP participated
in the study. Masking and ERP data of 21 of them have been published in previous work50. FEP were recruited from the Tbilisi Mental Health Hospital or the Acute Psychiatric Departments of
Multiprofile Clinics. FEP selection, exclusion criteria, and psychopathological assessment were the same as for chronic patients with schizophrenia, see “Participants of Study 1”. Out of the
22 FEP, 20 were receiving neuroleptic medication: 4 were inpatients; 18 were outpatients. From our pool of 101 chronic patients with schizophrenia (see “Participants of Study 1”), we
pseudo-randomly selected 22 patients (Patients_22), to match the 22 FEP as closely as possible, regarding gender (_X_2(1) = 0.026, _p_ = 0.871), age (_t_(42) = −0.563, _p_ = 0.576), and
education (_t_(42) = −0.780, _p_ = 0.440). Group characteristics are shown in Table 5. FEP and Patients_22 groups differed only in terms of illness duration (_t_(42) = −5.838, _p_ = 6.786e −
7), SANS (_t_(42) = −2.271, _p_ = 0.028) and SAPS (_t_(42) = −2.433, _p_ = 0.019) scores. The two groups did not significantly differ in terms of CPZ equivalent (_t_(36) = −0.305, _p_ =
0.762) nor handedness (_X_2(1) = 0.000, _p_ = 1.000). We tested the FEP group three times throughout 1 year to assess whether the microstates dynamics changed with the progression of the
disease. Out of the 22 patients, 16 participated 6 months later on a second session (FEP_2). Out of these 16, 11 were tested 6 months later on a third session (FEP_3). All the 22 FEP were
invited to participate in all three session, but six of them dropped out after the first session and the other five patients dropped out after the second session. At the second testing, 10
out of the 16 FEP_2 were receiving neuroleptic medication, and they were all outpatients. At the third testing, 6 out of the 11 FEP_3 were receiving neuroleptic medication, and they were all
outpatients. Group characteristics of the FEP_2 and FEP_3 patients are shown in Table 6. Subtypes of FEP diagnosis according to the DSM-IV for all three testing sessions are shown in
Supplementary Table 12. EEG RECORDING AND DATA PROCESSING Participants were sitting in a dim lit room. They were instructed to keep their eyes closed and to relax for 5 min. Resting-state
EEG was recorded before participants participated in a masking experiment and using a BioSemi Active 2 system (Biosemi) with 64 Ag-AgCl sintered active electrodes, referenced to the common
mode sense electrode. The recording sampling rate was 2048 Hz. Offline data were downsampled to 128 Hz and preprocessed using an automatic pipeline (APP)51: filtering with a bandpass of 1–40
Hz; removal of powerline noise; re-referencing to the biweight estimate of the mean of all channels; removal and 3D spline interpolation of bad channels; removal of bad EEG periods;
independent component analysis to remove eye movement-, muscular- and bad channel-related artifacts; re-referencing to common average reference. The proportion of interpolated electrodes was
<5% for each participant. The amount of removed EEG periods was 5.56% ± 3.78 for patients, 4.65% ± 3.42 for siblings and 4.96% ± 3.76 for controls. A one-way ANOVA revealed
nonsignificant effect of group on the amount of removed EEG periods (_F_(2,216) = 0.810, _p_ = 0.446). For Patients_22 and FEP, the amount of removed EEG periods was 5.03% ± 4.53 and 3.46% ±
2.08, for each group, respectively. An independent samples _t_-test showed that the amount of removed EEG periods was not significantly different between Patients_22 and FEP (_t_(42) =
0.145, _p_ = 0.145). The global field power (GFP) of the preprocessed EEG data was determined for each participant. GFP is an instantaneous reference-independent measure of neuronal activity
throughout the brain, and it is calculated as the standard deviation of the electrical potential across all electrodes at each time point52. Since EEG map topographies remain stable around
the GFP peaks and these are the best representatives of the topographic maps regarding signal-to-noise ratio38, only EEG topographies at the GFP peaks were submitted to further analysis. The
GFP-reduced data were submitted to k-means clustering12,24 to identify the most dominant topographies as classes of microstates present in the recordings. The clustering analysis was first
done at the individual level and then across participants in each group. To have equal contributions of microstates per participant, each participant contributed to the group k-means
clustering with his/hers four most dominant microstates. To compare our results with previous studies, we selected four microstates for each group, and labeled them A–D according to their
similarities to the previously reported microstate classes5. To ensure that the four selected microstates were similar across groups, we computed spatial correlation53 for each of the four
microstate classes for each pair of groups. High spatial correlation coefficients indicated that the microstate classes were similar between groups (see Supplementary Tables 1 and 8).
Subsequently, for each group, we compared the four microstates with the instantaneous scalp potential maps in each participant’s artifact-correct EEG using a competitive fitting procedure.
For each time point of the individual EEG, the scalp topography was compared with each microstate class using spatial correlation. The time point was then labeled according to the microstate
that exhibited the greatest correlation. Temporal smoothing (window (half) size = 5, strength (Besag) = 10, rejection of microstates with durations of one time frame) was applied to ensure
that noise during low GFP periods did not interrupt segments of quasi-stable topographies10. For each subject, three per class microstate parameters were computed: mean duration, time
coverage, and frequency of occurrence (occurrence). Mean duration (in ms) is the average time that a given microstate was uninterruptedly present. Time coverage (in %) is the percentage of
the total analysis time spent in a given microstate. Occurrence is the mean number of times a given microstate is occurring per second. Microstates analysis was performed using Cartool24
(version 3.70). The temporal smoothing in the current study was different from the one performed by Tomescu et al.6, a study with data from 27 patients and 27 controls included in our
sample. As mentioned above, in the current study, we rejected microstates with durations of one time frame, while Tomescu et al. did not. This resulted in the microstate mean durations in
the current study to be longer than the ones reported by Tomescu et al. However, in a subsequent work from the same group of researchers41, rejection of microstates with durations of one
time frame was applied, which led to microstate mean durations similar to the ones in current study. We did not remove potentially truncated microstates before evaluating the microstate
parameters. Since the groups did not significantly differ in the amount of EEG periods removed, this does not pose a problem in the overall group comparisons. META-ANALYSIS A literature
search was conducted for papers published before 29 November 2019 via PubMed, to identify studies investigating EEG microstate dynamics in schizophrenia. The keywords were “schizophreni*” in
conjunction with “microstate*”, in order to get schizophrenia, schizophrenic, and schizophrenics as well as microstate and microstates. Furthermore, a prior meta-analysis and two reviews on
EEG microstates were inspected for potentially missed studies4,5,15. We identified 28 relevant studies. For our meta-analysis, we selected studies according to the following criteria: *
Criterion 1. The study reported original data from a group of patients belonging to the psychosis spectrum as well as a healthy control group. * Criterion 2. The reported sample sizes,
summary statistics, or _t_-, _F_-, or _p_ values had to be sufficiently detailed in order to compute effect sizes estimates and their variances. If the relevant information was not provided,
we contacted the corresponding authors of the studies and asked for additional information. This was the case for two studies, Koenig et al.18 and Murphy et al.29. For these, Thomas Koenig
and Michael Murphy, authors of18 and29, respectively, provided the summary statistics, via e-mail. * Criterion 3. The EEG montage employed the standard 10–20 system. * Criterion 4. Four
microstate classes (A, B, C, and D) were considered, since this is the number of microstate classes most frequently used in the literature5. * Criterion 5. The study was a resting-state
state study, i.e., participants were not engaged in any particular task. * Criterion 6. The study reported at least one of the following three microstate parameters: mean duration, time
coverage, and occurrence. Only nine of the initial identified 28 studies met these six criteria. In addition, we included the current study (da Cruz et al.) and removed one study6 because it
consisted of a subset of participants of the current study. Hence, we included a total of nine studies in our meta-analysis. A comprehensive list of all identified studies, with a short
explanation for exclusion (if applicable), is presented in Supplementary Table 13. Apart from three studies, all the other studies reported the three relevant microstate parameters. The
study by Nishida et al.32 did not report the time coverage, the study by Giordano et al.30 did not report the occurrence, while the study by Murphy et al.29 only reported the mean duration
(however, the time coverage and occurrence were obtained through personal correspondence). For each study, we calculated Cohen’s _d_ as the mean difference between patients and controls
divided by the within group standard deviation, for each available microstate parameter and for each microstate class. For the current study (da Cruz et al.), we used the Cohen’s _d_ values
reported in Table 1, which are corrected for gender and education differences. Hedges’ _g_ was calculated using Cohen’s _d_ multiplied by the coefficient _J_, which is a correction for small
samples54. STATISTICAL ANALYSIS In study 1, for patients vs. controls, for each of the computed microstate parameters (mean duration, time coverage, and occurrence), we performed a
three-way rm-ANOVA, with Group (patients and controls), Microstate Class (A, B, C, and D), Gender as factors and Education as a covariate. For siblings vs. controls, for each of the computed
microstate parameters, we performed a two-way rm-ANOVA with Group (siblings and controls) and Microstate Class as factors. For patients_32 vs. siblings_32 pairs, their difference scores (Δ)
for each microstate parameter and microstate class were submitted to a two-sided one-sample _t_-test against 0. For each of the three analyses (patients vs. controls, siblings vs. controls,
and patients_32 vs. siblings_32), pairwise group comparisons for all microstate parameters and for each microstate class were corrected for multiple comparisons with Bonferroni–Holm for 12
comparisons (3 parameters × 4 classes). In study 2, for FEP vs. Patients_22, for each computed microstate parameter, we performed a two-way rm-ANOVA with group and microstate class as
factors. To investigate whether the computed microstates changed throughout 1 year for the FEPs, we divided the analysis in two parts. First, we analyzed the microstate parameters in the
FEP_2 (FEP that completed the first and second testing session). Then, we analyzed the microstate parameters in the FEP_3 (FEP that completed all the three testing sessions). In both cases,
for each computed microstate parameter, we computed a two-way rm-ANOVA with testing session (for FEP_2: first and second; for FEP_3: first, second, and third) and microstate class as
factors. For the meta-analysis, Hedges’ _g_ values were introduced as a generic effect size in the OpenMeta Analyst software (http://www.cebm.brown.edu/openmeta/) with the corresponding
standard error. We used the continuous random-effect analysis with the restricted maximum likelihood method. The meta-analysis software computed the effect sizes, with 95% confidence
intervals (CI) and the pooled effect size g*. _Z_-tests were conducted to test the significance of the of the pooled effect size g*. _p_ values were corrected for 12 comparisons (3
microstate parameters × 4 microstate classes) using Bonferroni–Holm correction. Where applicable, statistical tests were always two-sided. We considered a statistical test to be significant
when the _p_ value was below 0.05 after correction for multiple comparisons using Bonferroni–Holm correction (_p_holm). As estimates of effect size, we report Cohen’s _d_ with 95% CI and
_η_2 with 90% CI. Statistical tests were performed with JASP55 software (version 0.12.1) and R56 (version 3.6.1). REPORTING SUMMARY Further information on research design is available in the
Nature Research Reporting Summary linked to this article. DATA AVAILABILITY The data that support the findings of this study are available upon reasonable request. The source data
underlying Figs. 1a–d, 2a–d, and 3a–c and Supplementary Figs. 1–12 are provided as a Source Data File. Source data are provided with this paper. REFERENCES * Li, Z. et al. Genome-wide
association analysis identifies 30 new susceptibility loci for schizophrenia. _Nat. Genet._ 49, 1576–1583 (2017). Article CAS PubMed Google Scholar * Ripke, S. et al. Biological insights
from 108 schizophrenia-associated genetic loci. _Nature_ 511, 421–427 (2014). Article ADS CAS PubMed Central Google Scholar * Gottesman, I. I. & Gould, T. D. The endophenotype
concept in psychiatry: etymology and strategic intentions. _Am. J. Psychiatry_ 160, 636–645 (2003). Article PubMed Google Scholar * Khanna, A., Pascual-Leone, A., Michel, C. M. &
Farzan, F. Microstates in resting-state EEG: current status and future directions. _Neurosci. Biobehav. Rev._ 49, 105–113 (2015). Article PubMed Google Scholar * Michel, C. M. &
Koenig, T. EEG microstates as a tool for studying the temporal dynamics of whole-brain neuronal networks: a review. _NeuroImage_ 180, 577–593 (2018). Article PubMed Google Scholar *
Tomescu, M. I. et al. Schizophrenia patients and 22q11.2 deletion syndrome adolescents at risk express the same deviant patterns of resting state EEG microstates: a candidate endophenotype
of schizophrenia. _Schizophr. Res. Cogn._ 2, 159–165 (2015). Article PubMed PubMed Central Google Scholar * Lehmann, D., Ozaki, H. & Pal, I. EEG alpha map series: brain micro-states
by space-oriented adaptive segmentation. _Electroencephalogr. Clin. Neurophysiol._ 67, 271–288 (1987). Article CAS PubMed Google Scholar * Khanna, A., Pascual-Leone, A. & Farzan, F.
Reliability of resting-state microstate features in electroencephalography. _PLoS ONE_ 9, e114163 (2014). Article ADS PubMed PubMed Central CAS Google Scholar * Wackermann, J.,
Lehmann, D., Michel, C. M. & Strik, W. K. Adaptive segmentation of spontaneous EEG map series into spatially defined microstates. _Int. J. Psychophysiol._ 14, 269–283 (1993). Article
CAS PubMed Google Scholar * Pascual-Marqui, R. D., Michel, C. M. & Lehmann, D. Segmentation of brain electrical activity into microstates: model estimation and validation. _IEEE
Trans. Biomed. Eng._ 42, 658–665 (1995). Article CAS PubMed Google Scholar * Milligan, G. W. & Cooper, M. C. An examination of procedures for determining the number of clusters in a
data set. _Psychometrika_ 50, 159–179 (1985). Article Google Scholar * Murray, M. M., Brunet, D. & Michel, C. M. Topographic ERP analyses: a step-by-step tutorial review. _Brain
Topogr._ 20, 249–264 (2008). Article PubMed Google Scholar * Custo, A. et al. Electroencephalographic resting-state networks: source localization of microstates. _Brain Connect._ 7,
671–682 (2017). Article PubMed PubMed Central Google Scholar * Seitzman, B. A. et al. Cognitive manipulation of brain electric microstates. _NeuroImage_ 146, 533–543 (2017). Article
PubMed Google Scholar * Rieger, K., Diaz Hernandez, L., Baenninger, A. & Koenig, T. 15 years of microstate research in schizophrenia—where are we? A meta-analysis. _Front. Psychiatry_
7, 22 (2016). Article PubMed PubMed Central Google Scholar * Britz, J., Van De Ville, D. & Michel, C. M. BOLD correlates of EEG topography reveal rapid resting-state network
dynamics. _NeuroImage_ 52, 1162–1170 (2010). Article PubMed Google Scholar * Brodbeck, V. et al. EEG microstates of wakefulness and NREM sleep. _NeuroImage_ 62, 2129–2139 (2012). Article
PubMed Google Scholar * Koenig, T. et al. A deviant EEG brain microstate in acute, neuroleptic-naive schizophrenics at rest. _Eur. Arch. Psychiatry Clin. Neurosci._ 249, 205–211 (1999).
Article CAS PubMed Google Scholar * Musso, F., Brinkmeyer, J., Mobascher, A., Warbrick, T. & Winterer, G. Spontaneous brain activity and EEG microstates. A novel EEG/fMRI analysis
approach to explore resting-state networks. _NeuroImage_ 52, 1149–1161 (2010). Article CAS PubMed Google Scholar * Yuan, H., Zotev, V., Phillips, R., Drevets, W. C. & Bodurka, J.
Spatiotemporal dynamics of the brain at rest—exploring EEG microstates as electrophysiological signatures of BOLD resting state networks. _NeuroImage_ 60, 2062–2072 (2012). Article PubMed
Google Scholar * Pascual-Marqui, R. D. et al. The resting microstate networks (RMN): cortical distributions, dynamics, and frequency specific information flow. Preprint at
https://arxiv.org/abs/1411.1949v2 (2014). * Milz, P., Pascual-Marqui, R. D., Achermann, P., Kochi, K. & Faber, P. L. The EEG microstate topography is predominantly determined by
intracortical sources in the alpha band. _NeuroImage_ 162, 353–361 (2017). Article CAS PubMed Google Scholar * Tomescu, M. I. et al. Deviant dynamics of EEG resting state pattern in
22q11.2 deletion syndrome adolescents: a vulnerability marker of schizophrenia? _Schizophr. Res._ 157, 175–181 (2014). Article PubMed Google Scholar * Brunet, D., Murray, M. M. &
Michel, C. M. Spatiotemporal analysis of multichannel EEG: CARTOOL. _Intell. Neurosci._ 2011, 2:1–2:15 (2011). Google Scholar * Erdfelder, E., Faul, F. & Buchner, A. GPOWER: a general
power analysis program. _Behav. Res. Methods Instrum. Comput._ 28, 1–11 (1996). Article Google Scholar * Cohen, J. _Statistical Power Analysis for the Behavioral Sciences_ (Routledge,
1988). https://doi.org/10.4324/9780203771587. * Wagenmakers, E.-J. A practical solution to the pervasive problems of p values. _Psychon. Bull. Rev._ 14, 779–804 (2007). Article PubMed
Google Scholar * Rouder, J. N., Morey, R. D., Speckman, P. L. & Province, J. M. Default Bayes factors for ANOVA designs. _J. Math. Psychol._ 56, 356–374 (2012). Article MathSciNet
MATH Google Scholar * Murphy, M., Stickgold, R. & Öngür, D. Electroencephalogram microstate abnormalities in early-course psychosis. _Biol. Psychiatry Cogn. Neurosci. Neuroimaging_ 5,
35–44 (2020). Article PubMed Google Scholar * Giordano, G. M. et al. Neurophysiological correlates of Avolition-apathy in schizophrenia: a resting-EEG microstates study. _NeuroImage
Clin._ 20, 627–636 (2018). Article PubMed PubMed Central Google Scholar * Andreou, C. et al. Resting-state connectivity in the prodromal phase of schizophrenia: insights from EEG
microstates. _Schizophr. Res._ 152, 513–520 (2014). Article PubMed Google Scholar * Nishida, K. et al. EEG microstates associated with salience and frontoparietal networks in
frontotemporal dementia, schizophrenia and Alzheimer’s disease. _Clin. Neurophysiol._ 124, 1106–1114 (2013). Article PubMed Google Scholar * Kikuchi, M. et al. Native EEG and treatment
effects in neuroleptic-naïve schizophrenic patients: time and frequency domain approaches. _Schizophr. Res._ 97, 163–172 (2007). Article PubMed Google Scholar * Lehmann, D. et al. EEG
microstate duration and syntax in acute, medication-naïve, first-episode schizophrenia: a multi-center study. _Psychiatry Res. Neuroimaging_ 138, 141–156 (2005). Article Google Scholar *
Strelets, V. et al. Chronic schizophrenics with positive symptomatology have shortened EEG microstate durations. _Clin. Neurophysiol._ 114, 2043–2051 (2003). Article CAS PubMed Google
Scholar * Irisawa, S. et al. Increased omega complexity and decreased microstate duration in nonmedicated schizophrenic patients. _Neuropsychobiology_ 54, 134–139 (2006). Article PubMed
Google Scholar * Turetsky, B. I. et al. Neurophysiological endophenotypes of schizophrenia: the viability of selected candidate measures. _Schizophr. Bull._ 33, 69–94 (2007). Article
PubMed Google Scholar * Koenig, T. et al. Millisecond by millisecond, year by year: normative EEG microstates and developmental stages. _NeuroImage_ 16, 41–48 (2002). Article PubMed
Google Scholar * Kapur, S. Psychosis as a state of aberrant salience: a framework linking biology, phenomenology, and pharmacology in schizophrenia. _Am. J. Psychiatry_ 160, 13–23 (2003).
Article PubMed Google Scholar * Fioravanti, M., Bianchi, V. & Cinti, M. E. Cognitive deficits in schizophrenia: an updated metanalysis of the scientific evidence. _BMC Psychiatry_ 12,
64 (2012). Article PubMed PubMed Central Google Scholar * Tomescu, M. I. et al. From swing to cane: sex differences of EEG resting-state temporal patterns during maturation and aging.
_Dev. Cogn. Neurosci._ 31, 58–66 (2018). Article CAS PubMed PubMed Central Google Scholar * Gogtay, N. et al. Dynamic mapping of human cortical development during childhood through
early adulthood. _Proc. Natl Acad. Sci. USA_ 101, 8174–8179 (2004). Article ADS CAS PubMed Google Scholar * Kindler, J., Hubl, D., Strik, W. K., Dierks, T. & Koenig, T.
Resting-state EEG in schizophrenia: auditory verbal hallucinations are related to shortening of specific microstates. _Clin. Neurophysiol._ 122, 1179–1182 (2011). Article CAS PubMed
Google Scholar * Yoshimura, M. et al. A pharmaco-EEG study on antipsychotic drugs in healthy volunteers. _Psychopharmacology (Berl.)_ 191, 995–1004 (2007). Article CAS Google Scholar *
Hernandez, L. D., Rieger, K., Baenninger, A., Brandeis, D. & Koenig, T. Towards using microstate-neurofeedback for the treatment of psychotic symptoms in schizophrenia. A feasibility
study in healthy participants. _Brain Topogr._ 29, 308–321 (2016). Article Google Scholar * Sverak, T., Albrechtova, L., Lamos, M., Rektorova, I. & Ustohal, L. Intensive repetitive
transcranial magnetic stimulation changes EEG microstates in schizophrenia: a pilot study. _Schizophr. Res._ 193, 451–452 (2018). Article PubMed Google Scholar * da Cruz, J. R. et al.
Neural compensation mechanisms of siblings of schizophrenia patients as revealed by high-density EEG. _Schizophr. Bull._ https://doi.org/10.1093/schbul/sbz133 (2020). * Favrod, O. et al.
Electrophysiological correlates of visual backward masking in patients with major depressive disorder. _Psychiatry Res. Neuroimaging_ 294, 111004 (2019). Article PubMed Google Scholar *
Garobbio, S. A. et al. Electrophysiological correlates of visual backward masking in patients with bipolar disorder. Preprint at http://biorxiv.org/lookup/doi/10.1101/2020.05.12.090407
(2020). * Favrod, O. et al. Electrophysiological correlates of visual backward masking in patients with first episode psychosis. _Psychiatry Res. Neuroimaging_ 282, 64–72 (2018). Article
PubMed Google Scholar * da Cruz, J. R., Chicherov, V., Herzog, M. H. & Figueiredo, P. An automatic pre-processing pipeline for EEG analysis (APP) based on robust statistics. _Clin.
Neurophysiol._ 129, 1427–1437 (2018). Article PubMed Google Scholar * Lehmann, D. & Skrandies, W. Reference-free identification of components of checkerboard-evoked multichannel
potential fields. _Electroencephalogr. Clin. Neurophysiol._ 48, 609–621 (1980). Article CAS PubMed Google Scholar * Brandeis, D., Naylor, H., Halliday, R., Callaway, E. & Yano, L.
Scopolamine effects on visual information processing, attention, and event-related potential map latencies. _Psychophysiology_ 29, 315–335 (1992). Article CAS PubMed Google Scholar *
Francis, G. Equivalent statistics and data interpretation. _Behav. Res. Methods_ 49, 1524–1538 (2017). Article PubMed Google Scholar * JASP Team. JASP (Version 0.12.1)[Computer software].
(2020). * R Core Team. R: a language and environment for statistical computing. (R Foundation for Statistical Computing, 2019). Download references ACKNOWLEDGEMENTS This work was partially
funded by the Fundação para a Ciência e a Tecnologia under grant FCT PD/BD/105785/2014 and the National Centre of Competence in Research (NCCR) Synapsy financed by the Swiss National Science
Foundation under grant 51NF40-158776. We would like to thank Professor André Berchtold for assistance with statistical analysis as well as Professor Thomas Koenig and Dr. Michael Murphy for
providing additional information of their manuscripts for the meta-analysis. AUTHOR INFORMATION Author notes * These authors contributed equally: Patrícia Figueiredo, Michael H. Herzog.
AUTHORS AND AFFILIATIONS * Laboratory of Psychophysics, Brain Mind Institute, École Polytechnique Fédérale de Lausanne (EPFL), Lausanne, Switzerland Janir Ramos da Cruz, Ophélie Favrod,
Andreas Brand & Michael H. Herzog * Institute for Systems and Robotics—Lisbon (LARSyS) and Department of Bioengineering, Instituto Superior Técnico, Universidade de Lisboa, Lisbon,
Portugal Janir Ramos da Cruz & Patrícia Figueiredo * Laboratory of Vision Physiology, Beritashvili Centre of Experimental Biomedicine, Tbilisi, Georgia Maya Roinishvili * Institute of
Cognitive Neurosciences, Free University of Tbilisi, Tbilisi, Georgia Maya Roinishvili & Eka Chkonia * Department of Psychiatry, Tbilisi State Medical University, Tbilisi, Georgia Eka
Chkonia * Faculté des Sciences Sociales et Politiques, Institut de Psychologie, Bâtiment Geopolis, Lausanne, Switzerland Christine Mohr Authors * Janir Ramos da Cruz View author publications
You can also search for this author inPubMed Google Scholar * Ophélie Favrod View author publications You can also search for this author inPubMed Google Scholar * Maya Roinishvili View
author publications You can also search for this author inPubMed Google Scholar * Eka Chkonia View author publications You can also search for this author inPubMed Google Scholar * Andreas
Brand View author publications You can also search for this author inPubMed Google Scholar * Christine Mohr View author publications You can also search for this author inPubMed Google
Scholar * Patrícia Figueiredo View author publications You can also search for this author inPubMed Google Scholar * Michael H. Herzog View author publications You can also search for this
author inPubMed Google Scholar CONTRIBUTIONS M.H.H, C.M., A.B., and M.R. designed the research; M.R. and E.C. collected the data; J.R.C and O.F. analyzed data; J.R.C., O.F. A.B., C.M., P.F.,
and M.H.H. wrote the paper. CORRESPONDING AUTHOR Correspondence to Janir Ramos da Cruz. ETHICS DECLARATIONS COMPETING INTERESTS The authors declare no competing interests. ADDITIONAL
INFORMATION PEER REVIEW INFORMATION _Nature Communications_ thanks Christina Andreou and Thomas Koenig for their contribution to the peer review of this work. Peer reviewer reports are
available. PUBLISHER’S NOTE Springer Nature remains neutral with regard to jurisdictional claims in published maps and institutional affiliations. SUPPLEMENTARY INFORMATION SUPPLEMENTARY
INFORMATION PEER REVIEW FILE REPORTING SUMMARY SOURCE DATA SOURCE DATA RIGHTS AND PERMISSIONS OPEN ACCESS This article is licensed under a Creative Commons Attribution 4.0 International
License, which permits use, sharing, adaptation, distribution and reproduction in any medium or format, as long as you give appropriate credit to the original author(s) and the source,
provide a link to the Creative Commons license, and indicate if changes were made. The images or other third party material in this article are included in the article’s Creative Commons
license, unless indicated otherwise in a credit line to the material. If material is not included in the article’s Creative Commons license and your intended use is not permitted by
statutory regulation or exceeds the permitted use, you will need to obtain permission directly from the copyright holder. To view a copy of this license, visit
http://creativecommons.org/licenses/by/4.0/. Reprints and permissions ABOUT THIS ARTICLE CITE THIS ARTICLE da Cruz, J.R., Favrod, O., Roinishvili, M. _et al._ EEG microstates are a candidate
endophenotype for schizophrenia. _Nat Commun_ 11, 3089 (2020). https://doi.org/10.1038/s41467-020-16914-1 Download citation * Received: 14 May 2019 * Accepted: 28 May 2020 * Published: 18
June 2020 * DOI: https://doi.org/10.1038/s41467-020-16914-1 SHARE THIS ARTICLE Anyone you share the following link with will be able to read this content: Get shareable link Sorry, a
shareable link is not currently available for this article. Copy to clipboard Provided by the Springer Nature SharedIt content-sharing initiative