- Select a language for the TTS:
- UK English Female
- UK English Male
- US English Female
- US English Male
- Australian Female
- Australian Male
- Language selected: (auto detect) - EN
Play all audios:
ABSTRACT Adoptive cell therapy (ACT) with tumor-specific T cells can mediate cancer regression. The main target of tumor-specific T cells are neoantigens arising from mutations in
self-proteins. Although the majority of cancer neoantigens are unique to each patient, and therefore not broadly useful for ACT, some are shared. We studied oligoclonal T-cell receptors
(TCRs) that recognize a shared neoepitope arising from a driver mutation in the p53 oncogene (p53R175H) presented by HLA-A2. Here we report structures of wild-type and mutant p53–HLA-A2
ligands, as well as structures of three tumor-specific TCRs bound to p53R175H–HLA-A2. These structures reveal how a driver mutation in p53 rendered a self-peptide visible to T cells. The
TCRs employ structurally distinct strategies that are highly focused on the mutation to discriminate between mutant and wild-type p53. The TCR–p53R175H–HLA-A2 complexes provide a framework
for designing TCRs to improve potency for ACT without sacrificing specificity. SIMILAR CONTENT BEING VIEWED BY OTHERS THERAPEUTIC HIGH AFFINITY T CELL RECEPTOR TARGETING A KRASG12D CANCER
NEOANTIGEN Article Open access 10 September 2022 IDENTIFICATION AND AFFINITY ENHANCEMENT OF T-CELL RECEPTOR TARGETING A KRASG12V CANCER NEOANTIGEN Article Open access 29 April 2024 KRAS G12V
NEOANTIGEN SPECIFIC T CELL RECEPTOR FOR ADOPTIVE T CELL THERAPY AGAINST TUMORS Article Open access 12 October 2023 INTRODUCTION Adoptive cell therapy (ACT) with ex vivo-expanded
tumor-infiltrating lymphocytes (TILs) can mediate durable cancer regression in patients with metastatic melanoma, cervix, bile duct, colon, and breast cancers1,2,3,4,5. This therapeutic
effect is mediated mainly by CD8+ cytotoxic T cells6 but CD4+ T cells are also likely to contribute5. The prime target of tumor-specific T cells are neoantigens that arise as a consequence
of DNA alterations during malignant transformation7. Recent technological advances in mass spectrometry and high-throughput T cell-based assays have greatly accelerated the identification of
neoantigens resulting from somatic mutations, as well as the T cells that recognize them, in individual patients. A major challenge in developing broadly applicable neoantigen-directed ACT
is the unique neoantigen repertoire of each cancer patient7. There are few shared mutated targets among patients, even among patients with similar cancers. For example, in a study of
patients with gastrointestinal cancers, 99% of neoantigenic determinants recognized by neoantigen-reactive TILs were unique (private) and not shared (public) between any two patients8.
Nevertheless, it has been possible to identify a limited number of shared cancer neoantigens. Of particular interest are neoantigens derived from oncogenes bearing driver mutations because
these mutations are tumor-specific, biologically important for tumor progression, and likely to be expressed by all tumor cells9. In a seminal study of ACT, a patient with metastatic
colorectal cancer was treated effectively with four distinct CD8+ T cell clones that specifically targeted a neoepitope arising from the KRAS G12D driver mutation in an
HLA-C*08:02-restricted manner2. Other shared mutated neoantigens expressed by cancers of unrelated patients have now been identified. _TP53_, which encodes the tumor suppressor p53, is the
most frequently mutated gene across all cancer types10. Indeed, _TP53_ mutations are found in 40–50% of cancer patients, and effect most of the hallmarks of cancer cells, including genomic
instability, proliferation, and metastasis11,12. Mutant p53 predisposes to cancer development and is associated with ineffective therapeutic responses and unfavorable prognoses10. Despite
these effects, no drug to abrogate the oncogenic functions of mutant p53 has yet been approved for any cancer treatment. A substantial portion of _TP53_ mutations occur at hotspot positions
R175, G245, R248, R249, R273, and R28210. Because mutations at these sites confer a growth advantage to tumor cells and are associated with malignant progression, they are attractive
candidates for targeted immunotherapy. The immunogenicity of p53 mutations in patients with cancer was recently demonstrated by the detection of T responses against several shared p53
neoantigens, notably R175H and R248W13,14. Both of these driver mutations are located in the DNA-binding domain of p53 and alter its DNA-binding capacity10. Several TCRs have been isolated
from TILs of epithelial cancer patients that recognize a neoepitope corresponding to residues 168–176 of p53R175H. This neoepitope includes the arginine-to-histidine mutation at position 175
(HMTEVVRHC)13,14. The TCRs are restricted by the common MHC class I allele HLA-A*02:01. These oligoclonal TCRs, transduced at high frequency into a patient’s peripheral blood lymphocytes
for ACT, may prove effective in eliminating tumors expressing HLA-A*02:01 and the p53R175H mutation13,14. With the goal of understanding TCR recognition of cancer neoantigens at the atomic
level, we determined crystal structures of three p53R175H-specific TCRs (12-6, 38-10, and 1a2)13,14 in complex with HLA-A*02:01 and the shared neoantigen p53R175H. In previous studies, we
determined structures of human melanoma-specific TCRs bound to a neoepitope from mutant triose phosphate isomerase (mutTPI) and HLA-DR115,16. However, that neoepitope, unlike KRAS G12D2 or
p53R175H10, was only expressed in a single melanoma patient. The unique, rather than shared, nature of mutTPI, a feature that also characterizes the vast majority of cancer neoantigens
discovered to date7,8, precludes broad use of mutTPI-specific or similar TCRs in ACT. Structures have also been reported of TCRs in complex with epitopes from the tumor-associated antigens
NY-ESO-1 and MART-1 bound to HLA-A217,18. However, NY-ESO-1 and MART-1, unlike mutTPI15 or p53R175H13,14, are not neoantigens, but instead non-mutated self-antigens that are selectively
expressed in certain cancer types. By contrast, the TCR–p53R175H–HLA-A2 structures described here involve a shared cancer neoantigen. The structures reveal how oligoclonal TCRs 12-6, 38-10,
and 1a2 discriminate between wild-type and mutated p53, and demonstrate that there are multiple distinct solutions to recognizing the p53R175H neoepitope with sufficient affinity to mediate
tumor cell killing. RESULTS TCRS ARE HIGHLY SPECIFIC FOR MUTANT P53 PEPTIDE TCRs 12-6, 38-10, and 1a2 were isolated by screening TILs from patients with metastatic colorectal cancer for
reactivity towards mutated p53 neoantigens13,14. These HLA-A*0201-restricted TCRs recognize the p53R175H neoepitope using completely different _α_/_β_ chain pairs (Table 1). 12-6 utilizes
gene segments TRAV12-1 and TRAJ13 for the _α_ chain and TRBV6-1 and TRBJ2-7 for the _β_ chain; 38-10 utilizes TRAV38-1 and TRAJ28 for the _α_ chain and TRBV10-3 and TRBJ1-6 for the _β_
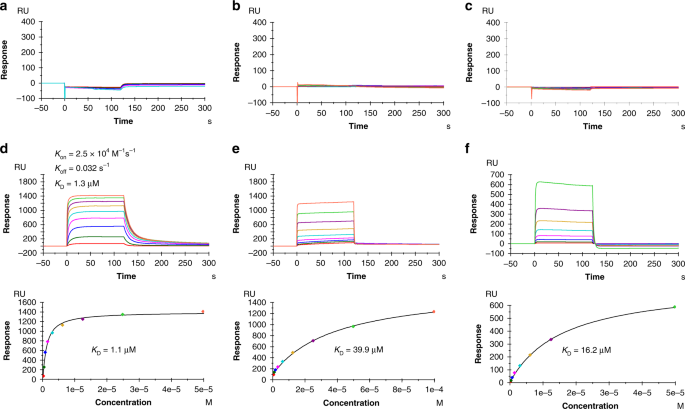
chain; and 1a2 utilizes TRAV12-3 and TRAJ12 for the _α_ chain and TRBV27 and TRBJ2-3 for the _β_ chain13,14. We used surface plasmon resonance (SPR) to measure the affinity of TCRs 12-6,
38-10, and 1a2 to HLA-A2 loaded with wild-type or mutant p53 peptide (Fig. 1). Recombinant TCR and pMHC proteins were expressed by in vitro folding from bacterial inclusion bodies.
Biotinylated wild-type p53–HLA-A2 or p53R175H–HLA-A2 was directionally coupled to a streptavidin-coated biosensor surface and different concentrations of 12-6, 38-10, or 1a2 were flowed
sequentially over the immobilized pMHC ligand. We detected no apparent interaction between any of these TCRs and wild-type p53–HLA-A2, even after injecting high concentrations of TCR (up to
328 μM for 12-6, 232 μM for 38-10, and 153 μM for 1a2) (Fig. 1a–c). By contrast, these TCRs bound mutant p53R175H–HLA-A2 with dissociation constants (_K_Ds) of 1.1 μM for 12-6, 39.9 μM for
38-10, and 16.2 μM for 1a2 (Fig. 1d–f). These affinities are well within the range of TCRs specific for microbial or other foreign antigens (_K_D = 1–50 μM), but substantially higher than
the affinities of autoimmune TCRs that recognize non-mutated self-antigens (_K_D > 100 μM)19. Kinetic parameters (on- and off-rates) for the binding of TCR 12-6 to p53R175H–HLA-A2 were
_k_on = 2.5 × 10⁴ M−1 s−1 and _k_off = 0.032 s−1, corresponding to a _K_D of 1.3 μM (Fig. 1d), which is in close agreement with the _K_D from equilibrium analysis (1.1 μM). For TCRs 38-10
and 1a2, _k_on and _k_off were too rapid to be measured reliably (Fig. 1e, f). The exquisite specificity of 12-6, 38-10, and 1a2 for p53R175H compared with p53, as measured by SPR, is
consistent with functional assays showing that T cells transduced with these TCRs can be activated by APCs pulsed with subnanomolar concentrations of mutant p53R175H peptide, but do not
respond to wild-type p53 peptide, even at >1000-fold higher concentrations13,14. DIFFERENCES BETWEEN P53 AND P53R175H ARE CONFINED TO MUTATION SITE To understand how the conservative
arginine-to-histidine mutation in p53R175H, which replaces one positively charged amino acid by another, renders this peptide immunogenic, we determined the structures of the wild-type
p53–HLA-A2 and mutant p53R175H–HLA-A2 complexes to 2.37 and 2.38 Å resolution, respectively (Supplementary Table 1) (Fig. 2a). Clear and continuous electron density extending along the
entire length of both MHC-bound peptides allowed confident identification of all peptide atoms (Supplementary Fig. 1). In both p53–HLA-A2 and p53R175H–HLA-A2, the peptide is bound in
conventional orientation with the side chains of P2 Met and P9 Cys accommodated in pockets B and F, respectively, in the peptide-binding groove (Fig. 2b). Methionine and cysteine are among
the most common residues at primary anchor positions P2 (Leu > Thr > Met ∼ Val > Ile) and P9 (Val > Ile > Thr > Ala > Cys > Leu), and are known to confer high
affinity for HLA-A*02:0120. The solvent-exposed side chains of P1 His, P4 Glu, P7 Arg, and P8 Arg/His project away from the peptide-binding groove and compose a highly featured surface for
potential interactions with TCR. By contrast, the side chains of P5 Val and P6 Val present a relatively featureless, non-protruding surface that may be a difficult target for TCR
recognition. The p53–HLA-A2 and p53R175H–HLA-A2 complexes exhibit very little structural deviation from each other (Fig. 2a). In particular, the wild-type and mutant p53 peptides are highly
superimposable, except at the P8 mutation site (Fig. 2b). The root-mean-square difference (r.m.s.d.) for _α_-carbon atoms in the peptide chains is 0.18 Å, while for all atoms, excluding the
P8 Arg and His side chains, it is 0.45 Å. Therefore, structural differences between the p53–HLA-A2 and p53R175H–HLA-A2 complexes that disclosed the naturally altered p53 self-peptide to the
T cells of cancer patients13,14 are restricted to the mutation site at P8. TCRS ARE SHIFTED TOWARD C-TERMINUS OF P53R175 PEPTIDE To understand how TCRs 12-6, 38-10, and 1a2 discriminate
between wild-type and mutant p53 epitopes with exquisite specificity (Fig. 1), we determined the structures of the 12-6–p53R175H–HLA-A2, 38-10–p53R175H–HLA-A2, and 1a2–p53R175H–HLA-A2
complexes to 2.61, 2.46, and 3.00 Å resolution, respectively (Supplementary Table 2) (Fig. 3). The interface between TCR and pMHC was in unambiguous electron density in all three complex
structures (Supplementary Fig. 2). The 1a2–p53R175H–HLA-A2 crystal contains two complex molecules in the asymmetric unit. The r.m.s.d. in _α_-carbon positions for the TCR V_α_V_β_ and MHC
_α_1_α_2 modules, including the p53R175H peptide, is 0.45 Å for the two 1a2–p53R175H–HLA-A2 complexes. Based on this close similarity, the following description of 1a2–p53R175H–HLA-A2
interactions applies to both molecules in the asymmetric unit. TCRs 12-6, 38-10, and 1a2 dock over p53R175H–HLA-A2 in a canonical diagonal orientation, with V_α_ over the _α_2 helix of
HLA-A2 and V_β_ over the _α_1 helix, but with markedly different crossing angles of TCR to pMHC21: 51° for 12-6, 34° for 38-10, and 30° for 1a2 (Fig. 4a–c). The complexes also differ with
respect to incident angle22, which corresponds to the degree of tilt of TCR over pMHC: 20° for 12-6, 27° for 38-10, and 1° for 1a2. In comparison with TCR–pMHC class I complexes from the PDB
(133 other complexes, 136 total) (Supplementary Table 4), the 38-10 TCR complex has the fourth-highest incident angle (97th percentile), and the 12-6 TCR complex has the 14th-highest (90th
percentile). Of note, the three complexes with higher incident angles than the 38-10 TCR complex are two reversed-polarity TCRs23 and a TCR in complex with a non-stimulatory peptide24.
However, whereas the unusual docking geometries of these latter TCRs are incompatible with signaling, that of 38-10 allows a robust response to antigen13. All three TCRs are shifted towards
the C-terminus of the p53R175H peptide, which is the site of the driver mutation at P8. To quantitate the shifts, we projected the positions of the TCR centers onto the pMHC plane, where the
_x_-axis is aligned with the peptide and a more positive _x_ value indicates a shift toward the peptide C-terminus (Supplementary Table 4). Remarkably, TCR 38-10 exhibits the third-highest
C-terminal shift among 136 TCR–pMHC class I structures reported to date, with 12-6 (22nd-highest) and 1a2 (26th-highest also quite shifted. Only two reversed-polarity TCRs23 are more skewed
along the peptide than 38-10. The C-terminal shift of TCRs 38-10, 12-6, and 1a2 is key to their ability to discriminate between wild-type and mutant p53 peptides (see below). As depicted by
the footprints of TCRs 12-6 and 1a2 on the pMHC surface (Fig. 4d, f), both TCRs, which were derived from different cancer patients13,14, establish contacts with the C-terminal half of the
p53R175H peptide mainly via the CDR3_β_ loop. By contrast, TCR 38-10, which was isolated from the same patient as 12-613, engages the C-terminal half of the p53R175H peptide mostly through
CDR3_α_ (Fig. 4e). Overall, the footprints of 12-6 and 1a2 on pMHC resemble each other more closely than either footprint resembles that of 38-10. V_Α_ DOMINATES CONTACTS WITH MHC TCRs 12-6,
38-10, and 1a2 engage HLA-A2 through distinct sets of interactions, despite some broad similarities (Supplementary Table 5) (Fig. 5). Of the total number of contacts (92) that TCR 12-6
makes with HLA-A2, excluding p53R175H, CDR1_α_, CDR2_α_, and CDR3_α_ contribute 5%, 42%, and 30%, respectively, compared with 5%, 3%, and 13% for CDR1_β_, CDR2_β_, and CDR3_β_, respectively
(Tables 2, 3). Hence, V_α_ dominates the interactions of 12-6 with MHC (72 of 92 contacts; 78%), with CDR2_α_ accounting for more of the binding interface than any other CDR. This dominance
of CDR2_α_ in MHC contacts is unusual for natural TCR interactions: seven other MHC class I-restricted TCR–pMHC structures were identified with greater percentages of CDR2_α_ contacts out of
total TCR–MHC contacts, but these included interactions with non-natural peptides from yeast display (PDB codes 4N5E, 3TFK, 4MXQ, 4MVB, 4N0C), an engineered TCR with altered peptide
specificity (PDB code 5E9D), and an engineered autoreactive TCR interacting with HLA-A1 and a titin-derived peptide (PDB code 5BS0). 12-6 relies on the somatically-generated CDR3 loops for
MHC recognition to approximately the same extent as the germline-encoded CDR1 and CDR2 loops (47 versus 53 contacts) (Table 2). Residues Ser52_α_ and Ser53_α_ of CDR2_α_ form a dense network
of four hydrogen bonds with Glu154H of the HLA-A2 _α_2 helix (Supplementary Table 5) (Fig. 5b). By contrast, interactions with the HLA-A2 _α_1 helix are almost entirely somatically-encoded,
with Trp98_β_ of CDR3_β_ mediating 15 hydrophobic contacts with Ala69H, Gln72H and Thr73H, and Gly94_α_ and Gln96_α_ of CDR3_α_ forming hydrogen bonds with the R65H side chain (Fig. 5a).
TCR 38-10 makes less than half as many contacts with HLA-A2 as does TCR 12-6 (38 versus 92) (Table 2) (Fig. 5c, d). This imbalance is due to a nearly complete absence of interactions with
the HLA-A2 _α_1 helix (Supplementary Table 5), as a consequence of the highly tilted binding mode of 38-10, which is characterized by a 27° incident angle of TCR over pMHC (see above). Of
the total contacts between 38-10 and HLA-A2, CDR1_α_, CDR2_α_, and CDR3_α_ account for 21%, 16%, and 37%, respectively, compared with 13%, 5%, and 8% for CDR1_β_, CDR2_β_, and CDR3_β_,
respectively. As in the case of 12-6, V_α_ dominates the interactions with MHC (41 of 49 contacts; 84%). 38-10 engages the HLA-A2 _α_2 helix using all three V_α_ CDR loops. Thus, Asn31_α_,
Glu52_α_, Lys55_α_, and Tyr97_α_ form a cluster of six hydrogen bonds with Ala150H, His151H, and Gln155H (Supplementary Table 5) (Fig. 5d). Of the total contacts (53) with HLA-A2 made by TCR
1a2, CDR1_α_, CDR2_α_, and CDR3_α_ contribute 22%, 30%, and 47%, respectively, compared with 0%, 0%, and 2% by CDR1_β_, CDR2_β_, and CDR3_β_ (Table 3). Thus, in the 1a2–p53R175H–HLA-A2
complex, V_α_ accounts for 98% of contacts with MHC, even more than in the 12-6–p53R175H–HLA-A2 (78%) and 38-10–p53R175H–HLA-A2 (84%) complexes. The level of V_α_ dominance in the TCR–MHC
interactions of the 1a2 complex appears highly unusual, as it is only exhibited by one other MHC class I-restricted TCR, C1-28, which engages HLA-A24 and an HIV epitope (PDB code 3VXM). The
paucity of V_β_–MHC interactions in all three complexes is in large measure attributable to the marked shift of the TCRs toward the C-terminus of the p53R175H peptide (Supplementary Table
4), which effectively disengages V_β_ from the MHC _α_1 and _α_2 helices, although not from the bound peptide (see below). The pronounced tilt (incident angle) of the 38-10 TCR compensates
in part for this effect, resulting in more V_β_–MHC contacts than the other two TCRs. TCR 1a2 relies heavily on the somatically-generated CDR3_α_ loop for MHC recognition (Fig. 5e). Indeed,
the percentage contribution of this loop to interactions with MHC (49% of contacts) exceeds that of any other CDR in any of the three complexes (Table 3). Five consecutive residues at the
tip of the 1a2 CDR3_α_ loop (Leu94_α_–Ser98_α_) pack tightly against the HLA-A2 _α_1 helix, with two hydrogen bonds providing additional stabilization (Supplementary Table 5). TCRS TARGET
P53 DRIVER MUTATION Upon binding p53R175H–HLA-A2, TCRs 12-6, 38-10, and 1a2 bury 71% (303 Å2), 76% (336 Å2), and 76% (304 Å2), respectively, of the peptide solvent-accessible surface, which
is typical for TCR–pMHC complexes25. However, the large majority of interactions between these TCRs and the p53R175H peptide involves C-terminal residues P7 Arg and P8 His: 44 of 52 van der
Waals contacts and 7 of 9 hydrogen bonds for 12-6, 57 of 74 van der Waals contacts and 5 of 8 hydrogen bonds for 38-10, and 37 of 53 van der Waals contacts and 6 of 8 hydrogen bonds for 1a2
(Supplementary Table 6) (Fig. 6). These interactions are about evenly distributed between P7 Arg and P8 His, which suggests the functional importance of both residues for TCR binding. This
conclusion is supported by binding energy calculations using Rosetta26 to predict changes in TCR affinity upon alanine substitution of all peptide residues in the three complexes. In each
case, the largest ΔΔ_G_ values, ranging from 1.7 to 3.6 kcal/mol, were observed for residues P7 and P8 (Supplementary Table 7). Therefore, all three TCRs focus on the C-terminal portion of
the antigenic peptide for binding, in sharp contrast to most other TCRs, which preferentially target the central portion of peptides, corresponding to residues P4–P625. The TCRs discriminate
between mutant and wild-type p53 by minimizing interactions with the central and N-terminal portions of p53R175H, which are structurally identical in the wild-type peptide (Fig. 2b).
Interactions between 12-6 and the p53R175H peptide are mediated almost exclusively by CDR3_β_ (Supplementary Table 6), whereas 38-10 and 1a2 employ both CDR3_α_ and CDR_β_ for peptide
recognition (Fig. 6a, b). Consistent with differences in _α_/_β_ chain pairing and docking geometry (Fig. 4), TCRs 12-6, 38-10, and 1a2 use distinct strategies to achieve highly specific
recognition of the mutant p53 peptide relative to wild-type, as demonstrated by SPR (Fig. 1). However, the TCRs share a pronounced skewing toward the peptide C-terminus (Supplementary Table
4) as a result of positioning one or both of their CDR3 loops directly over P8 His (Fig. 6a–c). In the unbound p53R175H–HLA-A2 structure (Fig. 2a), the P8 His imidazole ring has one face
against the side chain of Val76H of the HLA-A2 _α_1 helix, leaving its other face and most of its edge available for TCR binding. Each TCR provides close contacts that tightly sandwich the
imidazole between Val76H and a specific CDR3 side chain: CDR3_β_ Gln99 in 12-6, CDR3_α_ Tyr103 in 38-10, and CDR3_β_ Gln97 in 1a2 (Fig. 6c). In addition, the phenyl ring of CDR3_α_ Tyr103
forms _π_–_π_ stacking interactions with the imidazole ring of P8 His. Further selectivity for the mutant p53 peptide arises from hydrogen bonds with the P8 His side chain: 12-6 Glu95_β_
O_ε_2–N_δ_1 P8 His, 12-6 Trp98_β_ Ν_ε_1–N_ε_2 P8 His, 38-10 Tyr31_β_ OH–N_δ_1 P8 His, and 1a2 Ser98_α_ O_γ_–N_ε_2 P8 His (Supplementary Table 6). To assess the effect of replacing P8 His by
Arg, which corresponds to reversion to the wild-type p53 peptide, we performed in silico mutagenesis using Rosetta27. A similar modeling protocol was previously used to predict binding
effects of TCR–pMHC interface mutations28. Peptide substitutions were modeled in each X-ray complex structure, followed by side-chain packing and energetics-based scoring to calculate ΔΔ_G_.
Predicted ΔΔ_G_ values were 1.6, 1.2, and 2.0 Rosetta energy units (REU; analogous to kcal/mol) for 12-6, 38-10, and 1a2, respectively, suggesting substantial losses in TCR binding affinity
for wild-type p53 peptide (Supplementary Table 7), as observed experimentally by SPR (Fig. 1). To assess possible structural defects leading to TCR affinity loss for the p53 revertant
peptide, we calculated TCR–pMHC shape complementarity statistics (_S_c) for the X-ray and modeled p53 revertant interfaces. _S_c values for p53175H interfaces are 0.72, 0.64, and 0.69 for
12-6, 38-10, and 1a2, respectively, commensurate with other MHC class I TCR–pMHC structures in the TCR3d database29, while they are 0.69, 0.57, and 0.71 for p53 revertants and the same
respective TCRs, indicating loss of shape complementarity for the 12-6 and 38-10 TCR interfaces, and less predicted effect on the shape complementarity of the 1a2 interface. To further
investigate the mechanistic basis of peptide specificity for these TCRs, the individual Rosetta scoring function terms comprising the predicted ΔΔ_G_ values noted above and in Supplementary
Table 7 were obtained (Supplementary Table 8). This revealed that loss of favorable van der Waals interactions dominated the change in predicted binding affinity for the 12-6 TCR, whereas
disruptions of side chain–side chain hydrogen bond interactions involving P8 His were primarily responsible for predicted 38-10 and 1a2 TCR affinity losses. CONFORMATIONAL CHANGES OPTIMIZE
TCR–PMHC INTERACTIONS Superposition of the MHC _α_1_α_2 domains of unbound p53R175H–HLA-A2 onto those of p53R175H–HLA-A2 in complexes with TCRs 12-6, 38-10, and 1a2 showed small yet relevant
differences in peptide conformation, corresponding to r.m.s.d. of 0.76, 0.81, and 0.70 Å, respectively, for main-chain atoms of p53R175H. In each case, peptide residues P4–P8 are more
deeply buried in the peptide-binding groove after TCR engagement (Fig. 7a–c), thereby enabling the TCR to maximize interactions with MHC. P6 Val underwent the largest individual
displacement: 1.4, 1.6, and 0.9 Å in its _α_-carbon position in the 12-6–p53R175H–HLA-A2, 38-10–p53R175H–HLA-A2, and 1a2–p53R175H–HLA-A2 complexes, respectively. Binding of TCR 38-10 induced
structural adjustments in HLA-A2 at a bend in the _α_2 helix corresponding to residues 147–151, which underwent an average displacement of 1.3 Å in the position of their _α_-carbons toward
the p53R175H peptide (Fig. 7b). There are two adjacent water molecules under peptide residues P6–P8 in the wild-type p53–HLA-A2 and unbound mutant p53R175H–HLA-A2 structures. These waters
are retained in the 38-10–p53R175H–HLA-A2 and 12-6–p53R175H–HLA-A2 complexes. The low resolution of the 1a2–p53R175H–HLA-A2 complex (3.00 Å) precluded identification of ordered waters with
confidence. To assess ligand-induced conformational changes in the TCRs, we determined the structures of 12-6 and 1a2 in unbound form to 2.36 and 1.83 Å resolution, respectively (TCR 38-10
did not crystallize) (Supplementary Table 3). Superpositions of the free and bound TCR 12-6 and 1a2 structures are shown in Supplementary Fig. 3. Superposition of the V_α_V_β_ domains of
free 12-6 onto those of 12-6 in complex with p53R175H–HLA-A2 revealed structural differences in the CDR3 loops (Fig. 7d). Whereas conformational adjustments in CDR3_β_ were restricted mainly
to shifts in side-chain orientation, CDR3_α_ underwent a large movement (r.m.s.d. in _α_-carbon positions of 3.7 Å for residues 93–97), which allowed CDR3_α_ Gly94 to hydrogen bond with P4
Glu and Arg65H, CDR3_α_ Tyr95 to hydrogen bond with CDR3_β_ Leu97 and contact the HLA-A2 _α_1 helix, and CDR3_α_ Gln96 to hydrogen bond with Arg65H. CDR3_α_ Tyr95 showed the largest
individual displacement (6.5 Å in its _α_-carbon position). Ligand-induced conformational changes were also observed in the CDR3 loops of 1a2 (Fig. 7e). CDR3_β_ underwent a rearrangement
(r.m.s.d. in _α_-carbon positions of 1.8 Å for residues 96–102) that resulted in formation of four hydrogen bonds and 33 van der Waals contacts with P7 Arg and P8 His at the critical
C-terminus of p53R175H. CDR3_α_ experienced a considerably larger movement (r.m.s.d. of 5.5 Å in _α_-carbon positions for residues 93–102), with CDR3_α_ Glu96 undergoing an _α_-carbon
displacement of 11.5 Å. This rearrangement allowed CDR3_α_ to form a _β_-hairpin whose tip engages the HLA-A2 _α_1 helix and p53R175H, thereby optimizing TCR interactions with both MHC and
peptide (Fig. 7f). DISCUSSION The development of T cell-based treatments that target tumor-specific neoantigens has become a central focus for cancer immunotherapy1,2,3,4,5,6,7,8,9.
Neoantigen-directed therapies can be divided into two broad categories: neoantigen vaccines that seek to increase the number of neoantigen-specific T cells in vivo, and neoantigen-directed
cell therapies in which neoantigen-specific T cells are provided to the patient to achieve this objective7. However, just how structurally different a neoantigen must be from its wild-type
counterpart in order to overcome self-tolerance and elicit a T-cell response is not well understood. Bioinformatic profiling of cancer neoepitopes indicates that mutations at anchor
positions which improve peptide binding to MHC molecules are associated with immunogenicity and tumor rejection30,31. However, most mutations in neoepitopes do not involve anchor residues
and do not appreciably affect peptide binding to MHC. The p53R175H neoepitope studied here represents such a case. Detailed comparison of the mutant p53R175H–HLA-A2 and wild-type p53–HLA-A2
structures revealed that their conformations differ only at the P8 mutation site, where one positively charged residue (histidine) replaces another (arginine). This substitution was
sufficient to render the p53R175H peptide immunogenic in cancer patients13,14. Although replacement of histidine by arginine is conservative with respect to charge, these two amino acids
differ markedly with respect to size and shape, which enables TCRs to distinguish between them. Assuming that p53 is expressed in the thymus and that the R175H mutation occurred after thymic
development (i.e., during malignant transformation), the escape of p53R175H-specific T cells from negative selection is most likely explained by low affinity of the TCRs for wild-type p53
peptide. In support of this hypothesis, we were unable to detect any interaction of 12-6, 38-10, and 1a2 with p53–HLA-A2 by SPR, whereas these TCRs bound p53R175H–HLA-A2 with micromolar
_K_Ds, which manifested as an overwhelming preference for histidine over arginine at P8 in T-cell activation assays13,14. These results are consistent with previous structural studies of a
unique melanoma neoepitope arising from a threonine-to-isoleucine mutation in a peptide derived from triose phosphate isomerase that produced only subtle changes in the binding surface for
TCR15,16. Therefore, cancer neoantigens need differ only slightly from their wild-type counterparts for them to be immunogenic in patients. TCRs 12-6, 38-10, and 1a2 achieve high specificity
for p53R175H by concentrating on the driver mutation at the C-terminal portion of the neoepitope, while avoiding extensive interactions with the N-terminal and central portions, which are
shared with wild-type p53. Structural studies of TCR–pMHC complexes involving common V segments and MHC alleles have revealed conservation of specific TCR–MHC interactions32,33,34. These
conserved interactions, which occur between germline-encoded CDR1 and CDR2 loops and MHC, support the hypothesis that the canonical diagonal docking orientation of TCR on MHC, which is
maintained in the TCR–p53R175H–HLA-A2 complexes, is the result of coevolution of TCR and MHC molecules. Surprisingly, however, while matches to at least one germline gene were found for TCRs
12-6, 38-10, and 1a2 among MHC class I-restricted TCRs in the structural database, inspection of the corresponding TCR–pMHC complexes indicated no matches to these TCRs in germline loop
engagement of MHC. This unexpected lack of conserved TCR–MHC interactions applied even to TCRs restricted to HLA-A2, as well as to closely related MHC alleles such as HLA-B7 and HLA-B35.
Therefore, considerably greater flexibility exists for germline-encoded contacts between TCR and MHC than generally appreciated32,33,34, supporting the notion that peptide “editing” can lead
to variability in germline contacts with MHC16,35. This flexibility is exposed in the TCR–p53R175H–HLA-A2 complexes through the unusually high tilt of two of these TCRs over MHC and the
shift of all three TCRs toward the peptide C-terminus relative to other MHC class I-restricted TCRs, a set which already exhibits a peptide C-terminal shift compared to MHC class
II-restricted TCRs36. Also of note, no MHC class I-restricted TCRs were identified in the structural database that used the TRAV38-1 germline gene of TCR 38-10, and none that used the same
TRAV/TRBV gene combinations as 12-6, 38-10, or 1a2. These newly described structures highlight that, in spite of the sizable number of TCR–pMHC complex structures determined to date, many
functional germline interactions and docking geometries likely have yet to be revealed. Considerable efforts have been made to engineer TCRs with improved affinity for cancer-associated
antigens for use in ACT37,38,39. However, large gains in TCR affinity may lead to increased cross-reactivity40, resulting in adverse clinical events41. In a striking case, an
affinity-matured TCR targeting the MAGE-A3 melanoma antigen unexpectedly cross-reacted with an epitope from the muscle protein titin, causing cardiovascular toxicity and deaths42. Such
off-target TCR recognition has prompted new structure-guided efforts to engineer therapeutic TCRs for enhanced specificity while maintaining optimal on-target affinity41. In one promising
approach, the MART-1-specific TCR DMF5 was modified to promote stronger binding to the peptide portion of its pMHC ligand, which resulted in reduced cross-reactivity with MART-1 homologs43.
An attractive feature of p53R175H-specific TCRs such as 12-6, 38-10, and 1a2 is that the parental T cells survived negative selection, thereby minimizing the possibility of cross-reactivity
with self-antigens. However, we do not know whether these TCRs possess optimal on-target affinities. Accordingly, future efforts will be directed at rational design of p53R175H-specific TCRs
to optimize on-target affinity without compromising neoepitope specificity. Alternatively, it was recently demonstrated that antigen-specific TCR function could be enhanced by
structure-based mutations in the V_α_ and V_β_ domains outside the CDR loops that increase the level of cell surface expression44, an approach that could be attempted with the
p53R175H-specific TCRs described here. METHODS PROTEIN PREPARATION The isolation and characterization of p53R175H-specific TCRs 12-6, 38-10, and 1a2 from patients with epithelial cancers
were described previously13,14. Soluble TCRs for affinity measurements and structure determinations were produced by in vitro folding from inclusion bodies expressed in _Escherichia coli_.
Codon-optimized genes encoding the _α_ and _β_ chains of these TCRs (TCR 12-6 residues 1–204 and 1–245; TCR 38-10 residues 1–211 and 1–244; TCR 1a2 residues 1–208 and 1–243, respectively)
were synthesized (Supplementary Table 9) and cloned into the expression vector pET22b (GenScript). An interchain disulfide (C_α_Cys158–C_β_Cys172 in TCR 12-6; C_α_Cys165–C_β_Cys172 in TCR
38-10; C_α_Cys162–C_β_Cys171 in TCR 1a2) was engineered to increase the folding yield of TCR _αβ_ heterodimers. The mutated _α_ and _β_ chains were expressed separately as inclusion bodies
in BL21(DE3) _E. coli_ cells (Agilent Technologies). Bacteria were grown at 37 °C in LB medium to OD600 = 0.6–0.8 and induced with 1 mM isopropyl-_β_-D-thiogalactoside. After incubation for
3 h, the bacteria were harvested by centrifugation and resuspended in 50 mM Tris-HCl (pH 8.0) containing 0.1 M NaCl and 2 mM EDTA. Cells were disrupted by sonication. Inclusion bodies were
washed with 50 mM Tris-HCl (pH 8.0) and 5% (v/v) Triton X-100, then dissolved in 8 M urea, 50 mM Tris-HCl (pH 8.0), 10 mM EDTA, and 10 mM DTT. For in vitro folding, the TCR _α_ (45 mg) and
_β_ (35 mg) chains were mixed and diluted into 1 liter folding buffer containing 5 M urea, 0.4 M L-arginine-HCl, 100 mM Tris-HCl (pH 8.0), 3.7 mM cystamine, and 6.6 mM cysteamine. After
dialysis against 10 mM Tris-HCl (pH 8.0) for 72 h at 4 °C, the folding mixture was concentrated 20-fold and dialyzed against 50 mM MES buffer (pH 6.0) to precipitate most incorrectly folded
protein. Disulfide-linked TCR 12-6, 38-10, and 1a2 heterodimers were purified using sequential Superdex 200 (20 mM Tris-HCl (pH 8.0), 20 mM NaCl) and Mono Q (20 mM Tris-HCl (pH 8.0), 0–1.0 M
NaCl gradient) FPLC columns (GE Healthcare). Soluble HLA-A2 loaded with wild-type p53 peptide (HMTEVVRRC) or mutant p53R175H peptide (HMTEVVRHC) was prepared by in vitro folding. The
HLA-A*0201 heavy chain (residues 1–275) and _β_2-microglobulin (residues 1–99) were produced separately as inclusion bodies in BL21(DE3) _E. coli_ cells transformed by pET26b containing the
corresponding genes (53). Inclusion bodies were dissolved in 8 M urea, 50 mM Tris-HCl (pH 8.0), 10 mM EDTA, and 10 mM DTT. For in vitro folding, the HLA-A*0201 heavy chain (30 mg),
_β_2-microglobulin (30 mg), and wild-type or mutant p53 peptide (20 mg) (GenScript) were mixed and added dropwise to 1 liter of ice-cold folding buffer containing 5 M urea, 0.4 M L-arginine
HCl, 100 mM Tris-HCl (pH 8.0), 5 mM EDTA, 3.7 mM cystamine, and 6.6 mM cysteamine. The folding mixture was dialyzed against distilled water for 24 h and then swapped into 10 mM Tris-HCl (pH
8.0) for 48 h at 4 °C. After concentration, correctly folded p53–HLA-A2 and p53R175H–HLA-A2 were purified using consecutive Superdex 200 (20 mM Tris-HCl (pH 8.0), 20 mM NaCl) and Mono Q
columns (20 mM Tris-HCl (pH 8.0), 0–1.0 M NaCl gradient). To prepare biotinylated HLA-A2, a 17-amino acid tag (GGGLNDIFEAQKIEWHE) was added to the C-terminus of the HLA-A*0201 heavy chain.
The tagged p53–HLA-A2 and p53R175H–HLA-A2 proteins were produced as described above. Biotinylation was carried out using BirA biotin ligase (Avidity). Biotinylated protein was separated from
excess biotin with a Superdex 200 column (50 mM sodium phosphate (pH 7.0), 100 mM NaCl). CRYSTALLIZATION AND DATA COLLECTION For crystallization of TCR–p53R175H–HLA-A2 complexes, TCRs 12-6,
38-10, and 1a2 were each mixed with p53R175H–HLA-A2 in a 1:1 molar ratio and concentrated to 10 mg/ml. Crystals were obtained at room temperature by vapor diffusion in hanging or sitting
drops. The 12-6–p53R175H–HLA-A2 complex crystallized in 20% (w/v) polyacrylic acid 5100, 0.1 M HEPES (pH 7.0), and 0.02 M MgCl2. Crystals of the 38-10–p53R175H–HLA-A2 complex grew in 20%
(w/v) polyethylene glycol (PEG) 3350 and 0.2 M ammonium tartrate dibasic. The 1a2–p53R175H–HLA-A2 complex crystallized in 12% (w/v) PEG 8000 and 0.1 M magnesium acetate. Crystals of unbound
TCR 12-6 were obtained in 18% (w/v) PEG 2000, 0.2 M ammonium sulfate, and 0.1 M MES (pH 6.0). Unbound TCR 1a2 crystallized in 20% PEG 4000, 0.1 M MES (pH 6.0), and 0.2 M lithium sulfate.
Crystals of p53–HLA-A2 and p53R175H–HLA-A2 grew in 15% PEG 8000, 0.1 M Tris-HCl (pH 8.0), and 0.2 M magnesium chloride. Before data collection, all crystals were cryoprotected with 20% (w/v)
glycerol and flash-cooled. X-ray diffraction data for 12-6–p53R175H–HLA-A2, TCR 12-6, and 1a2–p53R175H–HLA-A2 were collected at beamline 23-ID-D of the Advanced Photon Source, Argonne
National Laboratory. Data for p53–HLA-A2, p53R175H–HLA-A2, 38-10–p53R175H–HLA-A2, and TCR 1a2 were collected at beamline 19-BM. Diffraction data were indexed, integrated, and scaled using
the program HKL300045. Data collection statistics are shown in Supplementary Tables 1–3. STRUCTURE DETERMINATION AND REFINEMENT Before structure determination and refinement, all data
reductions were performed using the CCP4 software suite46. Structures were determined by molecular replacement with the program Phaser47 and refined with Phenix48 and Refmac49. The models
were further refined by manual model building with Coot50 based on 2_F_o–_F_c and _F_o–_F_c maps. The _α_ chain of anti-EBV TCR RL42 (PDB accession code 3SJV)51, the _β_ chain of anti-EBV
TCR SB27 (2AK4)52, and NLV–HLA-A2 (5D2L)53 were used as search models with the CDRs and peptide removed to determine the orientation and position of the 12-6–p53R175H–HLA-A2 complex. The
orientation and position parameters of unbound TCR 12-6, p53–HLA-A2, and p53R175H–HLA-A2 were obtained using the corresponding components of the 12-6–p53R175H–HLA-A2 complex. Similarly, the
_α_ chain of an anti-HCV TCR (5YXN), the _β_ chain MART-1-specific TCR DMF4 (3QEQ)54 and p53R175H–HLA-A2 with the CDRs and peptide removed were used as search models to determine the
orientation and position of the 38-10–p53R175H–HLA-A2 complex. The _α_ chain of preproinsulin-specific TCR 1E6 (3UTP)55 and the _β_ chain of Nef-specific TCR T36-5 (3VXT)56 with the CDRs
removed were used as search models for molecular replacement to determine the structure of TCR 1a2. The structure of the 1a2–p53R175H–HLA-A2 complex was solved using TCR 1a2 and
p53R175H–HLA-A2 as search models. Refinement statistics are summarized in Supplementary Tables 1–3. Contact residues were identified with the CONTACT program46 and were defined as residues
containing an atom 4.0 Å or less from a residue of the binding partner. The PyMOL program (https://pymol.org/) was used to prepare figures. SURFACE PLASMON RESONANCE ANALYSIS The interaction
of TCRs 12-6, 38-10, and 1a2 with p53–HLA-A2 and p53R175H–HLA-A2 was assessed by surface plasmon resonance (SPR) using a BIAcore T100 biosensor at 25 °C. Biotinylated p53–HLA-A2 or
p53R175H–HLA-A2 was immobilized on a streptavidin-coated BIAcore SA chip (GE Healthcare) at 3000 resonance units (RU). The remaining streptavidin sites were blocked with 20 μM biotin
solution. An additional flow cell was injected with free biotin alone to serve as a blank control. For analysis of TCR binding, solutions containing different concentrations of 12-6, 38-10,
or 1a2 were flowed sequentially over chips immobilized with p53–HLA-A2, p53R175H–HLA-A2, or the blank. Both equilibrium and kinetic data were fitted with a 1:1 binding model using BIA
evaluation 3.1 software. COMPUTATIONAL STRUCTURAL ANALYSIS Previously determined structures of TCR complexes and their binding parameters were obtained from TCR3d
(https://tcr3d.ibbr.umd.edu)29. The set of 151 MHC class I complex structures from TCR3d was filtered to retain only complexes with _αβ_TCRs, and to remove redundant complexes with identical
TCR CDR loop and epitope sequences; this resulted in a set of 133 complex structures that was used for comparisons of docking orientations, positions, and contacts. Calculation of docking
and incident angles was performed as previously described22. Calculation of ΔΔ_G_ for peptide point mutations was performed using Rosetta (release 2019.45), following a previously reported
computational mutagenesis protocol27. This protocol was executed as a Rosetta Script, for which the code is available on Github on the Kortemme Lab ddg repository
(https://github.com/Kortemme-Lab/ddg/), as part of the “alanine-scanning” protocol capture. The updated “REF15” scoring function in Rosetta57 was used for packing and minimization during
computational mutagenesis, and interaction ΔΔ_G_ were calculated with Rosetta’s “interface” weights. Calculations of solvent-accessible surface areas were performed using the naccess program
(http://wolf.bms.umist.ac.uk/naccess/). _S_c shape complementarity values were computed by the “sc” program in the CCP4 suite46. CALCULATION OF TCR CENTERS TCR–pMHC complexes were oriented
into a common reference frame centered at average C_α_ atom position of MHC helices, with helix residues as defined previously21, and rotated such that the _x_–_y_ plane is parallel with the
helices, and the _x_-axis is parallel to peptide groove, with greater _x_ value corresponding to peptide C-terminus. Complex structures in this reference frame are downloadable from the
TCR3d database (https://tcr3d.ibbr.umd.edu/downloads). TCR variable domain centers were calculated by taking centers of individual variable domains by average positions of S_γ_ atoms of
conserved Cys residues (or C_α_ atoms at corresponding positions where Cys residues are not present in the TCR), and then calculating the mean position of TCR V_α_ and V_β_ centers. _X_
position (_x_ pos) and _y_ position (_y_ pos) values represent projections into the _x_–_y_ plane, and thus the MHC plane, of these centers. REPORTING SUMMARY Further information on research
design is available in the Nature Research Reporting Summary linked to this article. DATA AVAILABILITY Atomic coordinates and structure factors have been deposited in the Protein Data Bank
under accession codes 6VR1 (p53–HLA-A2), 6VR5 (p53R175H–HLA-A2), 6VRM (TCR 12-6–p53R175H–HLA-A2), 6VRN (TCR 38-10–p53R175H–HLA-A2), 6VQO (TCR 1a2–p53R175H–HLA-A2), 6VTH (TCR 12-6), and 6VTC
(TCR 1a2). Source data are provided with this paper. Other data are available from the corresponding author upon reasonable request. REFERENCES * Rosenberg, S. A. & Restifo, N. P.
Adoptive cell transfer as personalized immunotherapy for human cancer. _Science_ 348, 62–68 (2015). Article ADS CAS PubMed PubMed Central Google Scholar * Tran, E. et al. T-cell
transfer therapy targeting mutant KRAS in cancer. _N. Engl. J. Med._ 375, 2255–2262 (2016). Article CAS PubMed PubMed Central Google Scholar * Zacharakis, N. et al. Immune recognition
of somatic mutations leading to complete durable regression in metastatic breast cancer. _Nat. Med._ 24, 724–730 (2018). Article CAS PubMed PubMed Central Google Scholar * Stevanović,
S. et al. Landscape of immunogenic tumor antigens in successful immunotherapy of virally induced epithelial cancer. _Science_ 356, 200–205 (2017). Article ADS PubMed PubMed Central CAS
Google Scholar * Tran, E. et al. Cancer immunotherapy based on mutation-specific CD4+ T cells in a patient with epithelial cancer. _Science_ 344, 641–645 (2014). Article ADS CAS PubMed
PubMed Central Google Scholar * Dudley, M. E. et al. Randomized selection design trial evaluating CD8+-enriched versus unselected tumor-infiltrating lymphocytes for adoptive cell therapy
for patients with melanoma. _J. Clin. Oncol._ 31, 2152–2159 (2013). Article CAS PubMed PubMed Central Google Scholar * Schumacher, T. N., Scheper, W. & Kvistborg, P. Cancer
neoantigens. _Annu. Rev. Immunol._ 37, 173–200 (2019). Article CAS PubMed Google Scholar * Parkhurst, M. R. et al. Unique neoantigens arise from somatic mutations in patients with
gastrointestinal cancer. _Cancer Disco._ 9, 1022–1035 (2019). Article Google Scholar * McGranahan, N. & Swanton, C. Neoantigen quality, not quantity. _Sci. Transl. Med._ 11, eaax7918
(2019). Article PubMed CAS Google Scholar * Sabapathy, K. & Lane, D. P. Therapeutic targeting of p53: all mutants are equal but some mutants are more equal than others. _Nat. Rev.
Clin. Oncol._ 15, 13–30 (2018). Article CAS PubMed Google Scholar * Gao, J. et al. Integrative analysis of complex cancer genomics and clinical profiles using the cBioPortal. _Sci.
Signal._ 6, pl1 (2013). Article PubMed PubMed Central CAS Google Scholar * Zehir, A. et al. Mutational landscape of metastatic cancer revealed from prospective clinical sequencing of
10,000 patients. _Nat. Med._ 23, 703–713 (2017). Article CAS PubMed PubMed Central Google Scholar * Malekzadeh, P. et al. Neoantigen screening identifies broad TP53 mutant
immunogenicity in patients with epithelial cancers. _J. Clin. Invest._ 129, 1109–1114 (2019). Article PubMed Google Scholar * Lo, W. et al. Immunologic recognition of a shared p53 mutated
neoantigen in a patient with metastatic colorectal cancer. _Cancer Immunol. Res._ 7, 534–543 (2019). Article CAS PubMed PubMed Central Google Scholar * Deng, L. et al. Structural basis
for the recognition of mutant self by a tumor-specific, MHC class II-restricted T cell receptor. _Nat. Immunol._ 8, 398–408 (2007). Article CAS PubMed Google Scholar * Deng, L.,
Langley, R. J., Wang, Q., Topalian, S. L. & Mariuzza, R. A. Structural insights into the editing of germ-line-encoded interactions between T-cell receptor and MHC class II by V_α_ CDR3.
_Proc. Natl Acad. Sci. USA_ 109, 14960–14965 (2012). Article ADS CAS PubMed PubMed Central Google Scholar * Chen, J. L. et al. Structural and kinetic basis for heightened
immunogenicity of T cell vaccines. _J. Exp. Med._ 201, 1243–1255 (2005). Article CAS PubMed PubMed Central Google Scholar * Borbulevych, O. Y., Santhanagopolan, S. M., Hossain, M. &
Baker, B. M. TCRs used in cancer gene therapy cross-react with MART-1/Melan-A tumor antigens via distinct mechanisms. _J. Immunol._ 187, 2453–2463 (2011). Article CAS PubMed Google
Scholar * Yin, Y., Li, Y. & Mariuzza, R. A. Structural basis for self-recognition by autoimmune T-cell receptors. _Immunol. Rev._ 250, 32–48 (2012). Article PubMed CAS Google Scholar
* Drijfhout, J. W., Brandt, R. M. P., D’Amaro, J., Kast, W. M. & Melief, C. J. M. Detailed motifs for peptide binding to HLA-A*0201 derived from large random sets of peptides using a
cellular binding assay. _Hum. Immunol._ 43, 1–12 (1995). Article CAS PubMed Google Scholar * Rudolph, M. G., Stanfield, R. L. & Wilson, I. A. How TCRs bind MHCs, peptides, and
coreceptors. _Annu. Rev. Immunol._ 24, 419–466 (2006). Article CAS PubMed Google Scholar * Pierce, B. G. & Weng, Z. A flexible docking approach for prediction of T cell
receptor-peptide-MHC complexes. _Protein Sci._ 22, 35–46 (2013). Article CAS PubMed Google Scholar * Gras, S. et al. Reversed T cell receptor docking on a major histocompatibility class
I complex limits involvement in the immune response. _Immunity_ 45, 749–760 (2016). Article CAS PubMed Google Scholar * Adams, J. J. et al. T cell receptor signaling is limited by
docking geometry to peptide-major histocompatibility complex. _Immunity_ 35, 681–693 (2011). Article CAS PubMed PubMed Central Google Scholar * Rossjohn, J. et al. T cell antigen
receptor recognition of antigen-presenting molecules. _Annu. Rev. Immunol._ 33, 169–200 (2015). Article CAS PubMed Google Scholar * Kellogg, E. H., Leaver-Fay, A. & Baker, D. Role of
conformational sampling in computing mutation-induced changes in protein structure and stability. _Proteins_ 79, 830–838 (2011). Article CAS PubMed Google Scholar * Kortemme, T., Kim,
D. E. & Baker, D. Computational alanine scanning of protein-protein interfaces. _Sci. STKE_ 2004, p12 (2004). Google Scholar * Pierce, B. G. et al. Computational design of the affinity
and specificity of a therapeutic T cell receptor. _PLoS Comput. Biol._ 10, e1003478 (2014). Article PubMed PubMed Central CAS Google Scholar * Gowthaman, R. & Pierce, B. G. TCR3d:
the T cell receptor structural repertoire database. _Bioinformatics_ 35, 5323–5325 (2019). Article PubMed PubMed Central Google Scholar * Duan, F. et al. Genomic and bioinformatic
profiling of mutational neoepitopes reveals new rules to predict anticancer immunogenicity. _J. Exp. Med._ 211, 2231–2248 (2014). Article PubMed PubMed Central Google Scholar * Fritsch,
E. F. et al. HLA-binding properties of tumor neoepitopes in humans. _Cancer Immunol. Res._ 2, 522–529 (2014). Article CAS PubMed PubMed Central Google Scholar * Feng, D., Bond, C. J.,
Ely, L. K., Maynard, J. & Garcia, K. C. Structural evidence for a germline-encoded T cell receptor-major histocompatibility complex interaction ‘codon’. _Nat. Immunol._ 8, 975–983
(2007). Article CAS PubMed Google Scholar * Marrack, P., Scott-Browne, J. P., Dai, S., Gapin, L. & Kappler, J. W. Evolutionarily conserved amino acids that control TCR-MHC
interaction. _Annu. Rev. Immunol._ 26, 171–203 (2008). Article CAS PubMed PubMed Central Google Scholar * Adams, J. J. et al. Structural interplay between germline interactions and
adaptive recognition determines the bandwidth of TCR-peptide-MHC cross-reactivity. _Nat. Immunol._ 17, 87–94 (2016). Article CAS PubMed Google Scholar * Garcia, K. C., Adams, J. J.,
Feng, D. & Ely, L. K. The molecular basis of TCR germline bias for MHC is surprisingly simple. _Nat. Immunol._ 10, 143–147 (2009). Article CAS PubMed PubMed Central Google Scholar *
Singh, N. K. et al. Geometrical characterization of T cell receptor binding modes reveals class-specific binding to maximize access to antigen. _Proteins_ 88, 503–513 (2020). Article CAS
PubMed Google Scholar * Holler, P. D. et al. In vitro evolution of a T cell receptor with high affinity for peptide/MHC. _Proc. Natl Acad. Sci. USA_ 97, 5387–5392 (2000). Article ADS CAS
PubMed PubMed Central Google Scholar * Li, Y. et al. Directed evolution of human T-cell receptors with picomolar affinities by phage display. _Nat. Biotechnol._ 23, 349–354 (2005).
Article ADS CAS PubMed Google Scholar * Liddy, N. et al. Monoclonal TCR-redirected tumor cell killing. _Nat. Med._ 18, 980–987 (2012). Article CAS PubMed Google Scholar * Holler, P.
D., Chlewicki, L. K. & Kranz, D. M. TCRs with high affinity for foreign pMHC show self-reactivity. _Nat. Immunol._ 4, 55–62 (2003). Article CAS PubMed Google Scholar * Bentzen, A.
K. & Hadrup, S. R. T-cell-receptor recognition strategies to select safer T-cell receptors for clinical translation. _Immuno-Oncol. Technol._ 2, 1–10 (2019). Article Google Scholar *
Linette, G. P. et al. Cardiovascular toxicity and titin cross-reactivity of affinity-enhanced T cells in myeloma and melanoma. _Blood_ 122, 863–871 (2013). Article CAS PubMed PubMed
Central Google Scholar * Hellman, L. M. et al. Improving T cell receptor on-target specificity via structure-guided design. _Mol. Ther._ 27, 300–313 (2019). Article CAS PubMed Google
Scholar * Thomas, S. et al. Framework engineering to produce dominant T cell receptors with enhanced antigen-specific function. _Nat. Commun._ 10, 4451 (2019). Article ADS PubMed PubMed
Central CAS Google Scholar * Minor, W., Cymborowski, M., Otwinowski, Z. & Chruszcz, M. HKL-3000: the integration of data reduction and structure solution—from diffraction images to an
initial model in minutes. _Acta Crystallogr. D. Biol. Crystallogr._ 62, 859–866 (2006). Article PubMed CAS Google Scholar * Collaborative Computational Project No. 4. The CCP4 suite:
programs for protein crystallography. _Acta Crystallogr. D. Biol. Crystallogr._ 50, 240–255 (1994). Google Scholar * Storoni, L. C., McCoy, A. J. & Read, R. J. Likelihood-enhanced fast
rotation functions. _Acta Crystallogr. D. Biol. Crystallogr._ 60, 432–438 (2004). Article PubMed CAS Google Scholar * Afonine, P. V. et al. Towards automated crystallographic structure
refinement with phenix.refine. _Acta Crystallogr. D. Biol. Crystallogr._ 68, 352–367 (2012). Article CAS PubMed PubMed Central Google Scholar * Murshudov, G. N., Vagin, A. A. &
Dodson, E. J. Refinement of macromolecular structures by the maximum-likelihood method. _Acta Crystallogr. D. Biol. Crystallogr._ 53, 240–255 (1997). Article CAS PubMed Google Scholar *
Emsley, P., Lohkamp, B., Scott, W. G. & Cowtan, K. Features and development of Coot. _Acta Crystallogr. D. Biol. Crystallogr._ 66, 486–501 (2010). Article CAS PubMed PubMed Central
Google Scholar * Gras, S. et al. A structural basis for varied _αβ_ TCR usage against an immunodominant EBV antigen restricted to a HLA-B8 molecule. _J. Immunol._ 188, 311–321 (2012).
Article CAS PubMed Google Scholar * Tynan, F. E. et al. T cell receptor recognition of a ‘super-bulged’ major histocompatibility complex class I-bound peptide. _Nat. Immunol._ 6,
1114–1122 (2005). Article CAS PubMed Google Scholar * Yang, X. et al. Structural basis for clonal diversity of the public T cell response to a dominant human cytomegalovirus epitope. _J.
Biol. Chem._ 290, 29106–29119 (2015). Article CAS PubMed PubMed Central Google Scholar * Borbulevych, O. Y., Santhanagopolan, S. M., Hossain, M. & Baker, B. M. TCRs used in cancer
gene therapy cross-react with MART-1/Melan-A tumor antigens via distinct mechanisms. _J. Immunol._ 87, 2453–2463 (2011). Article Google Scholar * Bulek, A. M. et al. Structural basis for
the killing of human _β_ cells by CD8+ T cells in type 1 diabetes. _Nat. Immunol._ 13, 283–289 (2012). Article CAS PubMed PubMed Central Google Scholar * Shimizu, A. et al. Structure of
TCR and antigen complexes at an immunodominant CTL epitope in HIV-1 infection. _Sci. Rep._ 3, 3097 (2013). Article PubMed PubMed Central Google Scholar * Alford, R. F. et al. The
Rosetta all-atom energy function for macromolecular modeling and design. _J. Chem. Theory Comput._ 13, 3031–3048 (2017). Article CAS PubMed PubMed Central Google Scholar Download
references ACKNOWLEDGEMENTS This work was supported by National Institutes of Health Grants GM126299 (to B.G.P.) and AI129893 (to R.A.M.). We thank Alexander Kolesnikov and Arjun Mishra for
assistance with vector design and X-ray data collection, respectively. We also thank Paul F. Robbins and Steven A. Rosenberg (National Cancer Institute) for valuable discussions, as well as
Drew C. Deniger (National Cancer Institute) for providing the corrected amino acid sequence of the TCR 1a2 _α_ chain. Results in this report are based on work performed at both Structural
Biology Center and GM/CA beamlines at the Advanced Photon Source of Argonne National Laboratory, operated by UChicago Argonne, LLC, for the U.S. Department of Energy, Office of Biological
and Environmental Research under contract DE-AC02-06CH11357. Identification of commercial materials and equipment does not imply recommendation nor endorsement by the National Institute of
Standards and Technology, nor does it imply that the material or equipment identified is the best available for the purpose. AUTHOR INFORMATION AUTHORS AND AFFILIATIONS * W.M. Keck
Laboratory for Structural Biology, University of Maryland Institute for Bioscience and Biotechnology Research, Rockville, MD, 20850, USA Daichao Wu, D. Travis Gallagher, Ragul Gowthaman,
Brian G. Pierce & Roy A. Mariuzza * Department of Histology and Embryology, Hengyang Medical College, University of South China, Hengyang, Hunan, 421001, China Daichao Wu * Department of
Cell Biology and Molecular Genetics, University of Maryland, College Park, MD, 20742, USA Daichao Wu, Ragul Gowthaman, Brian G. Pierce & Roy A. Mariuzza * National Institute of
Standards and Technology, Gaitherburg, MD, 20899, USA D. Travis Gallagher Authors * Daichao Wu View author publications You can also search for this author inPubMed Google Scholar * D.
Travis Gallagher View author publications You can also search for this author inPubMed Google Scholar * Ragul Gowthaman View author publications You can also search for this author inPubMed
Google Scholar * Brian G. Pierce View author publications You can also search for this author inPubMed Google Scholar * Roy A. Mariuzza View author publications You can also search for this
author inPubMed Google Scholar CONTRIBUTIONS D.W., D.T.G. and R.G. performed the experiments and data analyses. B.G.P. and R.A.M. conceived and supervised the project. All authors prepared
the paper. CORRESPONDING AUTHOR Correspondence to Roy A. Mariuzza. ETHICS DECLARATIONS COMPETING INTERESTS The authors declare no competing interests. ADDITIONAL INFORMATION PEER REVIEW
INFORMATION _Nature Communications_ thanks Erin Adams and the other, anonymous, reviewer(s) for their contribution to the peer review of this work. Peer reviewer reports are available.
PUBLISHER’S NOTE Springer Nature remains neutral with regard to jurisdictional claims in published maps and institutional affiliations. SUPPLEMENTARY INFORMATION SUPPLEMENTARY INFORMATION
PEER REVIEW FILE REPORTING SUMMARY SOURCE DATA SOURCE DATA RIGHTS AND PERMISSIONS OPEN ACCESS This article is licensed under a Creative Commons Attribution 4.0 International License, which
permits use, sharing, adaptation, distribution and reproduction in any medium or format, as long as you give appropriate credit to the original author(s) and the source, provide a link to
the Creative Commons license, and indicate if changes were made. The images or other third party material in this article are included in the article’s Creative Commons license, unless
indicated otherwise in a credit line to the material. If material is not included in the article’s Creative Commons license and your intended use is not permitted by statutory regulation or
exceeds the permitted use, you will need to obtain permission directly from the copyright holder. To view a copy of this license, visit http://creativecommons.org/licenses/by/4.0/. Reprints
and permissions ABOUT THIS ARTICLE CITE THIS ARTICLE Wu, D., Gallagher, D.T., Gowthaman, R. _et al._ Structural basis for oligoclonal T cell recognition of a shared p53 cancer neoantigen.
_Nat Commun_ 11, 2908 (2020). https://doi.org/10.1038/s41467-020-16755-y Download citation * Received: 02 March 2020 * Accepted: 19 May 2020 * Published: 09 June 2020 * DOI:
https://doi.org/10.1038/s41467-020-16755-y SHARE THIS ARTICLE Anyone you share the following link with will be able to read this content: Get shareable link Sorry, a shareable link is not
currently available for this article. Copy to clipboard Provided by the Springer Nature SharedIt content-sharing initiative