- Select a language for the TTS:
- UK English Female
- UK English Male
- US English Female
- US English Male
- Australian Female
- Australian Male
- Language selected: (auto detect) - EN
Play all audios:
ABSTRACT Bacterial nucleoid remodeling dependent on conserved histone-like protein, HU is one of the determining factors in global gene regulation. By imaging of near-native, unlabeled _E.
coli_ cells by soft X-ray tomography, we show that HU remodels nucleoids by promoting the formation of a dense condensed core surrounded by less condensed isolated domains. Nucleoid
remodeling during cell growth and environmental adaptation correlate with pH and ionic strength controlled molecular switch that regulated HUαα dependent intermolecular DNA bundling. Through
crystallographic and solution-based studies we show that these effects mechanistically rely on HUαα promiscuity in forming multiple electrostatically driven multimerization interfaces.
Changes in DNA bundling consequently affects gene expression globally, likely by constrained DNA supercoiling. Taken together our findings unveil a critical function of HU–DNA interaction in
nucleoid remodeling that may serve as a general microbial mechanism for transcriptional regulation to synchronize genetic responses during the cell cycle and adapt to changing environments.
SIMILAR CONTENT BEING VIEWED BY OTHERS THE ENVIRONMENTALLY-REGULATED INTERPLAY BETWEEN LOCAL THREE-DIMENSIONAL CHROMATIN ORGANISATION AND TRANSCRIPTION OF _PROVWX_ IN _E. COLI_ Article Open
access 17 November 2023 THE NUCLEOID OF RAPIDLY GROWING ESCHERICHIA COLI LOCALIZES CLOSE TO THE INNER MEMBRANE AND IS ORGANIZED BY TRANSCRIPTION, TRANSLATION, AND CELL GEOMETRY Article Open
access 20 April 2025 TRANSCRIPTION-DEPENDENT DOMAIN-SCALE THREE-DIMENSIONAL GENOME ORGANIZATION IN THE DINOFLAGELLATE _BREVIOLUM MINUTUM_ Article Open access 29 April 2021 INTRODUCTION
Nucleoid remodeling facilitated by DNA organization activities of nucleoid-associated proteins (NAPs) is one of the determining factors of global gene regulation1,2,3,4. HU is among the most
conserved and abundant NAPs in eubacteria and has major role in the nucleoid structure5 (Supplementary Figure 1a). Mutations or the deletion of HU transform the _Escherichia coli_ nucleoid
to different forms and alter transcription program6,7,8. HU causes gene expression changes by modulating the 3D arrangement of DNA at different length scales within the nucleoid; by
facilitating DNA looping in a promoter region, trapping free supercoils, indirectly altering supercoiling through DNA topoisomerases, or perhaps by promoting long-range DNA–DNA
contacts6,7,9,10. As opposed to other NAPs (H-NS, Fis, and IHF) that are specifically localized within the nucleoid due to DNA sequence-specific binding, HU is largely scattered throughout
the whole nucleoid owing to its non-sequence-specific DNA binding11,12. Although HU binds DNA regardless of the sequence it exhibits two DNA-binding modes. It binds with low-affinity to
linear DNA through a phosphate lock mechanism but binds damaged (kinked) or cruciform DNA specifically with high affinity through its long β-ribbon arms13,14. High-affinity sites are
presumably much fewer in the _E. coli_ chromosome and HU mostly interacts with chromosomal DNA through low-affinity binding. In _E. coli_, HU exists as homo- or heterodimers of HUα and HUβ
subunits. Owing to differential expression and stability of the two subunits during _E. coli_ growth cycle, HUαα predominates in the growth phase, whereas HUαβ in the stationary phase15,
pointing to distinct roles of HUαα and HUαβ in nucleoid architecture and gene expression during growth and stasis, respectively. We have previously shown that the non-sequence-specific
DNA-binding mode of HU causes bundling of independent DNA strands through HUαα–HUαα multimerization that is maintained by a zipper-like network of hydrogen bonds of highly ionized amino
acids7. However, whether HU-mediated DNA bundling depends on environmental changes and growth conditions remained unclear. In this study, we provide a holistic view of the molecular
connections between HU–DNA interactions and the nucleoid architecture as it correlates to global regulation of bacterial gene expression during growth, stasis and under stress. Using an
X-ray based imaging technique called soft X-ray tomography (SXT)16, we characterized the higher-order _E. coli_ nucleoid organization in near-native state and revealed an effect of HU
surface charges in its overall remodeling during cell growth and environmental adaptation. To define the mechanistic basis of these cellular consequences, we determined the overall
organization of HUαα nucleoprotein complexes in solution by small-angle X-ray scattering (SAXS). We find that HUαα organizes DNA differently at different ionic strengths and pHs. By means of
macromolecular crystallography (MX), we additionally elucidate HUαα-dependent molecular switches that modulate the DNA organization. Finally, by means of next-generation RNA sequencing
(RNA-Seq), we find a link between the nucleoid remodeling and changes in global transcription. This integrative structural study explains how HU can regulate dynamic transformations during
nucleoid remodeling as it correlates to global gene regulation. RESULTS NUCLEOID REMODELING DURING _E. COLI_ GROWTH, STASIS, AND UNDER STRESS To determine how HU regulates _E. coli_ nucleoid
architecture during bacterial growth phases and under stress conditions, we imaged wild-type cells (WT) under normal (pH ~7) and acidic (pH ~5) growth conditions as well HUα mutant
(HUαE34K) using SXT. Glu34 was previously identified to be critical to hydrogen bond formation for HUαα–HUαα multimerization that maintains HUαα/DNA nucleoprotein complexes in vitro7. SXT is
a high-resolution (60 nm or higher) imaging method that can be applied to fully hydrated, cryo-fixed, and unstained cells in their most native state16,17. X-ray absorbance is measured
within the “water window” (284–543 eV) where biological materials with differential carbon and nitrogen based composition absorb X-rays an order of magnitude more than the surrounding water.
This absorption follows the Beer-Lambert law wherein the photon absorption is linear and a function of the biochemical composition at each spatial position in the cell, generating a unique
Linear Absorption coefficient (LAC) measurement for each voxel (3D pixel)16,17. Sub-cellular structures are observed non-invasively and segmented based on their LAC differences allowing 3D
visualization of their spatial organization (Supplementary Figure 1b). The reproducible and quantitative capabilities of SXT LAC measurements have been previously shown and were successfully
utilized in segmenting eukaryotic cells17. In contrast to the segmentation of sub-structures in eukaryotic cells, lack of membrane-bound organelles makes it challenging to resolve distinct
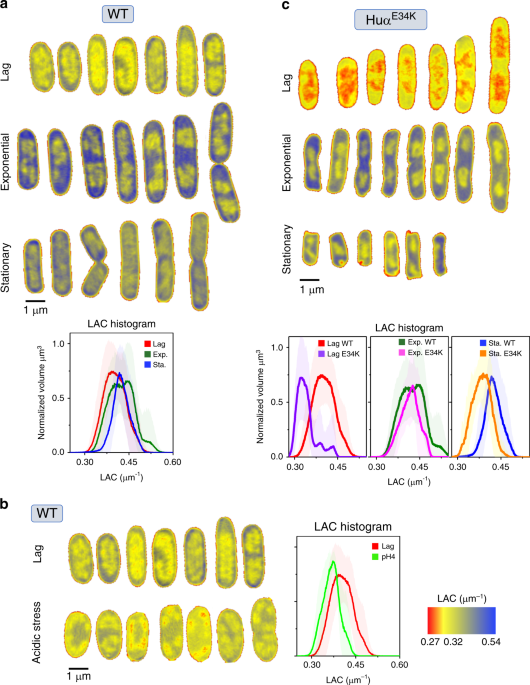
regions in bacterial cells. Nevertheless, our computer-generated SXT orthoslices (virtual sections) through the WT _E. coli_ cells at 60 nm resolution revealed a region of low-LAC with
less-bioorganic material (yellow, less condensed) surrounded by a region of high-LAC with more bioorganic material (blue, more condensed) (Fig. 1a). In agreement with conventional
fluorescence imaging results, the less-condensed material correlates with the distribution of HU and thus corresponds to the nucleoid12,18. The cell periphery enriched in ribosomes12,19
corresponds to the condensed biomaterial in our SXT imaging and results in LAC values > 0.4 μm−1. The SXT orthoslices of the cells in the lag phase (Fig. 1a) showed a diffused nucleoid
region. A histogram of LAC values of the WT cells harvested in the lag phase (OD600 0.2) showed a broad distribution with the maxima at ~0.39 μm−1 (Fig. 1a). On the other hand, significant
separation of the nucleoid region from cell periphery in the exponential growth phase (OD600 ~0.5) indicated distinct segmentation of the nucleoid from the cytosol (Fig. 1a). This phase
separation was reflected by two maxima in LAC histogram (Fig. 1a, lower panel). WT cells in stationary phase showed more-condensed nucleoid region with a significant shift in the LAC
histogram towards higher values with maxima at ~0.41 μm−1 (Fig. 1a, lower panel) and showed phase separation of nucleoid region. The physical basis of the phase separation emerges by
visualization of the 3D reconstruction of the nucleoid region segmented and color-coded based on SXT LAC values. Spatially, the higher-order organization of the nucleoid into distinct
domains is akin to the nucleoid macrodomains organization (Fig. 2b, and Supplementary Movie 1)10,20 where domains appear physically insulated from each other (Fig. 2b and Supplementary
Figure 1b). Although, localization of the macrodomains, namely _ori_, _left_, _right,_ and _ter_ cannot be readily achieved with SXT alone, this first high-resolution near-native
visualization of the bacterial nucleoid is consistent with the established global organization of the bacterial chromatin (reviewed in ref. 21). The 3D reconstructions of the WT cells showed
a region with high-bioorganic content located at the center of the cell called here as “nucleoid core” (Fig. 2a, b). The macrodomain architecture of individual chromatin arms varied within
a dividing cell and between different cells in similar growth phase (Fig. 2b and Supplementary Figure 1b) indicating dynamic rearrangements of the nucleoid during the cell cycle as suggested
previously12,18,22. Despite the dissimilarity in the macrodomain arrangement, the nucleoid material in the lag and exponential phases adopt well-segmented interconnected regions separated
from the cytosolic material (Fig. 2b). Interconnected regions are easily seen after volume skeletonization (see Methods), whereas distinct domains are absent in the stationary phase (Fig. 2b
and Supplementary Movie 1). Under acidic stress (buffered at ~pH 5) WT _E. coli_ cells had significantly longer generation times and reached a final OD600 of only ~0.2 similar to lag phase
of WT _E. coli_ cells grown in normal pH (pH ~7) after 4 hours of growth (Supplementary Figure 1c). Interestingly, the nucleoid region under acidic stress, appeared less-condensed compared
with WT _E. coli_ cells grown in normal pH as shown by SXT orthoslices and a shift to lower LAC values in the LAC histogram (Fig. 1b). Although the overall morphology of the segmented
macrodomains that surrounded the condensed core remained similar to the lag phase WT _E. coli_ cells grown in normal pH, the 3D reconstructions showed bulkier cells with diffused borders
between the nucleoid region and the cytosolic material (Fig. 3a). The pH-dependent nucleoid remodeling prompted us to evaluate the _E. coli_ mutant strain—HUαE34K with mutation of an ionized
HUα surface residue critical to HUαα–HUαα multimerization in vitro7 for effects on the nucleoid architecture. The mutant HUαE34K strain had similar growth rate as WT _E. coli_ cell at
normal pH (Supplementary Figure 1c) while the cell morphology of HUαE34K cells appeared different from WT _E. coli_ cells in exponential and stationary phase (Fig. 1a, c). Orthoslices of
HUαE34K cells in the lag phase showed less-condensed nucleoid region than WT _E. coli_ cells grown at normal pH with some recovery of condensation in exponential and stationary phase (Fig.
1c). Although, lag phase LAC histogram of HUαE34K cells showed a striking shift to lower LAC values with maxima ~0.32 μm−1 similar to WT _E. coli_ cells under acidic stress (Fig. 1c, lower
panel), 3D reconstructions showed that the nucleoid organization in HUαE34K cells is distinct from WT _E. coli_ cells under acidic stress (Fig. 3b). The distinct phase separation evident as
two maxima in the exponential phase LAC histogram of WT _E. coli_ cells in normal pH was not seen in HUαE34K cells, whereas there was shift to lower LAC values in the stationary phase LAC
histogram (Fig. 1c, lower panel). The remodeling of the nucleoid core in the HUαE34K cells regardless of the growth phase suggested that HUα is possibly also relevant in maintaining the
nucleoid core in addition to the overall nucleoid organization (Fig. 3b). This nucleoid remodeling in HUαE34K cells suggest that the HUα dependent long-range DNA–DNA contacts identified
previously10 were disrupted, presumably as a consequence of direct effect on HUαα multimerization. HUΑΑ SURFACE CHARGE REGULATES DNA BUNDLING To understand the mechanism of the HU-dependent
cellular outcome of nucleoid remodeling, we characterized the HUαα nucleoprotein complexes in solution by SAXS (Fig. 4). We measured SAXS of HUαα in complex with 80 base pair (bp) DNA of
random sequence to understand its overall organization under varied pH and salt concentrations. We deduced that at pH 4.5 and 5.5, HUαα-80bp DNA readily self-assembled into ordered lamellar
structures leading to DNA bundling evident by an initial slope of q−2,23 and distinct diffraction peaks in the 1D-SAXS profile (Fig. 4a, b and Supplementary Figure 2a, b). We fit the
scattering patterns as a random lamellar phase (sheet) with Caille structure factor (see Methods). The presence of the diffraction peak indicated that the physiological salt concentration of
150 mm NaCl supported lamellar assembly at pH 4.5 (Fig. 4a). This assembly with DNA spacing of 42 Å transformed into a filament-like nucleoprotein assembly at 300 mm NaCl concentration
(Fig. 4a and Supplementary 2a). We further observed that at pH 5.5, the spacing between the parallel DNAs shifted from 42 Å to 70 Å or 60 Å (Fig. 4b) with a decrease in ionic strength.
Further increase in the pH to 6.5 abolished the formation of lamellar structures with the exception at a sub-physiological salt concentration of 50 mm NaCl (Fig. 4c, d and Supplementary
Figure 2c, d). Atomistic models of HUαα-80bp DNA filaments matched the length of ~270 Å defined by the pair distribution function (P(r)) (Supplementary Figure 2e, f) and agreed well with the
experimental SAXS data (Fig. 3a and Supplementary Table 2). Our previous mutational analysis7 together with pH-dependent altering of HUαα–DNA interactions reported here, suggested that HUαα
surface electrostatic dictates the hydrogen bond network critical to HUαα–HUαα multimerization that controls DNA bundling (Fig. 4e). To test this hypothesis, we measured SAXS of HUα surface
residue mutant, HUαE34K in complex with 80 base pair (bp) DNA at different pH. We found that the positively charged HUαE34K mutation disrupted DNA bundling in a protein
concentration-independent manner and led to the formation of filament-like nucleoprotein structures at pH 6.5, 7.5, and aggregations at pH 5.5, 4.5 with no diffraction peaks (Fig. 4f). The
uniform separation of HUαE34KαE34K dimers on DNA at low protein concentration (<2x dimers per 80 bp DNA) appeared as a distinct shoulder in the P(r) function at ~75 Å spacing
(Supplementary Figure 3a) and indicates lack of HU-HU multimerization on the DNA. At higher protein concentration (>4× dimers per 80 bp DNA) P(r) shoulder disappears, suggesting
HUαE34KαE34K covers the DNA completely. Indeed, atomistic models of HUαE34KαE34K covering the entire length of the DNA agreed with the SAXS data of the complex with no evidence for bridging
or bundling of DNAs (Fig. 4f). Collectively, our SAXS analysis provided support for the critical importance of HUαα surface charge in DNA bundling that manifests into the mesoscale as
nucleoid remodeling. MOLECULAR SWITCH IN HUΑΑ COUPLING ALTERS DNA BUNDLING In order to elucidate the molecular-level mechanism that alters the DNA bundling, we determined crystal structures
of HUαα in complex with 19 bp DNA of random sequence at pH ~4.5 and ~5.5 and low ionic strength (~100–150 mm NaCl) (Fig. 5a, b; Supplementary Figure 4a, b and Supplementary Table 1).
Structures at both pH showed linear DNA conformation across the HU α-helical “body” (Fig. 5a, b and Supplementary 4a,b) rather than the bent DNA conformation between extended β-ribbon “arms”
of HUαα seen with structurally specific DNA interactions14 (Fig. 5a-inset). Moreover, the non-sequence-specific DNA-binding mode of HUαα in the structures at pH ~4.5 and 5.5 resulted in
virtual sliding of the DNA relative to HUαα with out-of-register duplex positions forming distinct HUαα–DNA interfaces. Superimposition of these interfaces revealed the ball-socket joint
around the DNA minor grove that permits tilt and twist of HUαα on DNA (Fig. 5c). We had shown in a previous study that HUαα has two identical faces, either of which interact with DNA through
a phosphate lock between the G46-K83 peptide7. Combining several asymmetric units (ASU) for either structure at pH ~4.5 and ~5.5, we observed that two parallel DNA strands 42 Å apart are
engaged by the phosphate locks around the two faces of an HUαα dimer. The DNA spacing of 42 Å is also observed in solution at low pH and certain ionic strength and is repeated as represented
in our DNA bundle model (Fig. 4a). In addition to the interaction of positively charged HUαα body, HUαα arms support intermolecular bundling of DNA. We found that at pH 4.5 the parallel DNA
strands were bridged through an additional β-zipper interaction involving the arms of oppositely facing DNA bound HUαα dimers (Fig. 5a). These HUαα dimers held arms through the
intermolecular backbone hydrogen bonds between the highly conserved residues R61 and N62 (Supplementary Figs. 1a and 5a, c). The flexible elbow joint (residues A57, A73) positioned the arms
to form the β-zipper reinforcing the DNA bundle (Supplementary Figure 5c). In contrast, HUαα arms did not supplement the DNA bundling at pH 5.5 (Fig. 5b). Interestingly, another major
difference between the structures at different pH was in the coupling of two HUαα dimers connecting additional parallel DNA strands. In the structure at pH ~4.5, two HUαα dimers couple
around the minor groove of a DNA strand through intermolecular hydrogen bonds between residues E34K and K37 (Fig. 5a and Supplementary Figure 5a). In contrast, the intermolecular hydrogen
bonds were disrupted in the structure at pH ~5.5 uncoupling the HUαα dimers by shifting one dimer ~3 Å away (Fig. 5d, left panel and Supplementary Movie 2). Instead, we observed alternative
coupling of HUαα dimers through intermolecular hydrogen bonds between residues D8 and Q5 (Fig. 5b and Supplementary Figure 5b). The alternative coupling and lack of arm bridging transitioned
the DNA–DNA spacing in the crystal to 70 Å (Fig. 5b) that corroborated our observations in solution at similar pH and higher ionic strength (Fig. 4b). We concluded that the altered surface
charge owing to change in protonation state of residue E34 (Fig. 4e) altered intramolecular hydrogen bond that leads to the formation of alternative HUαα–HUαα coupling through residues D8
and Q5 at pH 5.5 and explained the shift in nucleoprotein organization in solution. The crystal structure of surface residue mutant HUαE34KαE34K with the 19 bp DNA further validated the
importance of HUαα–HUαα coupling in DNA bundling. The lack of hydrogen bond network caused a separation between the HUαE34KαE34K dimers to even larger distances of ~5 Å. (Fig. 5d, right
panel and Supplementary Movie 2). No alternative HUαE34KαE34K- HUαE34KαE34K coupling similar to that for HUαα/19 bp DNA at pH ~5.5 was observed either which correlated with the observation
of filament structures of HUαE34KαE34K-80 bp DNA in solution (Fig. 4f and Supplementary Figure 3a). The phosphate lock-based HUαE34KαE34K-DNA interaction interfaces were retained and
dictated the tilt and twist around the DNA (Supplementary Figure 5d). In summary, combing crystal structures and solution states we showed that HUαα-body and HUαα-arms based multimerization
is dependent on pH and salt concentrations. Furthermore, we revealed a role of HUαα surface charge in HUαα-HUαα coupling-dependent adaptability of HU–DNA interfaces that dictates the
transition between DNA bundles and filaments. HU-DEPENDENT NUCLEOID REMODELING CORRELATES TO GLOBAL GENE EXPRESSION CHANGES To show that nucleoid remodeling, we observed under different
growth phases and acidic stress condition, is related to changes in global gene expression, we measured gene expression in using RNA-seq (see Methods). SXT imaging showed that nucleoid
material is less condensed in the lag phase compared with the log phase. By differential expression analysis of genes between the log phase and lag phase in WT cells, we found that 199 genes
were upregulated, whereas 73 genes were downregulated in the lag phase (Fig. 6a and Supplementary Data 1). We interpret that the less-condensed nucleoid in the lag phase correlates with
higher gene expression and the more-condensed nucleoid in the growth phase strongly correlates with the lower expression of the same genes. This link between nucleoid remodeling and gene
expression in combination with specific gene regulatory mechanisms may be critical for the global gene expression reprogramming to prepare _E. coli_ for the transition into the exponential
growth24,25. SXT imaging also showed that the nucleoid region was less condensed in WT cells grown under acidic conditions compared to those grown at pH 7.0. In contrast to a significant
separation of nucleoid region from the cytosolic material at pH 7.0, we observed diffused borders between the nucleoid region and the cytosolic material at pH 5.0. By differential gene
expression analysis in WT cells between the normal and acidic growth conditions, we found that 245 genes were upregulated and 161 genes were downregulated in cells grown under the acidic
condition (Fig. 6b and Supplementary Data 2). In agreement with previous studies26, we observed upregulation of genes, such as _asr_ in our analysis, are important for survival under acid
stress. Although differential expression of many of the genes could result from a direct response to acidic stress through specific TFs-mediated gene regulation, we found that only 175 genes
were upregulated at pH 5.0 when HU was absent, suggesting that differential expression under acidic condition is at least partially dependent on HU (Fig. 6c and Supplementary Data 3). We
have demonstrated that HUαα–HUαα coupling mediated by the surface charge residues is critical for the higher-order organization of DNA into bundles and changes in E34 protonation state owing
to a change in pH or the E34K mutation could result in the reorganization of DNA from bundles into filaments. We hypothesized that a change in the HUαα composition under different growth
phases, which is known to occur in _E. coli_, and or the changes in E34 protonation state owing to changes in cytosolic pH could account for gene expression changes we observed. To test our
hypothesis, we measured the gene expression of HUα mutant (HUαE34K) cells with or without the presence of HUβ under normal and acidic growth conditions. Although _E. coli_ uses an active
mechanism of pH homeostasis27,28, we expected that external acidic conditions would cause a rapid decrease in cytoplasmic pH29. Surprisingly, the E34K mutation in HUα did not influence the
gene expression both in the presence or the absence of HUβ under both normal growth conditions and acidic stress conditions (Fig. 6d–f and Supplementary Data 4–5). We speculate that the
higher-order organization through HUαα–HUαα coupling mediated by the residue E34 plays an architectural role in the nucleoid structure without affecting gene expression. We propose that
HU-mediated restraining of supercoils may play a direct role in controlling global gene expression. DISCUSSION 3D genome organization is crucial for cellular behaviors and genetic
transmission. 3D genome is also highly dynamic30,31 and its reconfiguration through an influence on gene expression is important, at least in some eukaryotes, for cellular differentiation
during embryonic development32. In eukaryotic cells, gene expression is linked to an unwinding of DNA, and the loose euchromatin marks the regions of global gene expression17,33. In the
prokaryotic world, the nucleoid is a discrete, internally organized unit wherein the overall arrangement of DNA regulates gene expression globally34.The _E. coli_ nucleoid, the functionally
and spatially organized form of a single 4.6 megabase-pairs size haploid chromosome, serves a simple model to study 3D configuration of a genome and its dynamic reconfiguration during
environmental changes. However, high-resolution visualization of the nucleoid to better understand organizational features as well as unraveling molecular mechanisms, especially involving
biochemical factors such as NAPs, responsible for maintaining 3D genome architecture has presented major challenges. Using the X-ray-based imaging technology—SXT, we determined the
architecture of the bacterial nucleoid region in near-native state at 60 nm resolution. We observed that the nucleoid region consisted of a condensed core surrounded by spatially isolated
domains or macrodomains consistent with previously proposed features of the nucleoid. Our studies validated the role of HUαα, the most-abundant NAP in promoting megabase range DNA
communication for maintaining the architecture of the nucleoid macrodomains as was previously identified by Chromosome Conformation Capture Analysis (3 C)6,10. We could also visualize
dynamic reorganization of the domain in response to environmental changes and by mutation of HUα, which is in conjunction with other factors, like DNA-specific NAPs, RNA polymerase
modulators, and topoisomerases such as DNA gyrase35,36,37. Although, we observed distinct sub-regions such as nucleoid core and macrodomains, within the nucleoid region in _E. coli_, their
exact composition and protein:nucleic acid ratio cannot be determined with SXT alone. Nevertheless, our observations correlate with previous observations of longitudinal density bundling and
radial confinement of _E. coli_ nucleoid18,38,39. Similar to histones in eukaryotes, HU that binds non-sequence-specific DNA, is essential for bacterial nucleoid condensation that relates
to global gene expression3,40. Our gene expression analysis indicates that the nucleoid remodeling may be crucial for the reprogramming of gene expression for environmental adaptation and
provide a testable model of the relationship between HU structural assemblies, nucleoid architecture, and gene expression. Our characterization of the hierarchical organization of HUαα–DNA
nucleoprotein complexes in solution utilizing SAXS provided evidence for DNA bundling similar to previous reports7,41. We further found that the DNA bundle transformed to rigid filament-like
structures by varying pH and ionic strength similar to the HU–DNA nucleoprotein complexes formed at high HUαα:DNA ratios (>30 HUαα per 100 bp DNA)42,43. Considering uniformly distributed
HU across the nucleoid as previously shown11 with only one HU dimer per ~150 bp DNA, we propose that sparsely bound HUαα can bundle multiple DNA segments in the nucleoid while still
allowing efficient exchange of other DNA supercoil modifiers. Furthermore, we suggest that the transition from a DNA bundle to a filament structure depending on HU/DNA ratio, environmental
pH, or ionic strength contributes to the nucleoid remodeling. In the past, crystal structures of several HU–DNA complexes have been studied. HU–DNA complexes with structurally aberrant DNA
proposed DNA bending involving HU arms as a mode of DNA binding14. In addition, multiple other models proposed HU–DNA complex involving single DNA-duplex strand in a nucleoprotein
complex44,45,46,47. In contrast, in our crystal structures we observed that a two linear DNAs are bound across two opposite faces of HUαα dimer. In addition, we found that multiple HUαα
dimers can bundle DNA strands through HUαα–HUαα coupling involving HU body reinforced by HU arms. We further revealed that changes in HU surface charge by varying pH, salt, or surface
charged mutation7 cause repulsive separation of HU dimers along the DNA-transforming DNA bundles into filaments. Altering of the DNA bundling explains nucleoid remodeling in rapidly growing
_E. coli_ cells and further evidence the role of HUαα in previously identified long-range DNA interactions10. Although intercalation of the HUαα arms with structurally specific aberrant DNA
may be a lock-and-key mechanism for binding damaged DNA sites14, the dynamic HUαα–HUαα coupling is a universal mechanism for the binding sequence-independent DNA. HUαα–HUαα coupling that
involves both, HUαα body and arms, distinguish general DNA condensation complexes from specific aberrant DNA complexes. Collectively, our results defined a molecular mechanism whereby
changes in HUαα–HUαα multimerization alter DNA bundling affecting nucleoid remodeling that can change global gene expression in _E. coli_ to synchronize the genetic response to external
conditions. Our multi-scale study supports the previously presented idea that for HU-directed bacterial nucleoid remodeling its molecular functionality is key to its macroscopic behavior and
manifests at the nanoscale extending into the mesoscale. Future studies using correlative light and SXT microscopy to label specific sites in the nucleoid will provide more insights into
nucleoid dynamics that regulates gene expression reprogramming during environmental adaptations. Nevertheless, this study has broad significance in expanding the understanding of the
nucleoid architecture in bacteria and bring insights into HU-mediated nucleoid condensation, leading to concerted changes in the basal transcription program. These observations make HU
interactions an attractive target for controlling not only pathogenesis but also, microbial systems in general. METHODS CONSTRUCTION OF BACTERIAL STRAINS HUαE34K mutant strain was generated
by Lambda red recombineering48 in two steps using the plasmid pSIM649. In the first step, wild-type hupA open reading frame (ORF) was replaced with a pBAD-ccdB-kan cassette that expresses
CcdB toxin under the arabinose inducible promoter pBAD and encodes a kanamycin resistance protein. The recombinants were selected on LB agar plates containing 1% glucose and 30 µg ml−1
kanamycin. The recombinants were verified by PCR using the primers that bind outside the hupA gene as well as by the inability of the recombinants to grow normally on LB agar plates
supplemented with 0.02% arabinose that induces the toxin CcdB. In the second step, a synthetic double-stranded DNA (synthesized by Integrated DNA Technologies–https://www.idtdna.com/pages)
encoding hupAE34K with 46 nucleotides of homology to the 5’ and 3’ end of the hupA gene was recombined at the hupA locus. The recombinants were selected on LB agar with 0.02% arabinose and
subsequently were verified by Sanger sequencing. After sequence verification, the plasmid pSIM6 was removed by repeatedly growing the strain at 37 °C and checking for ampicillin sensitivity.
The final strain SCV56 with mutation hupAE34K was used for further RNA-seq experiments. For RNA-seq, the following additional strains were constructed. The ΔhupA (SCV18) and ΔhupB (SCV19)
strains were made by Lambda red recombineering using the plasmid pSIM6 in the two steps. The selection of the recombinants was done using the steps described for SCV56. In the first step,
the hupA ORF from codons 2 to 60 or the hupB ORF from codons 2 to 64 was replaced with the pBAD-ccdB-kan cassette. In the second step, a 70 nucleotides long single-stranded oligonucleotide
corresponding to sense strand was recombined. The sequence of the oligonucleotide for hupA is - GCAATTTTGATTTCTTTACCGGTCTGCGGGTTGCGCATAAGTTATCCTTACAATGTG TTTATCGCTTGCT for hupB is -
ACTTTAGCAGCAGCGATGGTGATCTCTTTACCGGTCACTCTTCTCTTCCTCTTTATAATTTATATCGCAC. The strain lacking both HU subunits hupA and hupB was constructed by transducing the hupB11 allele50 into the strain
SCV18 by standard P1vir transduction. The strain hupAE34K ΔhupB::CamR (SCV85) was constructed by transducing the hupB11 allele into SCV56. The hupA deletion of the strain SCV18 was repaired
and restored to wild-type hupA gene in two steps to create the strain SCV96 that served as a parent wild-type strain. In the first step, the pBAD-ccdB-kan cassette was introduced at the hupA
locus and a wild-type copy of hupA gene amplified from MG1655 was recombined in the second step. The wild-type status of hupA gene was verified by Sanger sequencing. HUΑ AND HUΑE34K PROTEIN
EXPRESSION AND PURIFICATION HUα and HUα mutant (HUαE34K) genes cloned in expression vector pET15b (Novagen) with tobacco etch virus (TEV) protease-cleavable site following the His6 site
were purchased from Genewiz. The plasmids were transformed into BL21(DE3)/pLysS strains. Overnight preculture were grown in Luria Broth (LB) media with 100 μg mL−1 ampicillin and 25 μg mL−1
chloramphenicol antibiotics at 37 °C. Next day, cells from overnight culture were grown in 2 L fresh LB media at 37 °C, up to an optical density of ~0.60–0.8 followed by induction with 0.5
mm isopropyl 1-thio-d-galactopyranoside. The cells were harvested after 4 h by centrifugation and resuspended in buffer A (10 mm HEPES pH 7.9, 0.5 m NaCl, 5 mm imidazole) with an additional
0.1% Triton X-100, 2 mm PMSF, 0.5 mg mL−1 lysozyme, 50 μg mL−1 DNase I, 20 μm CaCl2, and 4 mm MgCl2. Cells were lysed by passage through a constant cell disruptor (Constant Systems Ltd.) at
5 °C and 21 kpsi. After lysis, cellular debris was pelleted by centrifugation at 20,000 × _g_. Cleared cell lysate was batch-bound onto Ni-NTA resin (Qiagen) by rocking overnight at 4 °C.
Resin was batch washed in buffer A, then washed with 10× CV buffer A + 20 mm imidazole. Elution was carried out with 10× CV buffer A + 250 mm imidazole. The Ni-NTA eluate was dialyzed
overnight in buffer A. Next, the His tag was removed using TEV protease51. The cleaved protein was further purified by passing on Ni-NTA column to remove the His tag as well as TEV protease
that stayed bound to the column. The flow through was dialyzed into buffer B (2 mm HEPES pH 7.9, 20 mm NaCl) in 3.5 K MWCO Slide-A-Lyzers (Thermo Scientific). Dialysate was then purified by
cation exchange chromatography on a HiTrap SP HP column (GE Healthcare). Protein was bound onto the column then eluted with a gradient starting from buffer B to buffer B + 1 M NaCl. Purified
protein at concentration of ~1–2 mg ml−1 was flash frozen and stored at −80 °C. Protein concentration of all purified HU was determined by the Bradford and Lowry Assay. Bradford assay: 1.0
mL of Bradford reagent (Bio-Rad) was mixed with 20 μL protein and allowed to react for 10 min at room temperature. Absorbance at 595 nm was then measured on an Agilent 8453 UV-Visible
spectrophotometer. Bovine serum albumin (Thermo Scientific) was used as a standard. Concentrations of HU were verified with a modified Lowry assay (Thermo Scientific). SOFT X-RAY TOMOGRAPHY
_E. coli_ strain MG1655 with wild-type HUα and HUαE34K mutant strain (SCV56) were used for SXT experiments. For SXT experiments, strains were grown in 5 ml LB media at 37 °C. Cells were put
on ice and promptly cryo-immobilized after reaching OD600 0.2 for lag phase, 0.5 for exponential phase and >1.0 for stationary phase. Wild-type _E. coli_ cells (MG1655) were also grown in
5 ml LB media at 37 °C buffered to pH ~5 (buffered with 0.1 m sodium acetate) and were put on ice at time intervals at which normal growth media reached lag, log, and stationary phase.
Cells grown at low pH (~5) only reached an OD600 of ~0.2–0.3 corresponding to lag, log, and stationary phases of normal growth rate. Cells were transferred to thin-walled glass capillary
tubes and vitrified by plunge-freezing in ∼90 K liquid propane prior to being mounted in the cryogenic specimen rotation stage of the XM-2 Soft X-ray microscope at the National Center for
X-ray Tomography located at the Advanced Light Source (LBL, Berkeley CA)52. The microscope is equipped with Fresnel zone plate-based objective lens (micro zone plate (MZP)) with a spatial
resolution of 60 nm. Imaging was performed with the specimens in an atmosphere of helium gas cooled by liquid nitrogen. For each data set, 90 projection images were collected sequentially
around a rotation axis in 2° increments, giving a total rotation of 180° with exposure time varied between 150 and 300 ms (average 200 ms), depending on the capillary thickness. Images were
collected using a Peltier cooled, back-thinned and direct illuminated 2048 × 2048 pixel soft x-ray CCD camera (Roper Scientific iKon-L, Trenton, NJ, USA). Projection images were normalized,
aligned and tomographic reconstructions calculated using iterative reconstruction methods in AREC-3D package. The 3D X-ray tomograms were manually segmented in CHIMERA53, and used to
reconstruct volumes and measure voxel values (i.e., absorption values in volume element of the reconstructed data) to calculate linear absorption coefficients (LAC). LAC histograms of 10
cells for each condition were determined using AMIRA (FEI Visualization Sciences Group) and mean and standard deviation of LAC histogram for each condition (control condition, low pH and
HUαα mutant strains) were calculated in ORIGIN (https://www.originlab.com/). SXT orthoslices (Fig. 1) and volumetric reconstructions (Figs. 2 and 3) of nucleoid region were displayed in
CHIMERA53. Skeletonize map of nucleoid region (Fig. 2) was calculated and displayed in CHIMERA53 by using Gaussian filtering. TRANSCRIPTION PROFILING For RNA-Seq, strains were first grown
overnight in LB (Lennox) broth and then overnight cultures were diluted 1:1000 in fresh regular LB broth (pH 7.0) or LB with pH 5.0. LB with pH 5.0 was prepared as follows: For 200 ml, 35 ml
of 0.2 m citric acid, and 65 ml of 0.2 m sodium citrate were mixed, the components of LB (Lennox broth) were added, and then the volume was doubled with Milli Q water. The final pH of the
media was pH 5.0. Cells were harvested at OD600 0.2–0.3, which we refer to as lag phase and 0.4–0.5, which we refer to as log phase in this study. For total RNA isolation, a frozen pellet of
cells was resuspended in 1 ml TRIzol reagent (Life Technologies) to homogenization and incubated at room temperature for 5 min. To the resuspension, 0.2 ml chloroform was added and mixed by
inverting the tube for 15 seconds. The mixture was incubated at room temperature for 10 min and then centrifuged at 20,000 × _g_ for 10 min at 4 °C. After centrifugation, ~0.6 ml of the
upper phase was transferred to a new centrifuge tube containing 0.5 ml isopropanol. The mixture was incubated at room temperature for 10 min and then centrifuged at 20,000 × _g_ for 15 min
at 4 °C. After centrifugation, the supernatant was discarded and the pellet was washed twice with 1 ml 75% ethanol, made with Diethyl pyrocarbonate (DEPC)-treated water, by centrifugation at
13,544 × _g_, for 5 min at 4 °C. After the second wash, the tube was left open for 10–15 min at room temperature to dry the pellet. To the pellet, 50 µl DEPC treated water was added and the
tube was left at 37 °C for 10–15 min and then the pellet was fully resuspended using a pipette. DNA was removed using TURBO DNA-free Kit (Invitrogen). Quality of total RNA was determined by
electrophoresis on the TapeStation system (Agilent). Paired-end sequencing libraries were prepared with 2.5 µg of total RNA using Illumina TruSeq Stranded Total RNA library prep workflow
with Ribo-Zero. Samples were pooled and sequenced on HiSeq4000. Samples were barcode demultiplexed allowing one mismatch using Bcl2fastq v2.17. The samples had 18–24 million pass filter
reads with >89% of bases above the quality score of Q30. The reads were trimmed for adapters and low-quality bases using Cutadapt software54. Alignment of the reads to the _E. coli_ K12
MG1655 reference genome and the annotated transcriptome was done using STAR55. Transcript abundances were calculated by RSEM56, and differential expression analysis was done using the
glmTreat function in edgeR57. We identified differential expression based on false discovery rate (FDR) cut off of 0.05 and log2 (log with base 2) fold change of 1.5. The RNA-Seq data have
been deposited to the Gene Expression Omnibus (GEO) data base and can be accessed with the GEO accession number: GSE134667. DNA PURIFICATION DNA’s for crystallographic and solution
scattering studies were purchased from Integrated DNA Technologies (https://www.idtdna.com/pages). 19 bp DNA (5′-TTCAATTGTTGTTAACTTG-3′), 19 bp DNA with 1 bp overhang
(5′-CGGTTCAATTGGCACGCGC-3′) and 80 bp DNA (5′-AATGAGGTAACAACGAAAGCAGATGATAGCTGCTTATCAATTTGTTGCAAACAAGTAGCCGCGCCCAATGAGGTAACAAT-3′) were dissolved and annealed in water. Annealed DNAs were
purified on a size exclusion chromatography on an Superdex75 column in 20 mm Tris-HCl pH 7.0, 50 mm NaCl. CRYSTALLIZATION Crystals of HUαα or HUαE34KαE34K in complex with native DNAs were
grown by hanging-drop vapor diffusion. Various lengths of the native DNA with and without 1 bp overhangs were tested. In all, 19 bp DNA with blunt end and 19 bp DNA with 1 bp overhang on
both side was selected for crystallization experiments with HUαα or HUαE34KαE34K. HUαα was dialyzed into 10 mm Bis-Tris pH 4.5, 150 mm NaCl or into 10 mm Bis-Tris pH 5.5, 100 mm for
crystallizing at low pH 4.5 or higher pH 5.5, respectively and concentrated to ~17 mg ml−1. The 19 bp DNA was buffer exchanged into 20 mm Tris pH 7.0, 50 mm NaCl and was concentrated to 10
mg ml–1. Well diffracting crystals were obtained with 0.6 µl 0.1 m Na-malonate, pH 4.0 12% PEG 3350, 0.6 µl of 19 bp DNA, and 0.6 µl of HUαα dehydrated over 0.1 m Na-malonate, pH 4.0 12% PEG
3350 (crystals at pH 4.5) and with 0.02 m ZnCl2, 20% PEG 3350 (measure pH 5), 0.6 µl of 19 bp DNA, and 0.6 µl of HUαα dehydrated over 0.02 m ZnCl2, 20% PEG 3350 (crystals at pH ~5.5).
HUαE34KαE34K-DNA was dialyzed into 10 mm Bis-Tris pH 6.5, 50 mm NaCl and concentrated to ~17 mg ml−1. The 19 bp DNA with 1 bp overhang was buffer exchanged into 20 mm Tris pH 7.0, 50 mm NaCl
and was concentrated to 10 mg ml−1. Well diffracting crystals were obtained with 0.6 µl 0.1 m Na-malonate, pH 5.0, 12% PEG 3350, 0.6 µl of DNA, and 0.6 µl of HUαE34KαE34K dehydrated over
Na-malonate, pH 5.0, 12% PEG 3350. The best diffraction crystals grew in the drops produced by streaking protein into the DNA drop. Crystals grew in 2–3 days at 20 °C. DATA COLLECTION AND
STRUCTURAL ANALYSIS Structures of HUαα-DNA and HUαE34KαE34K-DNA complexes were solved by molecular replacement with X-ray diffraction data collected from cryo-cooled crystals at the SIBYLS
Beamline BL 12.3.158 and BL 8.3.1 of the Advanced Light Source (ALS, Berkeley, CA). The data were indexed, integrated and scaled with XDS59 and the phases were defined by molecular
replacement in PHASER60 using the refined structure of HUαα (PDBID: 4YEX7. Mathews coefficient was utilized to determine the contents of the ASU61. The molecular replacement phases yielded
clear density for double-stranded DNA. Ideal DNA helices were placed manually into the density and the model was refined using Phenix Refine62. The side chains were built using sigmaA
weighted 2Fo-Fc and Fo-Fc maps in COOT63 (Supplementary Table 1). Structures were visualized in CHIMERA53. Electrostatic surface potential was calculated by Poisson-Boltzmann electrostatic
calculations at the pH = 4.0, 5.0, 6.0, and 7.064. SAXS DATA COLLECTION AND EVALUATION SAXS data were collected at the ALS beamline 12.3.1 LBNL Berkeley, California58 at wavelength 1.03 Å
using a Pilatus 2M detector with the sample-to-detector distance of 1.5 m, resulting in scattering vectors, _q_ ranging from 0.01 Å−1 to 0.35 Å−1. The scattering vector is defined as _q_ =
4π sin_θ_/_λ_, where 2_θ_ is the scattering angle. All experiments were performed at 10 °C. For protein–DNA assemblies, protein HUαE34KαE34K was mixed with 80 bp DNA ~5 min prior data
collection at the HUαE34KαE34K/DNA ratios as indicated in Supplementary Figure 3. SAXS data were collected from 30-μl samples of HUαα, HUαα-80bp DNA, HUαE34KαE34K, and HUαE34KαE34K-80 bp DNA
with 3 s X-ray exposures for 5 mins continuously exchanged into different buffer conditions (please see SASBDB data base for the buffer composition). Integral of ratio of the background of
frames collected provided a signal plot for accurate buffer subtraction. SAXS curves were merged and analyzed using the program SCÅTTER. The SAXS profiles of HUαα-80 bp DNA under certain
buffer conditions showed diffraction peaks defined by d-spacing between parallel DNAs, indicating formation of a crystalline phase in solution. These SAXS profiles cannot be used to obtain
the radius of gyration _R_g or the _P_(_r_) function. The SAXS profiles for HUαα, HUαα-80bp DNA, HUαE34KαE34K, and HUαE34KαE34K-80bp DNA complexes collected presently, which did not show
diffraction peaks were investigated by comparing radius of gyrations _R_g derived by the Guinier approximation65 $$\begin{array}{*{20}{c}} {\ln I( q ) = \ln I(0) -
\frac{1}{3}q^2R_{\mathrm{g}}^2 } \end{array}$$ (1) with the limits _q_*_R_g < 1.3. Aggregation-free states of samples were investigated by defining linear region in the Guinier plots
(Supplementary Figs. 2e, f and 3b). Cross-sectional radius of gyration (_R_c) and Porod volume23 where calculated using the program SCÅTTER for three independent HUαα-80bp DNA and
HUαE34K-80bp DNA titration experiments. Pair distribution function _P_(_r_) was computed using the program GNOM66. The distance _r_ where _P_(_r_) functions approach zero intensity specifies
the maximal dimension (Dmax) of the macromolecule (Supplementary Figs. 2e, f and 3a). _P_(_r_) functions were normalized to volume of correlation of the assemblies calculated in SCÅTTER and
listed in the Supplementary Table 2. SOLUTION STRUCTURE MODELING Experimental scattering profiles of HUαα-80bp DNA complexes that showed diffraction peaks were investigated for the behavior
of Intensity in the low _q_-region (low angle). In the double logarithmic representation of the SAXS data, the power decay according to _I_ ∝ _q_−2 was evident (Supplementary Figure 2a–d),
indicating the presence of lamellar structures for the protein–DNA complexes in solution. Lamellar structures were fitted against the lamellar stack Caille function model in SasView
(http://www.sasview.org/). The lamellar stack Caille function is defined as random lamellar head/tail/tail/head sheet with Caille structure factor. The scattering intensity _I_(_q_) is
$$\begin{array}{*{20}{c}} {I( q ) = 2\pi \frac{{P\left( q \right)S\left( q \right)}}{{q^2\delta }} } \end{array}$$ (2) where _P_(_q_) is the form factor, _S_(_q_) is the structure factor
dependent on Caille constant and _δ_ is the total layer thickness. The combination of number of lamellar plates, Caille parameter (<0.8) and polydispersity in the bilayer thickness were
determinants of acceptable fit to the individual scattering curves (Supplementary Table 3). Experimental scattering profiles of HUαα, HUαα-80bp DNA, HUαE34KαE34K, and HUαE34KαE34K-80 bp DNA
complexes that did not show diffraction peaks showed a power decay according to _I_ ∝ _q_−1 in the double logarithmic representation of the SAXS data (Supplementary Figure 2a–d), indicating
the presence of filament-like structures. These data were fitted using atomistic models. We generated a pool of atomistic models of HUαα-80 bp DNA and HUαE34KαE34K-80bp DNA with different
protein/DNA ratios based on the HUαα-DNA crystal structure at pH 4.5 and HUαE34KαE34K-DNA, respectively. We utilized FoXS67 to guide the selection of single representative state that fit the
experimental SAXS profiles of HUαα-80 bp DNA complexes that did not show diffraction peaks and HUαE34KαE34K-80 bp DNA complexes at pH 6.5 and above from their corresponding pools of models.
We applied ensemble analysis68 to match the SAXS curves of HUαE34KαE34K-80bp DNA complexes at different protein:DNA ratios using various protein–DNA-binding modes in these multi-component
systems. A pool of HUαE34KαE34K-80 bp atomistic models with different protein–DNA ratios and protein–DNA bridging (covering two to three neighboring DNAs) were generated based on our
crystals structures. The extended arms of HU and missing regions if any were built based on the complete protein models from HUαα-DNA crystal structure at pH 4.5. A selection of sub-ensemble
of HUαE34KαE34K-80 bp DNA complexes coexisting in solution was guided by the fit to the experimental SAXS data using FoXS and Multi-FoXS67,69. The complexes were weighted and allowed
selection of a minimal ensemble to avoid over-fitting of SAXS data. The match of theoretical weighted profiles to the experimental curve confirmed a filament-like structure for
HUαE34KαE34K-80bp DNA complexes. Structures were visualized in CHIMERA53. Data and the related models were deposited in the SASBDB data base (https://www.sasbdb.org/). The SASBDB data base
accession codes and experimental SAXS parameters are reported in Supplementary Table 2. STATISTICS AND REPRODUCIBILITY Descriptive statistics to obtain mean and standard deviation (for Fig.
1 and Supplementary Figure 3) were performed in OriginLab (OriginLab, Northampton, MA). Statistical significance was also assessed in OriginLab using a two-sided two-sample _t_ test. For
cell growth assay, the data were derived from _n_ = 3 biological replicates. We used three independent biological replicates for each condition and/or genotype to detect differential gene
expression in RNA-sequencing experiments. Statistics for LAC Histogram were determined from _n_ = 10 independent bacterial cell for each experimental condition. SAXS experiments were
repeated 2/3 times independently. We confirm that all attempts to replicate experiments were successful. REPORTING SUMMARY Further information on research design is available in the Nature
Research Reporting Summary linked to this Article. DATA AVAILABILITY Atomic coordinates and structure factors for the crystal structures are deposited in the Protein Data Bank
(PDB–(https://www.rcsb.org/)) PDBID: 6O8Q, 6O6K, and 6OAJ (Fig. 5 and Supplementary Figures 4, 5). SAXS data are deposited in the Small-Angle Scattering Biological Data Bank (SASBDB−and
SASDBD IDs are listed in the Supplementary Table 2 and figure legend of Supplementary Figure 3 (Fig. 4 and Supplementary Figures 2, 3). Soft X-ray tomography data are available here
(https://ncxt-nas1.lbl.gov:5001/fsdownload/XKnLbGVgY/Nature%20comm). The RNA-Seq are deposited in the Gene Expression Omnibus data base (GEO) with accession code GSE134667 (Fig. 6). All data
are available from the authors upon reasonable request. REFERENCES * Dorman, C. J. DNA supercoiling and environmental regulation of gene expression in pathogenic bacteria. _Infect. Immun._
59, 745–749 (1991). Article CAS PubMed PubMed Central Google Scholar * Dorman, C. J. Co-operative roles for DNA supercoiling and nucleoid-associated proteins in the regulation of
bacterial transcription. _Biochem Soc. Trans._ 41, 542–547 (2013). Article CAS PubMed Google Scholar * Meyer, S., Reverchon, S., Nasser, W. & Muskhelishvili, G. Chromosomal
organization of transcription: in a nutshell. _Curr. Genet_ 64, 555–565 (2018). Article CAS PubMed Google Scholar * Travers, A. & Muskhelishvili, G. DNA supercoiling - a global
transcriptional regulator for enterobacterial growth? _Nat. Rev. Microbiol._ 3, 157–169 (2005). Article CAS PubMed Google Scholar * Azam, T. A. & Ishihama, A. Twelve species of the
nucleoid-associated protein from _Escherichia coli._ Sequence recognition specificity and DNA binding affinity. _J. Biol. Chem._ 274, 33105–33113 (1999). Article CAS PubMed Google Scholar
* Berger, M. et al. Coordination of genomic structure and transcription by the main bacterial nucleoid-associated protein HU. _EMBO Rep._ 11, 59–64 (2010). Article CAS PubMed Google
Scholar * Hammel, M. et al. HU multimerization shift controls nucleoid compaction. _Sci. Adv._ 2, e1600650 (2016). Article ADS PubMed PubMed Central CAS Google Scholar * Kar, S.,
Edgar, R. & Adhya, S. Nucleoid remodeling by an altered HU protein: reorganization of the transcription program. _Proc. Natl Acad. Sci. USA_ 102, 16397–16402 (2005). Article ADS CAS
PubMed PubMed Central Google Scholar * Berger, M. et al. Genes on a wire: the nucleoid-associated protein HU insulates transcription units in _Escherichia coli_. _Sci. Rep._ 6, 31512
(2016). Article ADS CAS PubMed PubMed Central Google Scholar * Lioy, V. S. et al. Multiscale structuring of the _E. coli_ chromosome by nucleoid-associated and condensin proteins.
_Cell_ 172, 771–783 (2018). Article CAS PubMed Google Scholar * Prieto, A. I. et al. Genomic analysis of DNA binding and gene regulation by homologous nucleoid-associated proteins IHF
and HU in _Escherichia coli_ K12. _Nucleic Acids Res._ 40, 3524–3537 (2012). Article CAS PubMed Google Scholar * Wang, W., Li, G. W., Chen, C., Xie, X. S. & Zhuang, X. Chromosome
organization by a nucleoid-associated protein in live bacteria. _Science_ 333, 1445–1449 (2011). Article ADS CAS PubMed PubMed Central Google Scholar * Kamashev, D. &
Rouviere-Yaniv, J. The histone-like protein HU binds specifically to DNA recombination and repair intermediates. _EMBO J._ 19, 6527–6535 (2000). Article CAS PubMed PubMed Central Google
Scholar * Swinger, K. K., Lemberg, K. M., Zhang, Y. & Rice, P. A. Flexible DNA bending in HU-DNA cocrystal structures. _EMBO J._ 22, 3749–3760 (2003). Article CAS PubMed PubMed
Central Google Scholar * Claret, L. & Rouviere-Yaniv, J. Variation in HU composition during growth of _Escherichia coli_: the heterodimer is required for long term survival. _J. Mol.
Biol._ 273, 93–104 (1997). Article CAS PubMed Google Scholar * Le Gros, M. A., McDermott, G. & Larabell, C. A. X-ray tomography of whole cells. _Curr. Opin. Struct. Biol._ 15,
593–600 (2005). Article PubMed CAS Google Scholar * Le Gros, M. A. et al. Soft X-ray tomography reveals gradual chromatin compaction and reorganization during neurogenesis in vivo. _Cell
Rep._ 17, 2125–2136 (2016). Article PubMed PubMed Central CAS Google Scholar * Fisher, J. K. et al. Four-dimensional imaging of _E. coli_ nucleoid organization and dynamics in living
cells. _Cell_ 153, 882–895 (2013). Article CAS PubMed PubMed Central Google Scholar * Robinow, C. & Kellenberger, E. The bacterial nucleoid revisited. _Microbiol. Rev._ 58, 211–232
(1994). Article CAS PubMed PubMed Central Google Scholar * Valens, M., Penaud, S., Rossignol, M., Cornet, F. & Boccard, F. Macrodomain organization of the _Escherichia coli_
chromosome. _Embo J._ 23, 4330–4341 (2004). Article CAS PubMed PubMed Central Google Scholar * Wang, X., Montero Llopis, P. & Rudner, D. Z. Organization and segregation of bacterial
chromosomes. _Nat. Rev. Genet._ 14, 191–203 (2013). Article CAS PubMed Google Scholar * Liu, Y. et al. A model for chromosome organization during the cell cycle in live _E. coli_. _Sci.
Rep._ 5, 17133 (2015). Article ADS CAS PubMed PubMed Central Google Scholar * Porod, G. in _Small Angle X-ray Scattering_ (eds Glatter, O. & Kratky, O.) 17–51 (Academic Press,
1982). * Zaslaver, A. et al. A comprehensive library of fluorescent transcriptional reporters for _Escherichia coli_. _Nat. Methods_ 3, 623–628 (2006). Article CAS PubMed Google Scholar
* Pin, C. et al. Network analysis of the transcriptional pattern of young and old cells of _Escherichia coli_ during lag phase. _BMC Syst. Biol._ 3, 108 (2009). Article PubMed PubMed
Central CAS Google Scholar * Tucker, D. L., Tucker, N. & Conway, T. Gene expression profiling of the pH response in _Escherichia coli_. _J. Bacteriol._ 184, 6551–6558 (2002). Article
CAS PubMed PubMed Central Google Scholar * Foster, J. W. _Escherichia coli_ acid resistance: tales of an amateur acidophile. _Nat. Rev. Microbiol._ 2, 898–907 (2004). Article CAS
PubMed Google Scholar * Krulwich, T. A., Sachs, G. & Padan, E. Molecular aspects of bacterial pH sensing and homeostasis. _Nat. Rev. Microbiol._ 9, 330–343 (2011). Article CAS PubMed
PubMed Central Google Scholar * Martinez, K. A. II et al. Cytoplasmic pH response to acid stress in individual cells of _Escherichia coli_ and Bacillus subtilis observed by fluorescence
ratio imaging microscopy. _Appl Environ. Microbiol._ 78, 3706–3714 (2012). Article CAS PubMed PubMed Central Google Scholar * Frenkiel-Krispin, D. et al. Nucleoid restructuring in
stationary-state bacteria. _Mol. Microbiol._ 51, 395–405 (2004). Article CAS PubMed Google Scholar * Kleckner, N. et al. The bacterial nucleoid: nature, dynamics and sister segregation.
_Curr. Opin. Microbiol._ 22, 127–137 (2014). Article CAS PubMed PubMed Central Google Scholar * Gorkin, D. U., Leung, D. & Ren, B. The 3D genome in transcriptional regulation and
pluripotency. _Cell Stem Cell_ 14, 762–775 (2014). Article CAS PubMed PubMed Central Google Scholar * Clowney, E. J. et al. Nuclear aggregation of olfactory receptor genes governs their
monogenic expression. _Cell_ 151, 724–737 (2012). Article CAS PubMed PubMed Central Google Scholar * Dorman, C. J. Genome architecture and global gene regulation in bacteria: making
progress towards a unified model? _Nat. Rev. Microbiol_ 11, 349–355 (2013). Article CAS PubMed Google Scholar * Badrinarayanan, A., Le, T. B. & Laub, M. T. Bacterial chromosome
organization and segregation. _Annu Rev. Cell Dev. Biol._ 31, 171–199 (2015). Article CAS PubMed PubMed Central Google Scholar * Sobetzko, P., Travers, A. & Muskhelishvili, G. Gene
order and chromosome dynamics coordinate spatiotemporal gene expression during the bacterial growth cycle. _Proc. Natl Acad. Sci. USA_ 109, E42–E50 (2012). Article ADS CAS PubMed Google
Scholar * Wiggins, P. A., Cheveralls, K. C., Martin, J. S., Lintner, R. & Kondev, J. Strong intranucleoid interactions organize the _Escherichia coli_ chromosome into a nucleoid
filament. _Proc. Natl Acad. Sci. USA_ 107, 4991–4995 (2010). Article ADS CAS PubMed PubMed Central Google Scholar * Berlatzky, I. A., Rouvinski, A. & Ben-Yehuda, S. Spatial
organization of a replicating bacterial chromosome. _Proc. Natl Acad. Sci. USA_ 105, 14136–14140 (2008). Article ADS CAS PubMed PubMed Central Google Scholar * Victor, T. W. et al.
X-ray fluorescence nanotomography of single bacteria with a sub-15 nm beam. _Sci. Rep._ 8, 13415 (2018). Article ADS PubMed PubMed Central CAS Google Scholar * Dillon, S. C. &
Dorman, C. J. Bacterial nucleoid-associated proteins, nucleoid structure and gene expression. _Nat. Rev. Microbiol._ 8, 185–195 (2010). Article CAS PubMed Google Scholar * Sagi, D.,
Friedman, N., Vorgias, C., Oppenheim, A. B. & Stavans, J. Modulation of DNA conformations through the formation of alternative high-order HU-DNA complexes. _J. Mol. Biol._ 341, 419–428
(2004). Article CAS PubMed Google Scholar * Kundukad, B., Cong, P., van der Maarel, J. R. & Doyle, P. S. Time-dependent bending rigidity and helical twist of DNA by rearrangement of
bound HU protein. _Nucleic Acids Res._ 41, 8280–8288 (2013). Article CAS PubMed PubMed Central Google Scholar * van Noort, J., Verbrugge, S., Goosen, N., Dekker, C. & Dame, R. T.
Dual architectural roles of HU: formation of flexible hinges and rigid filaments. _Proc. Natl. Acad. Sci. USA_ 101, 6969–6974 (2004). Article ADS PubMed PubMed Central Google Scholar *
Czapla, L., Peters, J. P., Rueter, E. M., Olson, W. K. & Maher, L. J. III Understanding apparent DNA flexibility enhancement by HU and HMGB architectural proteins. _J. Mol. Biol._ 409,
278–289 (2011). Article CAS PubMed PubMed Central Google Scholar * Koh, J., Shkel, I., Saecker, R. M., Record, M. T. Jr. & Nonspecific, D. N. A. binding and bending by HUalphabeta:
interfaces of the three binding modes characterized by salt-dependent thermodynamics. _J. Mol. Biol._ 410, 241–267 (2011). Article CAS PubMed PubMed Central Google Scholar * Wei, J.,
Czapla, L., Grosner, M. A., Swigon, D. & Olson, W. K. DNA topology confers sequence specificity to nonspecific architectural proteins. _Proc. Natl Acad. Sci. USA_ 111, 16742–16749
(2014). Article ADS CAS PubMed PubMed Central Google Scholar * Xiao, B., Zhang, H., Johnson, R. C. & Marko, J. F. Force-driven unbinding of proteins HU and Fis from DNA quantified
using a thermodynamic Maxwell relation. _Nucleic Acids Res._ 39, 5568–5577 (2011). Article CAS PubMed PubMed Central Google Scholar * Yu, D. et al. An efficient recombination system for
chromosome engineering in _Escherichia coli_. _Proc. Natl. Acad. Sci. USA_ 97, 5978–5983 (2000). Article ADS CAS PubMed PubMed Central Google Scholar * Datta, S., Costantino, N. &
Court, D. L. A set of recombineering plasmids for gram-negative bacteria. _Gene_ 379, 109–115 (2006). Article CAS PubMed Google Scholar * Wada, M. K., Ogawa, Y., Okazaki, T. &
Imamoto, T. F. Construction and characterization of the deletion mutant of hupA and hupB genes in _Escherichia coli_. _J. Mol. Biol._ 204, 581–591 (1988). Article CAS PubMed Google
Scholar * Bazan, J. F. F. & R. J. Viral cysteine proteases are homologous to the trypsin-like family of serine proteases: structural and functional implications. _Proc. Natl Acad. Sci.
USA_ 85, 7872–7876 (1988). Article ADS CAS PubMed PubMed Central Google Scholar * Le Gros, M. A. et al. Biological soft X-ray tomography on beamline 2.1 at the advanced light source.
_J. Synchrotron. Radiat._ 21, 1370–1377 (2014). Article PubMed PubMed Central CAS Google Scholar * Pettersen, E. F. et al. UCSF chimera–a visualization system for exploratory research
and analysis. _J. Comput. Chem._ 25, 1605–1612 (2004). Article CAS PubMed Google Scholar * Martin, M. Cutadapt removes adapter sequences from high-throughput sequencing reads. _EMBnet
J._ 17, 10–12 (2011). Article Google Scholar * Dobin, A. et al. STAR: ultrafast universal RNA-seq aligner. _Bioinformatics_ 29, 15–21 (2013). Article CAS PubMed Google Scholar * Li, B.
& Dewey, C. N. RSEM: accurate transcript quantification from RNA-Seq data with or without a reference genome. _BMC Bioinformatics_ 12, 323 (2011). Article CAS PubMed PubMed Central
Google Scholar * Robinson, M. D., McCarthy, D. J. & Smyth, G. K. edgeR: a Bioconductor package for differential expression analysis of digital gene expression data. _Bioinformatics_ 26,
139–140 (2010). Article CAS PubMed Google Scholar * Classen, S. et al. Implementation and performance of SIBYLS: a dual endstation small-angle X-ray scattering and macromolecular
crystallography beamline at the advanced light source. _J. Appl Crystallogr._ 46, 1–13 (2013). Article CAS PubMed PubMed Central Google Scholar * Kabsch, W. XDS. _Acta Crystallogr. D.
Biol. Crystallogr._ 66, 125–132 (2010). Article CAS PubMed PubMed Central Google Scholar * McCoy, A. J. et al. Phaser crystallographic software. _J. Appl. Crystallogr._ 40, 658–674
(2007). Article CAS PubMed PubMed Central Google Scholar * Matthews, B. W. Solvent content of protein crystals. _J. Mol. Biol._ 33, 491–497 (1968). Article CAS PubMed Google Scholar
* Afonine, P. V. et al. Towards automated crystallographic structure refinement with phenix.refine. _Acta Crystallogr. D. Biol. Crystallogr._ 68, 352–367 (2012). Article CAS PubMed
PubMed Central Google Scholar * Emsley, P. & Cowtan, K. Coot: model-building tools for molecular graphics. _Acta. Crystallogr. D. Biol. Crystallogr._ 60, 2126–2132 (2004). Article
PubMed CAS Google Scholar * Dolinsky, T. J., Nielsen, J. E., McCammon, J. A. & Baker, N. A. PDB2PQR: an automated pipeline for the setup of Poisson-Boltzmann electrostatics
calculations. _Nucleic Acids Res._ 32, W665–W667 (2004). Article CAS PubMed PubMed Central Google Scholar * Guinier, A. & Fournet, G. _Small-Angle Scattering of X-Rays_ (John Wiley
and Sons, Inc., New York, 1955). * Svergun, D. I. Determination of the regularization parameter in indirect-transform methods using perceptual criteria. _J. Appl. Crystallogr._ 25, 495–503
(1992). Article CAS Google Scholar * Schneidman-Duhovny, D., Hammel, M., Tainer, J. A. & Sali, A. Accurate SAXS profile computation and its assessment by contrast variation
experiments. _Biophys. J._ 105, 962–974 (2013). Article ADS CAS PubMed PubMed Central Google Scholar * Hammel, M. Validation of macromolecular flexibility in solution by small-angle
X-ray scattering (SAXS). _Eur. Biophys. J._ 41, 789–799 (2012). Article CAS PubMed PubMed Central Google Scholar * Schneidman-Duhovny, D., Hammel, M., Tainer, J. A. & Sali, A. FoXS,
FoXSDock and MultiFoXS: Single-state and multi-state structural modeling of proteins and their complexes based on SAXS profiles. _Nucleic Acids Res._ 44, W424–W429 (2016). Article CAS
PubMed PubMed Central Google Scholar Download references ACKNOWLEDGEMENTS This work was supported in part by the DOE BER Integrated Diffraction Analysis Technologies (IDAT) program and
NIGMS grant P30 GM124169 and Advanced Light Source (ALS) resource ALS-ENABLE. SAXS at ALS SIBYLS beamline is also supported by NIH grant CA92584. The National Center for X-ray Tomography is
supported by NIH (P41GM103445) and DOE BER (DE-AC02-5CH11231). Beamline 8.3.1 at the Advanced Light Source is operated by the University of California Office of the President, Multicampus
Research Programs, and Initiatives grant MR-15-328599 the National Institutes of Health (R01 GM124149 and P30 GM124169), Plexxikon Inc. and the Integrated Diffraction Analysis Technologies
program of the US Department of Energy Office of Biological and Environmental Research. This work was partially supported by the gift funds from IUCr2017–Local Organizing Committee, to Dr.
Soumya Govinda Remesh winner of the Dragons’s Den contest at the IUCr2017 Congress, Hyderabad, India. We thank members of the SIBYLS group (BL 12.3.1), BL 2.1, and BL 8.3.1 at ALS for aiding
data collection and for comments and suggestions in preparation of this paper. We thank Andrei Trostel for help in RNA extraction from some of the samples tested here. AUTHOR INFORMATION
Author notes * These authors contributed equally: Soumya G. Remesh, Subhash C. Verma. AUTHORS AND AFFILIATIONS * Laboratory of Molecular Biology, Center for Cancer Research, National Cancer
Institute, Bethesda, MD, 20892, USA Soumya G. Remesh, Subhash C. Verma & Sankar Adhya * Molecular Biophysics and Integrated Bioimaging, Lawrence Berkeley National Laboratory, Berkeley,
CA, 94720, USA Soumya G. Remesh, Jian-Hua Chen, Axel A. Ekman, Carolyn A. Larabell & Michal Hammel * Department of Anatomy, University of California San Francisco, San Francisco, CA,
94158, USA Jian-Hua Chen, Axel A. Ekman & Carolyn A. Larabell Authors * Soumya G. Remesh View author publications You can also search for this author inPubMed Google Scholar * Subhash C.
Verma View author publications You can also search for this author inPubMed Google Scholar * Jian-Hua Chen View author publications You can also search for this author inPubMed Google
Scholar * Axel A. Ekman View author publications You can also search for this author inPubMed Google Scholar * Carolyn A. Larabell View author publications You can also search for this
author inPubMed Google Scholar * Sankar Adhya View author publications You can also search for this author inPubMed Google Scholar * Michal Hammel View author publications You can also
search for this author inPubMed Google Scholar CONTRIBUTIONS Conceptualization, M.H. and S.A.; methodology (MX, SAXS, SXT), S.G.R. and M.H.; methodology (SXT), J.H.C. and A.E.; validation
(MX, SAXS, SXT), S.G.R. and M.H.; validation (RNA-Seq), S.V; formal analysis (MX, SAXS, SXT), S.G.R. and M.H.; formal analysis (RNA-Seq), S.V.; investigation (Protein and DNA purification,
crystallization) S.G.R.; investigation (MX, SAXS), S.G.R. and M.H.; investigation (SXT), J.H.C. and S.G.R.; investigation (RNA-Seq), S.V.; writing—original draft, S.G.R. and M.H.;
visualization, S.G.R. and M.H.; supervision; S.A, C.L., and M.H.; project administration, S.A., C.L., and M.H.; funding acquisition, S.A. and M.H. CORRESPONDING AUTHOR Correspondence to
Michal Hammel. ETHICS DECLARATIONS COMPETING INTERESTS The authors declare no competing interests. ADDITIONAL INFORMATION PEER REVIEW INFORMATION _Nature Communications_ thanks Wataru Kagawa
and the other, anonymous, reviewer(s) for their contribution to the peer review of this work. Peer reviewer reports are available. PUBLISHER’S NOTE Springer Nature remains neutral with
regard to jurisdictional claims in published maps and institutional affiliations. SUPPLEMENTARY INFORMATION SUPPLEMENTARY INFORMATION PEER REVIEW FILE DESCRIPTION OF ADDITIONAL SUPPLEMENTARY
FILES SUPPLEMENTARY DATA 1 SUPPLEMENTARY DATA 2 SUPPLEMENTARY DATA 3 SUPPLEMENTARY DATA 4 SUPPLEMENTARY DATA 5 SUPPLEMENTARY MOVIE 1 SUPPLEMENTARY MOVIE 2 REPORTING SUMMARY RIGHTS AND
PERMISSIONS OPEN ACCESS This article is licensed under a Creative Commons Attribution 4.0 International License, which permits use, sharing, adaptation, distribution and reproduction in any
medium or format, as long as you give appropriate credit to the original author(s) and the source, provide a link to the Creative Commons license, and indicate if changes were made. The
images or other third party material in this article are included in the article’s Creative Commons license, unless indicated otherwise in a credit line to the material. If material is not
included in the article’s Creative Commons license and your intended use is not permitted by statutory regulation or exceeds the permitted use, you will need to obtain permission directly
from the copyright holder. To view a copy of this license, visit http://creativecommons.org/licenses/by/4.0/. Reprints and permissions ABOUT THIS ARTICLE CITE THIS ARTICLE Remesh, S.G.,
Verma, S.C., Chen, JH. _et al._ Nucleoid remodeling during environmental adaptation is regulated by HU-dependent DNA bundling. _Nat Commun_ 11, 2905 (2020).
https://doi.org/10.1038/s41467-020-16724-5 Download citation * Received: 17 December 2019 * Accepted: 19 May 2020 * Published: 09 June 2020 * DOI: https://doi.org/10.1038/s41467-020-16724-5
SHARE THIS ARTICLE Anyone you share the following link with will be able to read this content: Get shareable link Sorry, a shareable link is not currently available for this article. Copy to
clipboard Provided by the Springer Nature SharedIt content-sharing initiative