- Select a language for the TTS:
- UK English Female
- UK English Male
- US English Female
- US English Male
- Australian Female
- Australian Male
- Language selected: (auto detect) - EN
Play all audios:
ABSTRACT Intratumoral heterogeneity is a hallmark of glioblastoma (GBM) tumors, thought to negatively influence therapeutic outcome. Previous studies showed that mesenchymal tumors have a
worse outcome than the proneural subtype. Here we focus on STAT3 as its activation precedes the proneural-mesenchymal transition. We first establish a _STAT3_ gene signature that stratifies
GBM patients into _STAT3_-high and -low cohorts. STAT3 inhibitor treatment selectively mitigates _STAT3_-high cell viability and tumorigenicity in orthotopic mouse xenograft models. We show
the mechanism underlying resistance in _STAT3_-low cells by combining _STAT3_ signature analysis with kinome screen data on STAT3 inhibitor-treated cells. This allows us to draw connections
between kinases affected by STAT3 inhibitors, their associated transcription factors and target genes. We demonstrate that dual inhibition of IGF-1R and STAT3 sensitizes _STAT3_-low cells
and improves survival in mice. Our study underscores the importance of serially profiling tumors so as to accurately target individuals who may demonstrate molecular subtype switching.
SIMILAR CONTENT BEING VIEWED BY OTHERS COMPREHENSIVE GENETIC PROFILING AND MOLECULARLY GUIDED TREATMENT FOR PATIENTS WITH PRIMARY CNS TUMORS Article Open access 14 August 2024 MAPK INHIBITOR
SENSITIVITY SCORES PREDICT SENSITIVITY DRIVEN BY THE IMMUNE INFILTRATION IN PEDIATRIC LOW-GRADE GLIOMAS Article Open access 27 July 2023 COMBINED TARGETING OF GLIOBLASTOMA STEM CELLS OF
DIFFERENT CELLULAR STATES DISRUPTS MALIGNANT PROGRESSION Article Open access 26 March 2025 INTRODUCTION Patients with glioblastoma (GBM) frequently survive no >15 months despite surgical
intervention with chemotherapy and radiation1. Tumor recurrence and the development of resistance toward standard-of-care treatment regimens are key reasons for the poor outcome and have
been attributed to the cellular and molecular heterogeneity of tumor tissue2,3,4,5. Over the past decade, several large, publicly funded efforts demonstrated that gene expression drives
brain tumor disease progression and clinical outcome3. Primary adult GBM tumors that are predominantly isocitrate dehydrogenase 1—wild type (IDH-WT) are subdivided into three
glioma-intrinsic (GI) transcriptomic subtypes (proneural, classical, and mesenchymal) after separating out microglial- and stromal cell-type contribution4. The revised World Health
Organization (WHO) classification scheme for brain tumors incorporates these molecular markers to influence treatment decision1. These efforts highlight the necessity to prescribe treatment
regimens based on a stratified population. We focused on signal transducers and activators of transcription (STAT3) where its activation has been demonstrated to effect a transition in
molecular subtype to the aggressive mesenchymal profile6. The proneural–mesenchymal transition (PMT) process has been associated with recurrent tumors and, more recently, chemotherapeutic
and radiation resistance, thought to arise from the selection of transitional glioma-initiating cell clones harboring gain in PMT transcriptomic patterns6. Thus targeting the STAT3 signaling
axis is pivotal in disease management. The interleukin 6/Janus kinase/STAT3 (IL-6/JAK/STAT3) pathway is involved in the pathogenesis of many human malignancies. Increased IL-6 levels are
also found in conditions associated with inflammation, such as rheumatoid arthritis and inflammatory bowel disease and increasingly in hematological disorders and solid tumors, such as GBM7.
In cancer, increased IL-6 levels result in hyperactivation of JAK/STAT3 signaling, typically associated with poorer prognosis8,9,10,11. In most myeloproliferative cancers, the genes
encoding JAK enzymes, particularly _JAK2_, frequently contain gain-of-function mutations12. However, no such mutations can be detected in GBM tumors, thus implicating other mechanisms of
STAT3 activation. STAT3 has also been shown to regulate the self-renewal potential of glioma cells, suggesting that its inhibition would lead to a more curative and sustained outcome13,14.
Over the past decade, much effort has been spent at evaluating JAK inhibitors predominantly in chronic inflammation and hematological disorders, with its application in solid tumors largely
unexplored. Tofacitinib, Ruxolitinib, and pacritinib are the most advanced drugs in preclinical development. Furthermore, oncology-based clinical trials of STAT3 inhibitors have yet to take
into consideration the implications arising from The Cancer Genome Atlas (TCGA) findings and whether the development of subsequent patient stratification methods would lead to significant
improvement in prognostic outcomes. We are therefore interested in assessing JAK/STAT3-inhibitory agents in GBM tumors, with an ultimate goal in identification of potential responders and
non-responders. TCGA efforts identified molecular subtypes driven by key signaling pathways3. In the evaluation of upstream kinases that lead to active STAT3 signaling, the human epidermal
growth factor receptor (EGFR), a member of the ErbB/HER family of receptor tyrosine kinases (RTKs); the family of IL-6–type (IL-6) cytokine receptors that form complexes with gp130 and JAKs;
and several G-protein-coupled receptors have been described in previous literature15. Multiple growth factors (e.g., EGF, transforming growth factor-α (TGFα), platelet-derived growth
factor, and colony-stimulating factor 1) and cytokines (e.g., insulin-like growth factor 1 (IGF-1), IL-6, leukemia inhibitory factor, cardiotrophin-1, ciliary neurotrophic factor, IL-10,
IL-11, and Oncostatin-M) have been shown to activate STAT3. Elevated levels of STAT3-activating ligands, such as IGF-1, TGFα, or IL-6, have also been detected in the serum and/or the tumor
microenvironment of patients with various malignancies. In the case of IGF-1 receptor (IGF-1R) where several small-molecule candidates are under evaluation in pharmaceutical pipelines, the
downstream cell-intrinsic activation of STAT3 remains unclear in GBM tumors. We first combine gene candidates inversely implicated in the STAT3 response pathway in patient-derived GBM cells
in the presence of _STAT3_ knockdown (KD), with candidates regulated in similar direction across the _STAT3_ axis in large, public clinical databases. This strategy allows us to prioritize
clinically relevant gene candidates in an otherwise statistically underpowered cell line collection, as with all such studies. We then systematically rank the _STAT3_ signaling axis, as
defined by a gene signature, with key patient characteristics and clinical indicators16,17. This allows us to predict patient cohorts most likely to benefit from a STAT3 inhibition
therapeutic approach. Furthermore, by analyzing the upregulated genes in the other non-responder cohort, we select key kinases for which inhibitory small molecules are currently evaluated in
clinical trials. To substantiate our bioinformatical analyses, we prioritize clinically relevant (and biochemically active) kinases using a novel computational pipeline to set the threshold
for a kinome screen conducted on _STAT3_-perturbed GBM cells. We successfully identify IGF-1R in an as yet undescribed STAT3-IGF-1 forward feedback loop. Our study provides preclinical
evidence for the implementation of anti-STAT3 therapy in selected patient cohorts, while defining a method to sensitize non-responders. RESULTS _STAT3_ FUNCTIONALLY TUNED GENE SIGNATURE
Brain tumor gene expression drives disease progression and patient survival outcome4, suggesting that druggable pathways may be revealed through genomic and transcriptomic profiles. STAT3
represents the final molecular switch that is activated prior to the PMT process that typifies highly aggressive and recurrent GBMs6. We hypothesize that the STAT3 pathway stratifies
patients for their likely response to STAT3 inhibition therapy. As any signaling pathway is better represented by a set of genes than a single candidate, we established a transcriptomic
signature reflecting the STAT3 pathway activation status (Supplementary Data 1). We prioritized genes that contribute functionally to the STAT3 pathway and correlate with prognostic outcome.
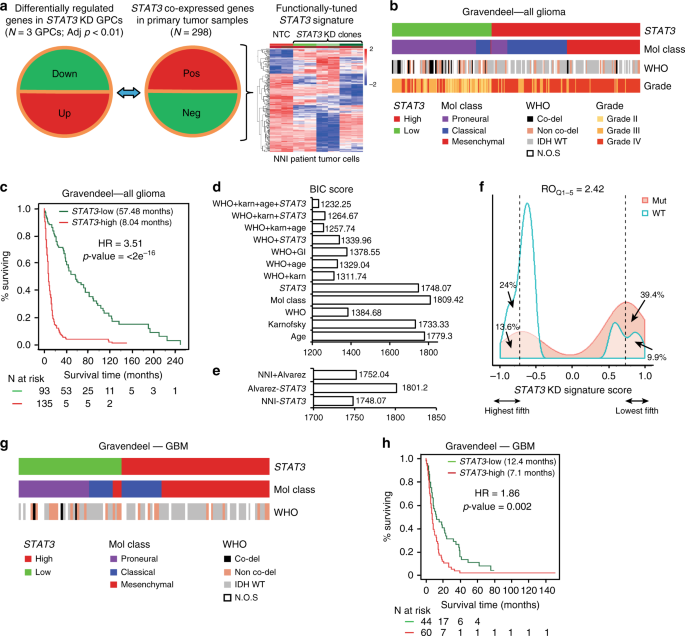
_STAT3_ co-expressed genes from the Rembrandt patient database (Fig. 1a, middle panel) that displayed inverse expression upon _STAT3_ KD in patient-derived GBM-propagating cells (GPCs; Fig.
1a, left panel) were identified to form the _STAT3_ “functionally tuned” gene signature (Fig. 1a, right panel)18. The latter approach ensures that only genes downstream and modulated by the
STAT3 pathway would be selected. We verified STAT3 protein expression upon lentiviral-mediated KD in three GPCs and observed significant mitigation of viability, sphere-forming frequency,
and sphere size (Supplementary Fig. 1a–l). We established a positive enrichment of the JAK/STAT signaling pathway in our functionally tuned gene signature, and defined it as _STAT3_-high,
while an inverse correlation defined the _STAT3_-low gene signature (Supplementary Fig. 1m; Supplementary Data 2). We then tested the robustness of our _STAT3_ composite signature in two
clinical databases, Gravendeel and TCGA (Gravendeel, Fig. 1b–f; TCGA, Supplementary Fig. 2a, b)3,19. Accordingly, contingency analyses accounting for TCGA GI molecular subtypes and the WHO
classification scheme including molecular and clinical indicators, demonstrate that _STAT3_-high defines a patient cohort enriched in the mesenchymal and classical molecular subtypes,
typifying highly aggressive and recurrent gliomas (Supplementary Table 1a). These tumors also demonstrated a significant enrichment of 1p/19q non-co-deletion and IDH-WT status. _STAT3_-low
tumors, in contrast, comprise mostly of low-grade gliomas (LGGs), and the proneural molecular subtype with enrichment of 1p/19q co-deletion and IDH-Mut (mutant) status, representing tumors
of better prognosis and responsiveness to current chemotherapy (Fig. 1b, and additional clinical database TCGA, Supplementary Fig. 2a)20. Figure 1c demonstrates patient survival
stratification based on our “functionally tuned” _STAT3_ gene signature. _STAT3_-high defines poor prognosis patients, while _STAT3_-low patients survived significantly longer (logrank _p_
value < 2 × 10⁻¹⁶) (additional clinical database, TCGA; Supplementary Fig. 2b). Further univariate and multivariate analyses suggested that the _STAT3_ signature functions as an
independent predictor and is not confounded by current molecular and clinical indicators (Supplementary Table 1b). We demonstrate using the Bayesian Information Criterion (BIC) method that a
combination of _STAT3_, the WHO classification system that incorporates the IDH and 1p/19q co-deletion status, and Karnofsky score (measures patient’s functional status) presented the best
statistical model accounting for patient survival (Fig. 1d). In such plots, a reduction in the BIC score by an absolute value of 10 fulfills the industry standard for advancing a therapeutic
strategy into clinical trial21. In addition, our _STAT3_ signature outperformed the existing Alvarez _STAT3_ gene signature previously established to be a pan-solid, tumor-specific profile
for glioma patient prognosis (Fig. 1e)22. The relative odds of correlation between _STAT3_ signature and IDH mutation is 2.42 in a diagnostic metrics test. Patients with a negative signature
score (_STAT3_-high) are 2.42 times more likely to be IDH-WT than those with a positive signature score (_STAT3_-low, IDH-Mut) (Fig. 1f). As GBM patients portend the poorest prognosis over
a decade, with little improvement even with the best standard-of-care drug temozolomide (TMZ), we extended our analyses to exclusively GBM tumors in both Gravendeel and TCGA databases (Fig.
1g, h and Supplementary Fig. 2c, d). Similar prognostic association was observed in GBM patients for _STAT3_-high and -low subtypes (Gravendeel, logrank _p_ value = 0.002, Fig. 1h; TCGA,
logrank _p_ value = 0.009; Supplementary Fig. 2d). _STAT3_-high significantly enriched for the mesenchymal and classical subtypes, with predominantly IDH-WT and 1p/19q non-co-deletion status
(Gravendeel, Fig. 1g; TCGA, Supplementary Fig. 2c; Supplementary Table 1b). Taken together, our data suggest that the _STAT3_ pathway contributes to the molecular heterogeneity of GBM
tumors. _STAT3_-HIGH GROUP SHOWS IMPROVED RESPONSE TO STAT3 INHIBITORS We stratified our GPCs based on our _STAT3_ gene signature and observed a consistent expression of increased
phospho-STAT3 (pSTAT3) in the _STAT3_-high group (NNI-21, -24, -12), in contrast to the _STAT3_-low cells (NNI-11, -20 and -23) (Fig. 2a and Supplementary Fig. 3). _STAT3_-high tumor cells
demonstrated significantly lower half maximal inhibitory concentrations (IC50) upon treatment with STAT3 inhibitors, compared to _STAT3_-low cells (Fig. 2b–d and Supplementary Fig. 3c–e).
AZD1480, Stattic, and WP1066 represent JAK/STAT inhibitors commonly used; in particular, AZD1480 has been shown to exhibit specific activity against Jak2 kinase, mitigating tumor cell
proliferation in a variety of solid tumors23. _STAT3_-high cells also showed reduced cell viability and gliomasphere-forming ability when compared to _STAT3_-low cell lines (Fig. 2e–j).
Furthermore, using a recovery assay that allows treated cells to recover in the absence of the drug to ascertain prolonged and irreversible inhibition, _STAT3_-high cells showed significant
mitigation of viability, self-renewal, and invasive potential (Fig. 2k–m). In contrast, _STAT3_-low cells were minimally inhibited by the STAT3 inhibitors and instead developed resistance.
Finally, utilizing the orthotopic patient-derived xenograft (PDX) mouse model, mice implanted with AZD1480-treated NNI-24 (_STAT3_-high) cells demonstrated better survival in a
dose-dependent manner (Fig. 2n and Supplementary Table 2, Kaplan–Meier statistics). Compared to NNI-20 (_STAT3_-low) mice, NNI-24 mice demonstrated an approximate 2.5-fold increased median
survival difference between matched dimethyl sulfoxide (DMSO) solvent control and AZD1480-treated groups (Fig. 2o and Supplementary Table 2). All GPCs and PDX tumors were sequenced and
defined as IDH-WT (Supplementary Fig. 3f, g). These findings support the application of our _STAT3_ gene signature to stratify and identify patient cohorts most likely to receive treatment
benefit from STAT3 inhibition therapy, while further cautioning against the use of such inhibitors in _STAT3_-low patients due to the development of resistance mechanisms. _IGFBP2_ CAUSES
CHEMORESISTANCE IN _STAT3_-LOW GLIOMA CELLS As important as identifying potential responders, we explored mechanisms underlying resistance in the _STAT3_-low group, so that therapeutic
options may be defined to sensitize these individuals to chemotherapy. We first evaluated our _STAT3_ functionally tuned gene signature and prioritized those candidates most highly variable
between _STAT3_-high and _STAT3_-low groups. Since upregulated genes better serve as therapeutic targets, we focused on candidates that exhibited a dose-dependent increase in _STAT3_-low
cells after treatment with AZD1480 (Fig. 3a). These same candidates were then verified to display an inverse pattern (i.e., dose-dependent reduction) in the _STAT3_-high cells subjected to
similar treatment, for the reason that this candidate list should exhibit differential expression between the two stratified GPC groups (Supplementary Data 3). Similar results were obtained
with Stattic and WP1066 treatment, thus supporting the specificity of targeting the STAT3 signaling axis (Supplementary Fig. 4a, b). Six genes were identified, namely, insulin-like growth
factor binding protein 2 (_IGFBP2_), neural precursor cell expressed, developmentally downregulated 9 (_NEDD9_), synaptosomal-associated protein 23 (_SNAP23_), guanosine diphosphate
(GDP)-mannose pyrophosphorylase A (_GMPPA_), E26 transformation-specific containing gene (_ELK3_, ETS domain containing protein), and kelch domain containing 8A (_KLHDC8A_). By surveying
literature, we prioritized _IGFBP2_ as it is one of the six similar genes that sequester intracellular IGF-1 and for which clinical trials are currently in progress to evaluate anti-IGF-1R
inhibitors in a variety of solid tumors. Since kinases represent dominant therapeutic targets in major pharmaceutical pipelines, we established the approach of using biological evidence to
substantiate our computational predictions, by measuring phosphorylation levels of 144 kinases in _STAT3_-signature-stratified GPCs using the PamChip kinome screen. We developed a novel
computational pipeline on kinome assay data by integrating phospho-chemical interactions with functional genomics data through kinase-substrate databases (Supplementary Fig. 4c). Briefly,
the phosphorylation dynamics of kinase substrates were measured as quantitative readouts. These peptide readouts were mapped with relevant kinases using protein databases such as Kinexus,
PhosphoSite, Reactome, and human protein reference databases24,25,26. We calculated the quantitative summary of kinase activity using a rank-based clustering method as described in the
“Methods” section. Subsequently, the differential kinase regulation upon AZD1480 treatment was estimated using the linear regression model27. Our approach confirms IGF-1R as a top-ranking
tyrosine kinase uniquely and biochemically elevated in _STAT3_-low tumors upon treatment with AZD1480 (Fig. 3b and Supplementary Table 3). Treatment of GPCs with AZD1480 demonstrated an
increase in pSTAT3 and IGFBP2 expression in the nuclear fraction of _STAT3_-low but not of _STAT3_-high cells, consistent with _IGFBP2_ as a target of STAT3 transcription factor (Fig. 3c).
We verified a dose-dependent increase of secreted IGFBP2 and IGF-1 protein in NNI-20 cells treated with AZD1480 (_STAT3_-low GPC) (Fig. 3d). Furthermore, we observed a significant increase
of IGFBP2 and IGF-1R proteins in _STAT3_-low cells (NNI-20, -23) upon AZD1480 treatment, compared to _STAT3_-high cells (NNI-21, -24) (Fig. 3e). Our data here provide a basis to exploring
the IGF-1R pathway in _STAT3_-low cells. INHIBITION OF STAT3 AND IGF-1R SENSITIZES _STAT3_-LOW CELLS We first attenuated IGF-1R signaling pathway by targeting its effector, _IGFBP2_, using
lentiviral-mediated short hairpin RNA (shRNA) KD (NNI-20, Fig. 4a–c; NNI-23, Supplementary Fig. 5a–c). KD of _IGFBP2_, resulting in IGFBP2 protein reduction, significantly sensitized
_STAT3_-low cells to STAT3 inhibitor treatment, demonstrated by decreased viability and clonogenic potential. More importantly, _IGFBP2_ KD in _STAT3_-low cells sensitized them to AZD1480
and mitigated their viability and self-renewal capacity. This suggests that dual targeting of STAT3 and the IGF-1R/IGFBP2 signaling axis presents a viable therapeutic strategy to abolish
resistance in _STAT3_-low GPCs. To effectively target the STAT3/IGFBP2/IGF-1/IGF-1R feed-forward mechanism in the _STAT3_-low GPCs, we conducted dual inhibition of both STAT3 and IGF-1R
pathways using AZD1480 and Linsitinib, an experimental drug candidate targeting IGF-1R used in various malignancies. This strategy demonstrated synergistic effect in two _STAT3_-low cells in
vitro and in vivo (NNI-20, Fig. 4d–h; NNI-23, Supplementary Fig. 5d–f). We observed a significant dose-dependent reduction of cell viability and self-renewal upon single agent treatment
alone (approximately 55% viability) but greatly improved synergistic outcome in the presence of both AZD1480 and Linsitinib (up to approximately 10% viability). We subsequently generated
orthotopic xenografts to evaluate tumorigenicity using these same pretreated GPC lines where, as expected, dual inhibition of STAT3 and IGF-1R conferred the greatest survival benefit and
extended tumor latency in the _STAT3_-low group of mice (Fig. 4g, h). Protein expression of pSTAT3, total STAT3, IGFBP2, and IGF-1R were verified in these xenografted tissues (Fig. 4i, j and
Supplementary Fig. 5g–l). We propose that, in _STAT3_-low cells, phosphorylated STAT3 activates _IGFBP2_ transcription, which increases the production of IGF-1. This in turn triggers the
activation of the IGF-1R pathway, contributing to an as yet undescribed feed-forward mechanism (Supplementary Fig. 6). These results suggest a potential therapeutic strategy utilizing a dual
inhibitor approach to sensitize the _STAT3_-low GBM patient subgroup. AZD1480 AND/OR LINSITINIB SYNERGIZE WITH TMZ To assess the efficacy of our proposed therapeutic strategies in either
_STAT3_-high or -low patient cohorts, we first treated both _STAT3_-stratified GBM cells with DMSO solvent, 0.5 μM AZD1480 with/without TMZ at 20–200 μM range (Fig. 5a). These in vitro TMZ
concentrations are routinely used in literature28,29,30. We observed significant dose-dependent mitigation of GBM cell viability in the presence of AZD1480 and 50–200 μM TMZ. In contrast,
_STAT3_-low GBM cells demonstrated a marginal, <20% decrease in viability (albeit significant) with AZD1480 and 20–200 μM TMZ. We evaluated the combination index (CI) plot where increased
synergism with TMZ correlated with CI values of <1 (Fig. 5b). The CI values were calculated using the CompuSyn software for evaluation of drug combinations31,32. Next, we assessed the
fraction affected (i.e., reduced viability) in _STAT3_-low cells after treatment with AZD1480, Linsitinib, or both (Fig. 5c). Similarly, our CI plot showed increasing synergism with TMZ, as
denoted by the decreasing CI value (Fig. 5e). We also carried out similar AZD1480 and TMZ treatment in _STAT3_-low cells with _IGFBP2_ KD for definitive mechanistic implication (Fig. 5d).
The rationale arose from our earlier data showing that STAT3 activation leads to _IGFBP2_ gene transcription, which in turn stimulates the production of IGF cytokine (Supplementary Fig. 6).
Our CI plot demonstrated synergism with TMZ at 50–200 μM range (Fig. 5f). Collectively, our in vitro data provide strong evidence for both STAT3 inhibition and dual STAT3/IGF-1R inhibition
in _STAT3_-high and -low GBM cells, respectively, and synergize with TMZ, thus suggesting the advancement of both therapeutic approaches in a clinical setting. To provide further support of
our in vitro data, we focused on demonstrating that STAT3 inhibitors can selectively target _STAT3_-high GBM tumors. The premise of our approach lies in TCGA studies showing that
transcriptomic expression drives GBM disease progression and prognostic outcome3,4. We tapped into a recent article where drug and disease signature integration identifies synergistic
combinations in GBM33. This study utilized the Library of Integrated Network-Based Cellular Signatures (LINCS) database where several commercial cancer cell lines were treated with Food and
Drug Administration-approved and experimental small molecule drugs, and the transcriptomic profile of each treated cell line was acquired. Primary GBM cells were similarly treated with these
drugs including TMZ with radiation for the purpose that synergistic interactions could be assessed with the standard-of-care treatment regimen for GBM patients. The authors further mapped
the association of transcriptomic patterns to prognostic information in TCGA, thus identifying clinically relevant drug combinations capable of reversing the disease transcriptomic profile.
In our specific scenario, the disease pattern is defined by our _STAT3_ functionally tuned gene signature for which we previously demonstrated phenotypic effects and prognostic association
(Figs. 1 and 2 and Supplementary Fig. 3a, b). Thus, using an orthogonal plot, we identified drugs that demonstrated low concordance with TMZ and high discordance with the _STAT3_-high tumor
phenotype (Fig. 5g). This indicates that the drug acts in a synergistic manner with TMZ and is capable of reversing the disease transcriptomic profile. Interestingly, Ruxolitinib, a Jak2
inhibitor, and AZD1480 emerged in the top ranked drugs (Supplementary Table 4). These drugs thus have the potential to reverse the _STAT3_-high disease profile and support their use in
targeting the PMT process that typifies highly aggressive and recurrent tumors. PROFILING RECURRENT TUMORS PRIOR TO TREATMENT ADMINISTRATION Conventional methods to detect STAT3 pathway
activation are by immunohistochemistry where pSTAT3-specific antibodies are used on frozen or paraffin-embedded tumor sections. We provide data that our _STAT3_ functionally tuned gene
signature outperforms pSTAT3 status alone. We showed that pSTAT3 staining in our NNI patient tumors was inadequate to stratify the _STAT3_-high and -low patient groups, for which we
previously demonstrated significant correlation with IC50 values (Fig. 2b–d and Fig. 6a). Briefly, comparing various methods of _H_-score, IC50 values, and our gene signature score (Nearest
Template Prediction (NTP) score), we showed that there was no significant correlation of _H_-score to either the NTP score or IC50 values (Fig. 6b, c and Supplementary Fig. 7). However, when
we compared the IC50 values to the NTP score, we derived a significant negative correlation (Fig. 6d), suggesting that the _STAT3_ functionally tuned gene signature is able to accurately
profile sensitive and resistant patient cohorts. To assess the utility of STAT3 inhibitors in recurrent patient tumors, a likely clinical scenario where individuals may be prescribed novel
agents, and when PMT characterizes aggressive recurrence, we evaluated TCGA glioma-intrinsic subtypes (GISs) with STAT3 status as defined by the _STAT3_ gene signature4. Our previous data
showed that _STAT3_-high enriched for almost equal patient numbers of mesenchymal and classical subtypes in either of glioma or GBM cohort (Gravendeel, Fig. 1b, g; TCGA, Supplementary Fig.
2a, c). We demonstrate that the mesenchymal patient cohort predominantly maintains its _STAT3_-high profile (86%), whereas the _STAT3_-low group underwent subtype switching to _STAT3_-high
(100%) (Supplementary Fig. 8a). However, this pattern was not clearly marked in the non-mesenchymal cohort (classical, typifies gain-of-function _EGFR_ mutations, and proneural).
Specifically, classical _STAT3_-high patients had an equal chance to undergo subtype switching to _STAT3_-low. Although these results strongly support that mesenchymal patient groups can
potentially benefit from STAT3 inhibition therapy, they also indicate that the dual inhibition strategy would most likely benefit patients who had undergone STAT3 inhibition therapy at first
diagnosis but gained the resistant _STAT3_-low profile upon recurrence. A molecularly well-annotated brain tumor resource to enable preclinical studies is of paramount importance. Our
collection comprises GBM tumor tissue that compares with tumors acquired by TCGA (Supplementary Fig. 8b–f). We show that our xenograft tumors recapitulate the molecular subtypes of their
patients’ original tumors and are clustered with TCGA’s proneural, classical, and mesenchymal groups. Furthermore, these tumors demonstrate similar enrichment of neural cell lineages
previously associated with tumor-initiating and propagating capacity2,5,34. The tumor purity score of our resource is 62%, comparable with 59% of the TCGA collection (Supplementary Fig.
8g–i). DISCUSSION The utility of STAT3 inhibitors has largely been confined to myeloproliferative disorders, in part due to their poor blood–brain barrier (BBB) penetration. In polycythemia
vera, the STAT3 pathway correlates with poorer prognosis and is constitutively active due to the presence of the _JAK2_ V617F mutation12. However, no such mutation exists in GBM tumors,
although STAT3 has been implicated in the proliferation and self-renewal of GBM stem-like cells13,14. We have also observed that increased _STAT3_-wild-type expression correlates with poor
prognostic outcome. This suggests that other mechanisms of STAT3 pathway activation remains, and current STAT3 inhibitor molecules with efficient BBB penetration capability may find utility
in GBM treatment. To add to the complexity of solid tumors, several studies have suggested the presence of molecular heterogeneity3. This may account for the frequently observed
inter-patient variability to treatment response. Indeed, the mesenchymal profile has been associated with the poorest prognosis, while the proneural subtype typifies the more sensitive and
treatable cohort4. Currently, routine pathological diagnosis uses morphological features to define the grades of tumor tissue. We now know that such histological approaches are woefully
inadequate to influence treatment decisions. Precision oncology applies these concepts of molecular markers and stratification to determine targeted therapeutic strategies. We hypothesize
that most signaling pathways, such as the IL-6/STAT3 axis, could be represented by a set of genes defining key regulatory modules. The premise of our hypothesis rests in being able to map
these modules in clinical databases comprising molecular information and indicators used by the physician35,36. Such a strategy facilitates the quantitative analysis of multi-dimensional
data represented as molecular information, magnetic resonance imaging scans, and clinical indicators used to assess the patient’s disease and functional status. We previously demonstrated
the utility of such a strategy in determining tumor cell resistance and invasiveness37,38,39,40,41. In this study, we identified _STAT3_-high to describe a cohort of both glioma and GBM
patients who had poorer prognosis. This subgroup comprised of genes previously implicated in ATP-binding cassette (ABC) drug transporters, RTK signaling, and tumor cell invasiveness. Our
method to winnow down the gene list associated with _STAT3_ combined functional validation with co-expressed genes in clinical databases. This reduced our scope to only clinically relevant
genes with phenotypic changes in _STAT3_-perturbed primary GBM cells and PDX mouse models. Our _STAT3_ signature is not confounded by current clinical and molecular classification, thereby
emphasizing the molecular heterogeneity contributed by this mechanistic pathway. While we showed significant extended survival after implanting AZD1480-pretreated _STAT3_-high GBM cells in
immunocompromised mice, we also identified the top ranking causative mechanism responsible for conferring increased resistance after STAT3 inhibition therapy in _STAT3_-low patients and
validated its biochemical activity using a kinome screen. GBM tumor cell resistance to targeted therapy is often attributed to the compensatory activation of RTKs42,43,44. Studies have
described the frequent activation of insulin receptor (InsR) and IGF-1R in GBM specimens and PDX cells at conferring resistance to EGFR inhibitors43,44,45, both frequently activated but
rarely amplified or mutated in GBM according to TCGA (<2%)46. IGFBP2 is the second most abundant IGF-binding protein (after IGFBP3), functions as a carrier for IGF-1 and likely promotes
tumor progression through IGF-1R pathway47. In gliomas, IGFBP2 is also often overexpressed48; moreover, increased expression of IGFBP2 has been implicated in reduced survival and resistance
to chemotherapy49. Therefore, our data support that the InsR/IGF-1R pathway may possibly be activated through an autocrine mechanism in a subgroup of GBM tumors. A novel pipeline for
analysis of the kinome screen data was implemented in this study, which involved assigning a “biological threshold” to the otherwise voluminous data typical of such screens. The successful
application of this method was subsequently confirmed in vitro and in mouse models implanted with Linsitinib-pretreated cells, a drug targeting IGF-1R. We thus propose a model where STAT3
activation results in binding to nuclear _IGFBP2_, with resultant secretion of IGF-1 cytokine that contributes in a novel feed-forward loop leading to IGF-1R activation. We envisage that
this autocrine mechanism can contribute in part to STAT3 activation, since both AZD1480 and Linsitinib dual targeting conferred a significant mitigation of tumor cell growth and
proliferation. As proof-of-concept, we treated _STAT3_-low (NNI-20, -23) and _STAT3_-high (NNI-21, -24) GBM cells with NT157, a selective inhibitor of insulin receptor substrate (IRS-1/2)
that has the potential to inhibit both IGF-1R and STAT3 signaling pathways in cancer and stromal cells of the tumor microenvironment50. We observed significant reduction of viability and
self-renewal of _STAT3_-low cells, at levels comparable to dual inhibition using AZD1480 and Linsitinib (Supplementary Fig. 9a–c). In contrast, _STAT3_-high cells treated with NT157
demonstrated marginal difference from AZD1480 treatment alone (Supplementary Fig. 9d, e), suggesting that IGF-1R targeting constitutes no additional benefit in this subgroup. Importantly, we
provided evidence that AZD1480 (in _STAT3_-high GBM cells) and AZD1480/Linsitinib (in _STAT3_-low GBM cells) synergized with TMZ to mitigate in vitro tumor cell viability. Using
transcriptomic information gleaned from clinical and small molecule-treated cell databases, we further identified Ruxolitinib and AZD1480 among the top ranked small molecules capable of
reversing the _STAT3_-high disease transcriptomic profile. While IGF-1R inhibition induces responses as monotherapy in sarcomas and with chemotherapy or targeted agents in common cancers,
negative Phase 2/3 trials in unselected patients prompted the cessation of several pharma-led programs51. We believe that, with TCGA studies in various cancers, intertumor and intratumor
molecular heterogeneity could conceivably play an essential role in patient stratification. Our study suggests the application of IGF-1R and STAT3 inhibition, in combination with TMZ, in
_STAT3_-low GBM tumors. In both databases using only the GBM cohort, the _STAT3_ functionally tuned gene signature stratified survival and significantly enriched for the IDH-WT (wild-type)
status, suggesting that the latter could act as a clinical molecular indicator for administering STAT3 inhibition therapy (Supplementary Table 1). This would be meaningful as the routine
inclusion of the _IDH1/2_ status is now incorporated into the revised 2016 WHO classification system. We further noted that the IDH-WT cohort consisted of approximately one third of
_STAT3_-low patients in both Gravendeel and TCGA databases (Supplementary Table 1a, contingency table). In this group, wrongful administration of STAT3 inhibitors without prior
stratification would lead to the development of resistance, as indicated by our data. Thus we believe that, even though the IDH-WT status is predominantly enriched in the _STAT3_-high group,
the application of the STAT3 composite signature to molecularly subtype the patients remains crucial in the decision to implement STAT3 or STAT3/IGF-1R inhibition therapy in the
_STAT3_-high and -low cohorts, respectively. We considered the likely scenario of tumor recurrence, typical of the disease’s highly infiltrative nature. Our analysis included profiling GBM
tumors at first diagnosis and at recurrence, with the finding that mesenchymal _STAT3_-high tumors largely maintained their molecular profile. In contrast, non-mesenchymal (classical,
proneural) tumors underwent molecular switching upon recurrence. In particular, classical tumors at first diagnosis (64%) switched subtypes at recurrence (_STAT3_-high, 57%; _STAT3_-low,
43%). This finding has three implications. First, it is imperative that serial molecular profiling be carried out on tumors at all stages to provide a clear decision to the use of STAT3
inhibitory molecules. The failure to stratify patients can potentially result in an unfavorable outcome caused by increased resistance in the _STAT3_-low cohort. Second, as STAT3 is the key
switch effecting PMT, its early implementation when the tumor is _STAT3_-high and non-mesenchymal could possibly mitigate its subtype switching. Lastly, we suggest that other mechanisms
beside EGFR activation can contribute to STAT3 signaling. Recent work by Bonni and colleagues suggested that _EGFRvIII_-GBM tumors are constitutively active for STAT3, through co-receptor
binding of EGFR and OSM52. They further postulated that _EGFR_-wild-type GBM tumors require EGF and OSM cytokines, beside co-receptor binding, to maintain active STAT3 signaling. The
classical subtype of GBM tumors is represented by _EGFR_ gain-of-function mutations, such as _EGFRvIII_3. Our earlier observation of subtype switching in classical tumors that were
originally _STAT3_-high thus suggests that additional mechanisms can contribute to STAT3 activation and that combinational therapies may be prescribed. Collectively, our effort identifies
potential drug agents applicable to both _STAT3_-high and -low patient cohorts. METHODS MATERIALS AND CELL LINES GBM tumor specimens from the National Neuroscience Institute (NNI) were
obtained with informed consent and de-identified in accordance with the SingHealth Centralised Institutional Review Board A, and GPC culture methods are described below37,38,39,53. All
experiments were conducted with low-passage GPCs for which we previously demonstrated maintenance of phenotypic, transcriptomic, and karyotypic features similar to the primary tumor53.
Briefly, tumors were processed according to Gritti et al. with slight modifications54. Cells were seeded at a density of 2500 cells/cm2 in chemically defined serum-free selection growth
medium consisting of basic fibroblast growth factor (20 ng/ml; Peprotech Inc., Rocky Hill, NJ), EGF (20 ng/ml; Peprotech Inc.), heparin (5 μg/ml; Sigma-Aldrich, St. Louis, MO), and
serum-free supplement (B27; 1×; Gibco, Grand Island, NY) in a 3:1 mix of Dulbecco’s modified Eagle’s medium (Sigma-Aldrich) and Ham’s F-12 Nutrient Mixture (F12; Gibco). The cultures were
incubated at 37 °C in a water-saturated atmosphere containing 5% CO2 and 95% air. To maintain the undifferentiated state of neurosphere cultures, growth factors were replenished every 2
days. Successful neurosphere cultures (1–4 weeks) were expanded by mechanical trituration using a flame-drawn glass Pasteur pipette, and cells were reseeded at 100,000 cells/ml in fresh
medium. SMALL MOLECULE INHIBITORS AND LENTIVIRAL VECTORS Small molecule inhibitor AZD1480 was obtained from SelleckChem and used at concentrations of 0.1, 0.5, 1, or 2 μM. Other STAT3 and
IGF-1R small molecule inhibitors were obtained from SelleckChem and used at their respective IC50 concentration. TMZ was obtained from Sigma-Aldrich and used at concentrations of 20, 50,
100, and 200 μM. Human lentiviral shRNA clones targeting _STAT3_ and _IGFBP2_ in pLKO.1 backbone were from GE Life Science (TRCN0000020840, TRCN0000020842, TRCN0000020843, RHS4080,
TRCN0000011033, and TRCN0000006574). Lentiviral shRNA vectors were co-transfected using the Lenti-X HTX Packaging System (Clontech, CA, USA) into HEK293T cells according to the
manufacturer’s instruction. Viral titer of supernatant collected was determined using Lenti-X™ p24 Rapid Titer Kit (Clontech) according to the manufacturer’s instructions. IGF-1R
C-terminal-deleted overexpression vectors were constructed using pCDH-CMV-MCS-EF1- GFP+ Puro vector (System Biosciences). The amplified product was digested with XbaI and NotI and ligated
into pCDH vector. Lentiviral particles were generated as described above. DOSE–RESPONSE CURVES, VIABILITY, AND INVASION ASSAYS Dose–response curves and cell viability were assessed using
alamarBlue® cell viability assay (Serotec, Oxford, UK) 5 and 10 days post-treatment, respectively37,38,39,53. Dose–response curves for each cell line were generated from a mean of triplicate
experiments using GraphPad Prism (GraphPad Software, Inc; USA) and IC50 values were computed from 10-point titration curves ranging from 10−4 to 102 μM. For invasion assay, 50,000 cells
were added to the upper compartment of the Corning® BioCoat™ Matrigel® invasion chamber (BD Biosciences, San Jose, CA) and 2% fetal calf serum was supplemented into the lower compartment.
Cells were incubated for 24 h and the lower surface was subsequently stained with 0.005% crystal violet (Sigma-Aldrich). The number of cells from five random fields having migrated to the
bottom chamber was counted. CI VALUES CI values based on Loewe’s additivity model were determined to assess the nature of drug–drug interactions that can be additive (CI = 1), antagonistic
(CI > 1), or synergistic (CI < 1) and effect levels (fraction affected (Fa)). CI and Fa values were calculated using the CompuSyn software (ComboSyn Inc., Paramus, NJ), following the
method by Chou et al.31,32. PROTEIN ANALYSIS Cells were lysed in buffer containing 0.5% sodium deoxycholate, 1% NP-40 detergent, 0.1% sodium dodecyl sulfate (SDS), 0.15 M NaCl, 10 mM
Tris-HCl pH7.4, and protease and phosphatase inhibitor cocktail tablets (Roche, Indianapolis, IN). Approximately 25 µg of heat-denatured protein lysate were resolved on 8% SDS polyacrylamide
gel and electrotransferred onto polyvinylidene difluoride membranes (Millipore). The following antibodies were used for protein analysis: anti-pSTAT3 (Tyr705; 1:1000; CST, #9138),
anti-STAT3 (1:1000; CST, #9139), anti-IGFBP2 (1:1000; CST, #3922), anti-pIGF-1R (Tyr1135/1136; 1:1000; CST, #3024), anti-IGF-1R (1:1000; Santa Cruz, #712), and anti-β-actin (1:10,000;
Sigma-Aldrich A5441). Anti-mouse or -rabbit (1:10,000; CST) IgG horseradish peroxidase -linked secondary antibody was used. All antibodies were diluted in 5% bovine serum albumin in 10 mM
Tris-HCl pH 7.4, 100 mM NaCl, and 0.1% Tween® 20 (Merck). Membranes were processed per standard procedures and detected using the chemiluminescence detection kit SuperSignal West Pico or
Femto (Thermo Scientific) according to the manufacturer’s instructions. Protein bands were visualized using SYNGENE G:Box, iChemiXT. Protein expression was quantitated with the Quantity One®
software (Bio-Rad Laboratories), normalized against β-actin levels. ENZYME-LINKED IMMUNOSORBENT ASSAY Cells were lysed in buffer containing 0.5% sodium deoxycholate, 1% NP-40 detergent,
0.1% SDS, 0.15 M NaCl, 10 mM Tris-HCl pH7.4, and protease and phosphatase inhibitor cocktail tablets (Roche, Indianapolis, IN). One μg of protein lysates was analyzed on enzyme-linked
immunosorbent assay kits as per the manufacturer’s protocol in triplicates. IDH SEQUENCING Genomic DNA was extracted from cell lines and PDXs using the DNeasy Blood & Tissue Kit (Qiagen,
Hilden) in accordance with the manufacturer’s protocol. PCR amplifications was performed in a total volume of 25 μl with 50 ng of sample (including no template control), using _Pfu_ DNA
Polymerase (Promega) according to the manufacturer’s protocol. Cycle parameters were: initial denaturation at 95 °C for 5 min, followed by 40 cycles of 95 °C for 30 s, 50 °C for 30 s, 72 °C
for 90 s, and a final extension at 72 °C for 7 min. PCR products were purified using Wizard® SV Gel and PCR Clean-up System (Promega, USA) and sequenced using the BigDye® Terminator v3.1
Cycle Sequencing Kit (Applied Biosystems, USA). Primers used are as follows: _IDH1_ Forward 5′-AATGAGCTCTATATGCCATCACTG-3′; _IDH1_ Reverse 5′-TTCATACCTTGCTTAATGGGTGT-3′; _IDH1_ sequencing
5′-AATGAGCTCTATATGCCATCACTG-3′; _IDH2_ Forward 5′-ATTCTGGTTGAAAGATGGCG-3′; _IDH2_ Reverse 5′-CAGAAGAAAGGAAAGCCACG-3′; _IDH2_ sequencing 5′-ATTCTGGTTGAAAGATGGCG-3′. IMMUNOHISTOCHEMISTRY
Tissue sections were stained with the following antibodies: anti-pSTAT3 antibody (1:100, CST, #9145) and anti-IGF-1R antibody (1:400, CST, #14534). For quantitative analysis, the percentage
of stained tumor cells and intensity of staining were evaluated under high-power fields (×400) on tissue sections using optical microscopy. _H_-scores were then derived from both the
staining intensity (scale of 0–3) and the percentage of positive cells (0–100%), generated a score ranging from 0 to 3. Briefly, the percentage of weakly stained cells was multiplied by one
plus moderately stained cells multiplied by two plus strongly stained cells multiplied by three. At least five random fields were counted and scoring was performed blinded to clinical data.
QUANTITATIVE REAL-TIME REVERSE TRANSCRIPTION PCR RNA was isolated using TRI Reagent® (Sigma-Aldrich) and reverse transcribed into cDNA using the Superscript® III First-Strand Synthesis
System Kit (Life Technologies). Cycle parameters were: 40 cycles of 95 °C for 10 s, 55 °C for 10 s, and 72 °C for 5 s. Real-time PCR was performed on Roche LightCycler® 96 Instrument using
FastStart Essential DNA Green Master (Roche Life Science). Each real-time PCR was done in triplicate, and the level of each gene’s expression was determined relative to hypoxanthine
phosphoribosyltransferase. Gene-specific primers used are as follows: _STAT3_ F-GGGAGAGATTGACCAGCAGT, R-CTGCACTCTCTTCCGGACAT; _ELK3_ F-TCAAGACGGAGAAGCTGGAG, R-CCGAGATGAGAAGGGTGAGG; _BIRC2_
F-CTCCAGCCTTTCTCCAAACC, R-AGTTACTGAGCTTCCCACCA; _FZD1_ F- GCCCTCCTACCTCAACTACC, R-CAGCCGGACAAGAAGATGA; _SLF35F5_ F-CTGTGGGGAAACTTACTGCA, R-CCAGTACAACGCCTCCAATG; _KLHDC8A_
F-CGGGTCTACTGCTCCCTG, R-TGTTGTACATCTCCACGACCT; _GMPPA_ F-TCACCCAGTTCCTAGAAGCC, R-CTGTTAGCCGTAGTGCCAAG; _SNAP23_ F-AGGATGCAGGAATCAAGACCA, R-CTCCACCATCTCCCCATGTT; _NEDD9_
F-AGCTCAGGACAAAAGGCTCT, R-GCAACAGCTCCCTTGACAAA; _DTX3L_ F- TCACAAGCAGAAACACCGTC; R-GTCACCACACACCTTCTCA; _CTNNA1_ F-GCAGCCAAAAGACAACAGGA, R-TGTGAGGCATCGTCTGAGG; _NAA38_
F-GTCAAGCAGCAAGATGGAGG, R-GCGCATAGTCTTGTTGAGCA; _ITFG3_ F-ACACCAACAGCAGCAACAATT, R-AATGAAAGAACTGGGTCTGCC; _IGFBP2_ F-GGCTTGGTTGGAAGACTGAT, R-CATTTTCAAAGGCCTCACGC ANIMAL STUDIES Mice were
handled according to approved guidelines of the Institutional Animal Care and Use Committee of the National Neuroscience Institute, Singapore. Briefly, orthotopic intracranial implantations
were carried out using 6–8-week-old NOD-SCID gamma mice (NSG, NOD.C_g_-_Prkdcscid II2rgtm1Wjl_/SzJ, Jackson Laboratories) as described below37,40. Five hundred thousand pretreated cells were
injected into the following coordinates: antero-posterior = +1 mm; medio-lateral = +2 mm; dorso-ventral = −2.5 mm. Mice were euthanized by transcardiac perfusion with 4% paraformaldehyde
upon presentation of neurological deficits. Kaplan–Meier survival curves were plotted to show survival differences. A logrank test was adapted to estimate the survival difference between the
_STAT3_-high and _STAT3_-low patient group using Prism 5 (GraphPad Software, San Diego, CA). Multivariate Cox Regression model was fitted to identify the significant clinical covariates
associated with survival. A _p_ value of <0.05 was defined as significant association of covariates for survival. The statistical significance of correlation was evaluated using
Spearman’s rank correlation test. STATISTICAL ANALYSIS Data are expressed as means ± standard error of the mean (SEM) of at least three independent experiments. Student’s _t_ or Mann–Whitney
_U_ test was used where appropriate. _p_ ≤ 0.05 was accepted as statistically significant. Survival analyses were performed using the Kaplan–Meier method, with the logrank test for
comparison. IC50 values of STAT3 small molecule inhibitors were calculated using nonlinear regression analyses based on dose–response curves. The investigators were not blinded to allocation
during experiments and outcome assessment. MICROARRAY ANALYSIS _STAT3_ knockdown GPCs were profiled on Affymetrix GeneChip® Human Genome U133 Plus 2.0 Array using the 3’ IVT Express Kit.
The Gene Expression Omnibus (GEO) accession number for the microarray data is GSE117905. Raw cel files were summarized with mas5 algorithm and log2-scaled and gene expression dataset was
created. All data pre-processing analysis was carried out by R/Bioconductor packages. A linear model was regressed to assess the differentially expressed genes between _STAT3_ KD and
non-targeting control profiles (adjusted _p_ value < 0.01) in NNI GPCs (_N_ = 3) as described in R/limma packages27. False discovery rate (FDR)-adjusted _p_ value of <0.05 was
considered as statistically significantly perturbed genes upon _STAT3_ KD. A subset of differential genes was extracted as _STAT3_ KD gene signature by applying a stringent criterion of
2-log2 fold change between KD clones and the control profiles. _STAT3_ FUNCTIONALLY TUNED GENE SIGNATURE To identify the _STAT3_ functionally tuned gene signature, we utilized the gene
expression data from the Rembrandt glioma patient database (_N_ = 390). First, we built a correlation matrix for 44,950 probesets by estimating the pair-wise rank correlation coefficient for
each probeset. The _STAT3_ co-expressed module was defined by the probesets that had a coefficient value >0.3. Both positively and negatively correlated probesets were combined as the
_STAT3_ co-expressed genes in primary tumor samples. The gene list was subsequently narrowed down by selecting only those candidates that showed inverse expression upon _STAT3_ KD. We
considered the intersection of genes upon genetic KD of _STAT3_ and _STAT3_ co-regulated transcript modules as the _STAT3_ functionally tuned gene signature (_N_ = 207). The list of genes
comprising the _STAT3_ functionally tuned gene signature is available as Supplementary Data 1. PATIENT STRATIFICATION The evaluation of our _STAT3_ functionally tuned gene signature was
performed on three glioma patient database resources: Gravendeel (_N_ = 276), TCGA all glioma patients (_N_ = 672), and TCGA GBM microarray cohort (_N_ = 558)3,19,55. All Affymetrix
microarray profiles were processed using standard MAS5 scaling algorithm available in R/affy packages56. For TCGA database, gene expression profiles and clinical data were downloaded using
R/TCGAbiolinks package57, and raw cel files for Gravendeel database were downloaded from GEO database (GSE16011). To evaluate the predictive ability of our gene signature, all patient
database was treated as an independent validation cohort and was interrogated using the NTP method available in R/CMScaller package58,59. The predicted classes for patient tumors with
statistical significance (_p_ value < 0.05 using 1000 permutation tests) were further evaluated for the prognostic association for overall survival in both glioma or GBM patient cohorts.
BIOINFORMATICS ANALYSIS GIS signatures defining the three molecular subgroups were interrogated using single-sample Gene Set Enrichment Analysis (GSEA) with resampling classification
strategy4,60. To understand the clinical association of 2016 WHO classification marker _IDH1_ status with _STAT3_ signature-stratified classes, we employed the relative odds estimation61.
The relative odds score was estimated from the proportion of highest fifth distribution and lowest fifth distribution of _STAT3_ signature score values for _IDH1_ phenotypes. BIC score was
calculated for each regression model for survival variability. GENE SET ENRICHMENT ANALYSIS GSEA was performed using the desktop GSEA software (v.2.2.2) to identify the enrichment of _STAT3_
KD transcriptome data against established molecular signatures available in public signature databases62. We interrogated 186 KEGG pathway gene sets from the Molecular Signatures Database
with the complete transcriptome as our background in the enrichment analysis. As our _STAT3_ KD transcriptome was generated on Affymetrix GeneChip® Human Genome U133 Plus 2.0 Array using 3’
IVT Express Kit, we used max_probe option to collapse the gene expression values of genes with multiple probesets. The overrepresentation of ranked genes score was calculated using weighted
running sum statistic option (_p_ = 2). The signal-to-noise ratio was applied to rank the genes enriched with the background pathway gene sets using 1000 permutations. The statistical
significance of gene ranking between non-target and _STAT3_ KD clones was defined by the nominal _p_ value <0.05. The GSEA ranked list is available as Supplementary Data 2. COMPUTATIONAL
ANALYTICAL PIPELINE FOR KINOME DATA We measured the phosphorylation kinetics of 144 kinases in _STAT3_ signature-stratified GBM cells using the PamChip technology. The computational pipeline
is represented in the flowchart (Supplementary Fig. 4b). Briefly, we integrated phosphorylated peptide measurements estimated from PamChip with _STAT3_ KD transcriptome using published
database resources24,25,26. We resolved the multiple peptide-substrate complexity by estimating the pair-wise correlations for every peptide catalogued in kinase-peptide matrix. The
quantitative mean of each peptide cluster was calculated by evaluating the ranks for the presence of large number of correlated peptides having strong expression and dynamic variation across
the experimental conditions. We interrogated a linear differential model to estimate the statistical significance between AZD1480- and DMSO-treated cells. A _p_ value of <0.1 was
considered as statistically significant. We mapped the AZD1480-altered kinase profiles with _STAT3_ KD transcriptomic profiles using two key gene-specific databases63,64. SYNERGYSEQ We
utilized the SynergySeq platform to identify compounds synergistic with TMZ to reverse _STAT3_-high disease signature in GBM patients33. The R/shiny package of SynergySeq platform along with
drug perturbed signature scores were downloaded from github (https://github.com/schurerlab/SynergySeq; cloned on April 29, 2019). First, we interrogated TCGA GBM patients (_N_ = 558) in
microarray database with our _STAT3_ functionally tuned gene signature using the NTP method available in R/CMScaller package58,59. The predicted classes for patient tumors with statistical
significance (_p_ value < 0.05 using 1000 permutation tests) were further evaluated to identify the differential disease gene signature. A disease signature of 6359 genes was identified
to be differential between _STAT3_-high versus _STAT3_-low GBM patients (FDR _p_ value < 0.0001). This _STAT3_-high GBM signature was interrogated as a disease signature, with TMZ as the
reference compound in the SynergySeq pipeline. The LINCS compounds that displayed high disease discordance and low concordance with the reference compound were determined as synergistic
small molecule candidates capable of reversing the disease signature based on the Loewe additive model65. The current evaluation included compounds from both the LINCS database and GBM-JQ1
study from the SynergySeq project (_N_ = 1679). DATA AVAILABILITY Data supporting the findings of this work are available within the paper and its Supplementary Information files. A
reporting summary for this article is available as a Supplementary Information file. The source data (excel file) containing the list of genes comprising the _STAT3_ functionally tuned
signature (Fig. 1a), Gene Set Enrichment Analysis (GSEA) ranked gene list (Supplementary Fig. 1m), and winnowed list of genes contributing to chemoresistance (Fig. 3a and Supplementary Fig.
4a, b) are provided. The source data are provided as a Source Data file. The microarray data that support the findings of this study are accessible at the GEO repository, under accession
numbers: _STAT3_ knockdown microarray data: GSE117905, Gravendeel microarray data: GSE16011, and TCGA molecular data (accession approval required):
https://portal.gdc.cancer.gov/projects/TCGA-GBM, https://portal.gdc.cancer.gov/projects/TCGA-LGG. REFERENCES * Louis, D. N. et al. The 2016 World Health Organization Classification of Tumors
of the Central Nervous System: a summary. _Acta Neuropathol._ 131, 803–820 (2016). Article Google Scholar * Alcantara Llaguno, S. et al. Malignant astrocytomas originate from neural
stem/progenitor cells in a somatic tumor suppressor mouse model. _Cancer Cell_ 15, 45–56 (2009). Article Google Scholar * Verhaak, R. G. et al. Integrated genomic analysis identifies
clinically relevant subtypes of glioblastoma characterized by abnormalities in PDGFRA, IDH1, EGFR, and NF1. _Cancer Cell_ 17, 98–110 (2010). Article CAS Google Scholar * Wang, Q. et al.
Tumor evolution of glioma-intrinsic gene expression subtypes associates with immunological changes in the microenvironment. _Cancer Cell_ 33, 152 (2018). Article CAS Google Scholar *
Zheng, H. et al. p53 and Pten control neural and glioma stem/progenitor cell renewal and differentiation. _Nature_ 455, 1129–1133 (2008). Article ADS CAS Google Scholar * Segerman, A. et
al. Clonal variation in drug and radiation response among glioma-initiating cells is linked to proneural-mesenchymal transition. _Cell Rep._ 17, 2994–3009 (2016). Article CAS Google
Scholar * Kumari, N., Dwarakanath, B. S., Das, A. & Bhatt, A. N. Role of interleukin-6 in cancer progression and therapeutic resistance. _Tumour Biol._ 37, 11553–11572 (2016). Article
CAS Google Scholar * Chen, Y. et al. STAT3, a poor survival predicator, is associated with lymph node metastasis from breast cancer. _J. Breast Cancer_ 16, 40–49 (2013). Article CAS
Google Scholar * Kusaba, T. et al. Activation of STAT3 is a marker of poor prognosis in human colorectal cancer. _Oncol. Rep._ 15, 1445–1451 (2006). CAS PubMed Google Scholar * Ludwig,
H., Nachbaur, D. M., Fritz, E., Krainer, M. & Huber, H. Interleukin-6 is a prognostic factor in multiple myeloma. _Blood_ 77, 2794–2795 (1991). CAS PubMed Google Scholar * Macha, M.
A. et al. Prognostic significance of nuclear pSTAT3 in oral cancer. _Head Neck_ 33, 482–489 (2011). Article Google Scholar * Jamieson, C. H. et al. The JAK2 V617F mutation occurs in
hematopoietic stem cells in polycythemia vera and predisposes toward erythroid differentiation. _Proc. Natl Acad. Sci. USA_ 103, 6224–6229 (2006). Article ADS CAS Google Scholar *
Sherry, M. M., Reeves, A., Wu, J. K. & Cochran, B. H. STAT3 is required for proliferation and maintenance of multipotency in glioblastoma stem cells. _Stem Cells_ 27, 2383–2392 (2009).
Article CAS Google Scholar * Wang, H. et al. Targeting interleukin 6 signaling suppresses glioma stem cell survival and tumor growth. _Stem Cells_ 27, 2393–2404 (2009). Article CAS
Google Scholar * Wieduwilt, M. J. & Moasser, M. M. The epidermal growth factor receptor family: biology driving targeted therapeutics. _Cell Mol. Life Sci._ 65, 1566–1584 (2008).
Article CAS Google Scholar * Dunne, P. D. et al. Cancer-cell intrinsic gene expression signatures overcome intratumoural heterogeneity bias in colorectal cancer patient classification.
_Nat. Commun._ 8, 15657–15657 (2017). Article ADS CAS Google Scholar * Sveen, A. et al. Colorectal cancer consensus molecular subtypes translated to preclinical models uncover
potentially targetable cancer cell dependencies. _Clin. Cancer Res._ 24, 794–806 (2018). Article CAS Google Scholar * Madhavan, S. et al. Rembrandt: helping personalized medicine become a
reality through integrative translational research. _Mol. Cancer Res._ 7, 157–167 (2009). Article CAS Google Scholar * Gravendeel, L. A. et al. Intrinsic gene expression profiles of
gliomas are a better predictor of survival than histology. _Cancer Res._ 69, 9065–9072 (2009). Article CAS Google Scholar * Cairncross, J. G. et al. Specific genetic predictors of
chemotherapeutic response and survival in patients with anaplastic oligodendrogliomas. _J. Natl Cancer Inst._ 90, 1473–1479 (1998). Article CAS Google Scholar * Kass, R. E. & Raftery,
A. E. Bayes Factors. _J. Am. Stat. Assoc._ 90, 773–795 (1995). Article MathSciNet Google Scholar * Alvarez, J. V. et al. A STAT3 gene expression signature in gliomas is associated with a
poor prognosis. _Transl. Oncogenomics_ 2, 99–105 (2007). Article Google Scholar * Hedvat, M. et al. The JAK2 inhibitor AZD1480 potently blocks Stat3 signaling and oncogenesis in solid
tumors. _Cancer Cell_ 16, 487–497 (2009). Article CAS Google Scholar * Hornbeck, P. V. et al. PhosphoSitePlus: a comprehensive resource for investigating the structure and function of
experimentally determined post-translational modifications in man and mouse. _Nucleic Acids Res._ 40, D261–D270 (2012). Article CAS Google Scholar * Keshava Prasad, T. S. et al. Human
Protein Reference Database-2009 update. _Nucleic Acids Res._ 37, D767–D772 (2009). Article CAS Google Scholar * Milacic, M. et al. Annotating cancer variants and anti-cancer therapeutics
in reactome. _Cancers (Basel)_ 4, 1180–1211 (2012). Article CAS Google Scholar * Ritchie, M. E. et al. limma powers differential expression analyses for RNA-sequencing and microarray
studies. _Nucleic Acids Res._ 43, e47 (2015). Article Google Scholar * Garnier, D. et al. Divergent evolution of temozolomide resistance in glioblastoma stem cells is reflected in
extracellular vesicles and coupled with radiosensitization. _Neuro Oncol._ 20, 236–248 (2018). Article CAS Google Scholar * Liu, N., Hu, G., Wang, H., Li, Z. & Guo, Z. PLK1 inhibitor
facilitates the suppressing effect of temozolomide on human brain glioma stem cells. _J. Cell. Mol. Med._ 22, 5300–5310 (2018). Article CAS Google Scholar * Ulasov, I. V., Nandi, S., Dey,
M., Sonabend, A. M. & Lesniak, M. S. Inhibition of Sonic Hedgehog and Notch pathways enhances sensitivity of CD133+ glioma stem cells to temozolomide therapy. _Mol. Med._ 17, 103–112
(2011). Article CAS Google Scholar * Chou, T.-C. Theoretical basis, experimental design, and computerized simulation of synergism and antagonism in drug combination studies. _Pharmacol.
Rev._ 58, 621 (2006). Article CAS Google Scholar * Chou, T.-C. Drug combination studies and their synergy quantification using the Chou-Talalay method. _Cancer Res._ 70, 440 (2010).
Article CAS Google Scholar * Stathias, V. et al. Drug and disease signature integration identifies synergistic combinations in glioblastoma. _Nat. Commun._ 9, 5315 (2018). Article ADS
Google Scholar * Cahoy, J. D. et al. A transcriptome database for astrocytes, neurons, and oligodendrocytes: a new resource for understanding brain development and function. _J. Neurosci._
28, 264–278 (2008). Article CAS Google Scholar * Lamb, J. The Connectivity Map: a new tool for biomedical research. _Nat. Rev. Cancer_ 7, 54–60 (2007). Article CAS Google Scholar *
Lamb, J. et al. The Connectivity Map: using gene-expression signatures to connect small molecules, genes, and disease. _Science_ 313, 1929–1935 (2006). Article ADS CAS Google Scholar *
Chong, Y. K. et al. ST3GAL1-associated transcriptomic program in glioblastoma tumor growth, invasion, and prognosis. _J. Natl Cancer Inst_. 108, djv326 (2016). * Koh, L. W. et al. A distinct
reactive oxygen species profile confers chemoresistance in glioma-propagating cells and associates with patient survival outcome. _Antioxid. Redox Signal._ 19, 2261–2279 (2013). Article
CAS Google Scholar * Ng, F. S. et al. Progenitor-like traits contribute to patient survival and prognosis in oligodendroglial tumors. _Clin. Cancer Res._ 18, 4122–4135 (2012). Article CAS
Google Scholar * Xu, L. et al. Targetable BET proteins- and E2F1-dependent transcriptional program maintains the malignancy of glioblastoma. _Proc. Natl Acad. Sci. USA_ 115, E5086–E5095
(2018). Article CAS Google Scholar * Yeo, C. W. et al. Parkin pathway activation mitigates glioma cell proliferation and predicts patient survival. _Cancer Res._ 72, 2543–2553 (2012).
Article CAS Google Scholar * Chakravarti, A., Loeffler, J. S. & Dyson, N. J. Insulin-like growth factor receptor I mediates resistance to anti-epidermal growth factor receptor therapy
in primary human glioblastoma cells through continued activation of phosphoinositide 3-kinase signaling. _Cancer Res._ 62, 200–207 (2002). CAS PubMed Google Scholar * Ma, Y. et al.
InsR/IGF1R pathway mediates resistance to EGFR inhibitors in glioblastoma. _Clin. Cancer Res._ 22, 1767–1776 (2016). Article CAS Google Scholar * Stommel, J. M. et al. Coactivation of
receptor tyrosine kinases affects the response of tumor cells to targeted therapies. _Science_ 318, 287–290 (2007). Article ADS CAS Google Scholar * Gong, Y. et al. Insulin-mediated
signaling promotes proliferation and survival of glioblastoma through Akt activation. _Neuro Oncol._ 18, 48–57 (2016). Article CAS Google Scholar * Cerami, E. et al. The cBio cancer
genomics portal: an open platform for exploring multidimensional cancer genomics data. _Cancer Discov._ 2, 401–404 (2012). Article Google Scholar * Holmes, K. M. et al. Insulin-like growth
factor-binding protein 2-driven glioma progression is prevented by blocking a clinically significant integrin, integrin-linked kinase, and NF-kappaB network. _Proc. Natl Acad. Sci. USA_
109, 3475–3480 (2012). Article ADS CAS Google Scholar * Dunlap, S. M. et al. Insulin-like growth factor binding protein 2 promotes glioma development and progression. _Proc. Natl Acad.
Sci. USA_ 104, 11736–11741 (2007). Article ADS CAS Google Scholar * Colman, H. et al. A multigene predictor of outcome in glioblastoma. _Neuro Oncol._ 12, 49–57 (2010). Article CAS
Google Scholar * Ibuki, N. et al. The tyrphostin NT157 suppresses insulin receptor substrates and augments therapeutic response of prostate cancer. _Mol. Cancer Ther._ 13, 2827–2839 (2014).
Article CAS Google Scholar * King, H., Aleksic, T., Haluska, P. & Macaulay, V. M. Can we unlock the potential of IGF-1R inhibition in cancer therapy? _Cancer Treat. Rev._ 40,
1096–1105 (2014). Article CAS Google Scholar * Jahani-Asl, A. et al. Control of glioblastoma tumorigenesis by feed-forward cytokine signaling. _Nat. Neurosci._ 19, 798–806 (2016). Article
CAS Google Scholar * Chong, Y. K. et al. Cryopreservation of neurospheres derived from human glioblastoma multiforme. _Stem Cells_ 27, 29–39 (2009). Article CAS Google Scholar *
Gritti, A. et al. Multipotential stem cells from the adult mouse brain proliferate and self-renew in response to basic fibroblast growth factor. _J. Neurosci._ 16, 1091–1100 (1996). Article
CAS Google Scholar * Ceccarelli, M. et al. Molecular profiling reveals biologically discrete subsets and pathways of progression in diffuse glioma. _Cell_ 164, 550–563 (2016). Article
CAS Google Scholar * Gautier, L., Cope, L., Bolstad, B. M. & Irizarry, R. A. affy-analysis of Affymetrix GeneChip data at the probe level. _Bioinformatics_ 20, 307–315 (2004). Article
CAS Google Scholar * Colaprico, A. et al. TCGAbiolinks: an R/Bioconductor package for integrative analysis of TCGA data. _Nucleic Acids Res._ 44, e71 (2016). Article Google Scholar *
Eide, P. W., Bruun, J., Lothe, R. A. & Sveen, A. CMScaller: an R package for consensus molecular subtyping of colorectal cancer pre-clinical models. _Sci. Rep._ 7, 16618 (2017). Article
ADS Google Scholar * Hoshida, Y. Nearest template prediction: a single-sample-based flexible class prediction with confidence assessment. _PLoS ONE_ 5, e15543 (2010). Article ADS
Google Scholar * Barbie, D. A. et al. Systematic RNA interference reveals that oncogenic KRAS-driven cancers require TBK1. _Nature_ 462, 108–112 (2009). Article ADS CAS Google Scholar *
Wald, N. J., Hackshaw, A. K. & Frost, C. D. When can a risk factor be used as a worthwhile screening test? _BMJ_ 319, 1562 (1999). Article CAS Google Scholar * Subramanian, A. et al.
Gene set enrichment analysis: a knowledge-based approach for interpreting genome-wide expression profiles. _Proc. Natl Acad. Sci. USA_ 102, 15545–15550 (2005). Article ADS CAS Google
Scholar * Marbach, D. et al. Tissue-specific regulatory circuits reveal variable modular perturbations across complex diseases. _Nat. Methods_ 13, 366–370 (2016). Article Google Scholar *
Olow, A. et al. An atlas of the human kinome reveals the mutational landscape underlying dysregulated phosphorylation cascades in cancer. _Cancer Res._ 76, 1733–1745 (2016). Article CAS
Google Scholar * Subramanian, A. et al. A next generation Connectivity Map: L1000 platform and the first 1,000,000 profiles. _Cell_ 171, 1437–1452 (2017). e1417. Article CAS Google
Scholar Download references ACKNOWLEDGEMENTS The computational work for this article was partially performed on resources of the National Supercomputing Centre Singapore
(https://www.nscc.sg). This research was supported by the Singapore Ministry of Health’s National Medical Research Council under its Translational and Clinical Research (TCR) Flagship
Programme–Tier 1 (NMRC/TCR/016-NNI/2016) and Clinician Scientist Award (NMRC/CSA-INV/0019/2017) to B.T.A. and an industry award (IRBENVOLEN01) to C.T. AUTHOR INFORMATION Author notes * These
authors contributed equally: Melanie Si Yan Tan, Edwin Sandanaraj. * These authors jointly supervised this work: Beng Ti Ang, Carol Tang. AUTHORS AND AFFILIATIONS * Neuro-Oncology Research
Laboratory, Department of Research, National Neuroscience Institute, Singapore, Singapore Melanie Si Yan Tan, Edwin Sandanaraj, Yuk Kien Chong, See Wee Lim, Lynnette Wei Hsien Koh &
Carol Tang * School of Biological Sciences, Nanyang Technological University, Singapore, Singapore Melanie Si Yan Tan, Edwin Sandanaraj, Lynnette Wei Hsien Koh & Nguan Soon Tan *
Singapore Institute for Clinical Sciences, Agency for Science, Technology and Research (A*STAR), Singapore, Singapore Edwin Sandanaraj & Beng Ti Ang * Department of Neurosurgery,
National Neuroscience Institute, Singapore, Singapore Wai Hoe Ng & Beng Ti Ang * Duke-National University of Singapore Medical School, Singapore, Singapore Wai Hoe Ng, Patrick Tan, Beng
Ti Ang & Carol Tang * Institute of Molecular and Cell Biology, Agency for Science, Technology and Research (A*STAR), Singapore, Singapore Nguan Soon Tan * Lee Kong Chian School of
Medicine, Nanyang Technology University, Singapore, Singapore Nguan Soon Tan * Cancer Science Institute of Singapore, National University of Singapore, Singapore, Singapore Patrick Tan *
Department of Physiology, Yong Loo Lin School of Medicine, National University of Singapore, Singapore, Singapore Beng Ti Ang * Division of Cellular and Molecular Research, Humphrey Oei
Institute of Cancer Research, National Cancer Centre, Singapore, Singapore Carol Tang Authors * Melanie Si Yan Tan View author publications You can also search for this author inPubMed
Google Scholar * Edwin Sandanaraj View author publications You can also search for this author inPubMed Google Scholar * Yuk Kien Chong View author publications You can also search for this
author inPubMed Google Scholar * See Wee Lim View author publications You can also search for this author inPubMed Google Scholar * Lynnette Wei Hsien Koh View author publications You can
also search for this author inPubMed Google Scholar * Wai Hoe Ng View author publications You can also search for this author inPubMed Google Scholar * Nguan Soon Tan View author
publications You can also search for this author inPubMed Google Scholar * Patrick Tan View author publications You can also search for this author inPubMed Google Scholar * Beng Ti Ang View
author publications You can also search for this author inPubMed Google Scholar * Carol Tang View author publications You can also search for this author inPubMed Google Scholar
CONTRIBUTIONS C.T., B.T.A., and E.S. designed the experiments and developed the methodology. M.S.Y.T., E.S., Y.K.C., S.W.L., L.W.H.K., N.S.T., P.T., B.T.A. and C.T. performed the experiments
and collected or analyzed the data. W.H.N. provided clinical material. C.T. and B.T.A. supervised the project, wrote the manuscript, and gave final approval for submission. CORRESPONDING
AUTHORS Correspondence to Beng Ti Ang or Carol Tang. ETHICS DECLARATIONS COMPETING INTERESTS The authors declare no competing interests. ADDITIONAL INFORMATION PEER REVIEW INFORMATION:
_Nature Communications_ thanks Jann Sarkaria and other anonymous reviewer(s) for their contribution to the peer review of this work. Peer reviewer reports are available. PUBLISHER’S NOTE:
Springer Nature remains neutral with regard to jurisdictional claims in published maps and institutional affiliations. SUPPLEMENTARY INFORMATION SUPPLEMENTARY INFORMATION PEER REVIEW FILE
DESCRIPTION OF ADDITIONAL SUPPLEMENTARY FILES SUPPLEMENTARY DATA 1 SUPPLEMENTARY DATA 2 SUPPLEMENTARY DATA 3 SOURCE DATA RIGHTS AND PERMISSIONS OPEN ACCESS This article is licensed under a
Creative Commons Attribution 4.0 International License, which permits use, sharing, adaptation, distribution and reproduction in any medium or format, as long as you give appropriate credit
to the original author(s) and the source, provide a link to the Creative Commons license, and indicate if changes were made. The images or other third party material in this article are
included in the article’s Creative Commons license, unless indicated otherwise in a credit line to the material. If material is not included in the article’s Creative Commons license and
your intended use is not permitted by statutory regulation or exceeds the permitted use, you will need to obtain permission directly from the copyright holder. To view a copy of this
license, visit http://creativecommons.org/licenses/by/4.0/. Reprints and permissions ABOUT THIS ARTICLE CITE THIS ARTICLE Tan, M.S.Y., Sandanaraj, E., Chong, Y.K. _et al._ A STAT3-based gene
signature stratifies glioma patients for targeted therapy. _Nat Commun_ 10, 3601 (2019). https://doi.org/10.1038/s41467-019-11614-x Download citation * Received: 12 December 2018 *
Accepted: 25 July 2019 * Published: 09 August 2019 * DOI: https://doi.org/10.1038/s41467-019-11614-x SHARE THIS ARTICLE Anyone you share the following link with will be able to read this
content: Get shareable link Sorry, a shareable link is not currently available for this article. Copy to clipboard Provided by the Springer Nature SharedIt content-sharing initiative