- Select a language for the TTS:
- UK English Female
- UK English Male
- US English Female
- US English Male
- Australian Female
- Australian Male
- Language selected: (auto detect) - EN
Play all audios:
ABSTRACT With increasing availability of genetic tests, it is important to consider differences in testing patterns between population subgroups. We examined self-reported genetic testing
among 45,061 participants of the Australian population-based 45 and Up Study, testing for associations with sociodemographic and health characteristics (multivariable logistic regression).
9.2% of participants reported ever having genetic testing; 3.9% reported disease-related testing, 5.2% non-disease-related testing, 0.7% both disease-related and non-disease-related testing.
Disease-related genetic testing was strongly associated with younger age, female sex, history of cancers and cardiovascular disease, and cancer family history. Disease-related testing was
also strongly associated with higher education (university _versus_ school certificate: adjusted OR [aOR] = 1.50 [95%CI:1.29–1.75]; certificate/diploma _versus_ school certificate: aOR =
1.40 [95%CI:1.20–1.63]); there was suggestive evidence for association with higher household income ($AUD90,000+ _versus_ <$AUD30,000: aOR = 1.22 [95%CI:1.02–1.46]), which strengthened
when not adjusting for education (aOR = 1.34 [95%CI:1.13–1.60]). These results suggest further work on ensuring equitable access is needed to prevent potential health inequities. SIMILAR
CONTENT BEING VIEWED BY OTHERS DIRECT TO CONSUMER GENETIC TESTING IN DENMARK—PUBLIC KNOWLEDGE, USE, AND ATTITUDES Article 01 March 2021 A STATE-BASED APPROACH TO GENOMICS FOR RARE DISEASE
AND POPULATION SCREENING Article 27 November 2020 POLYGENIC RISK SCORES IN THE CLINIC: A SYSTEMATIC REVIEW OF STAKEHOLDERS’ PERSPECTIVES, ATTITUDES, AND EXPERIENCES Article 23 November 2024
INTRODUCTION Genetic and genomic testing (in the following, “genetic testing” for brevity) has considerable promise for precision health, with tests increasingly available for disease risk
prediction, diagnosis, and treatment [1, 2], especially in cancer [3, 4]. Australia has universal healthcare (‘Medicare’), supplemented by private health insurance; however, re-imbursement
for genetic testing is limited, with many tests covered by State/Territory Governments, private healthcare providers, and/or individuals [5]. Notably, disease-related direct-to-consumer
(DTC) tests are increasingly available without a specialist referral, alongside non-disease-related DTC tests that can increase familiarity with genetics and uptake of future testing. To
determine how genomics could support effective, efficient, and equitable healthcare, it is thus important to understand current patterns of genetic testing. Australian studies from 2016 to
2017 [6, 7] reported that health literacy and socioeconomic advantage were associated with increased access to genetic tests (Supplementary Information p19). Since then, availability of
genetic testing has increased substantially [8]. Here, we draw on more recent and larger-scale population-based data to investigate self-reported genetic testing (any, disease-related, and
non-disease-related) and examine associations with sociodemographic and health characteristics (cancer and non-cancer conditions) in Australia. MATERIALS AND METHODS 45 AND UP STUDY The Sax
Institute’s 45 and Up Study is a population-based cohort in New South Wales (NSW), Australia, with 267,357 participants aged 45+ years recruited in 2005–2009 [9, 10]. Briefly, potential
participants were randomly sampled from the Services Australia Medicare enrolment database (1,395,174 invitations sent, ~19% participation rate). People aged 80+ years and rural/remote
residents were oversampled. In 2020, questionnaires were sent to approximately one-third of the cohort (85,299 participants) as part of regular follow-up (52.8% response rate, details see
Supplementary Information p3, Supplemental Fig. 1). GENETIC TESTING The 2020 follow-up questionnaire (paper-based or online) asked whether participants ever had any genetic testing (Yes; No;
Don’t know/don’t want to say), and if so, what the genetic testing aimed to determine (multiple-choice question, see Supplementary Information p7). The questions were deliberately broad to
avoid disclosure of testing with life insurance implications, without separating clinical and non-clinical settings. For subsequent analyses, we considered three genetic testing categories:
“any testing” (ever had any genetic testing); “disease-related testing” (disease risk, diagnosis, or treatment); and “non-disease-related testing only” (genetic ancestry and/or
diet-/fitness-related tests, but not tests related to disease risk, diagnosis or treatment). PARTICIPANTS’ CHARACTERISTICS Participants’ sociodemographic and health characteristics were
obtained from the 2020 or baseline questionnaire, including age, sex, education, household income, health insurance status, area-based socioeconomic status [11], accessibility/remoteness of
place of residence [12], personal and family history of different diseases, and ever having children (details see Table 1, Supplementary Information p4). For the health characteristic of
personal cancer history, participants’ invasive cancer diagnoses were ascertained from probabilistic linkage [13] to NSW Cancer Registry data (1994–2019; Table 1, Supplemental Table 1;
registry data held by Cancer Institute NSW, linkage by the Centre for Health Record Linkage, http://www.cherel.org.au/). STATISTICAL ANALYSES We reported the number and proportion of
respondents for each genetic testing category, with exploratory analysis applying re-weighting for selected sociodemographic characteristics to Australian Census data (people aged 55+
years). Multivariable logistic regression was used to test for associations between participants’ characteristics and genetic testing, separately for each of the three genetic testing
categories (any, disease-related, or non-disease-related only). We calculated odds ratios (aOR) simultaneously adjusted for all characteristics shown in Table 1, and 95% confidence intervals
(95%CI). To account for multiple testing (≤50 non-reference categories per analysis), we defined significance at _p_ < 0.001 (Bonferroni-adjusted threshold). To indicate potential
avenues for further work, we also reported associations at _p_ < 0.05 as “suggestive evidence”. Due to strong associations between genetic testing and both personal and family history of
cancers, we further tested for associations specifically among participants with a previous invasive cancer diagnosis. We performed several sensitivity analyses for the association tests:
(1) for any genetic testing, excluding participants with “don’t know/don’t want to say” and missing responses (grouped with responses of no genetic testing in main analysis); (2) without
adjustment for education, to examine associations between genetic testing and different socioeconomic status (SES) characteristics (due to correlation between education and SES); (3)
excluding participants with personal or family history of cancer (to check for sex-specific cancers driving association between genetic testing and sex); (4) applying re-weighting to
Australian Census data (exploratory only); and (5) stratified by sex. Analyses used SAS v9.4 or R v4.3.1. RESULTS 45,061 participants who completed the 2020 follow-up questionnaire could be
included in the analysis (age at follow-up 56+ years, Table 1, Supplemental Fig. 1). Among all participants, 9.2% (95%CI:8.9–9.4%) reported ever having any genetic testing, 3.9% (3.7–4.1%)
disease-related testing, 5.2% (5.0–5.4%) non-disease-related testing, and 0.7% (0.6–0.8%) both disease-related and non-disease-related testing (Supplemental Tables 2–3). Estimates were
similar when re-weighting data to match the distribution of selected key characteristics to national or NSW data (absolute difference <0.6%, e.g. any genetic testing: 8.6–9.3%,
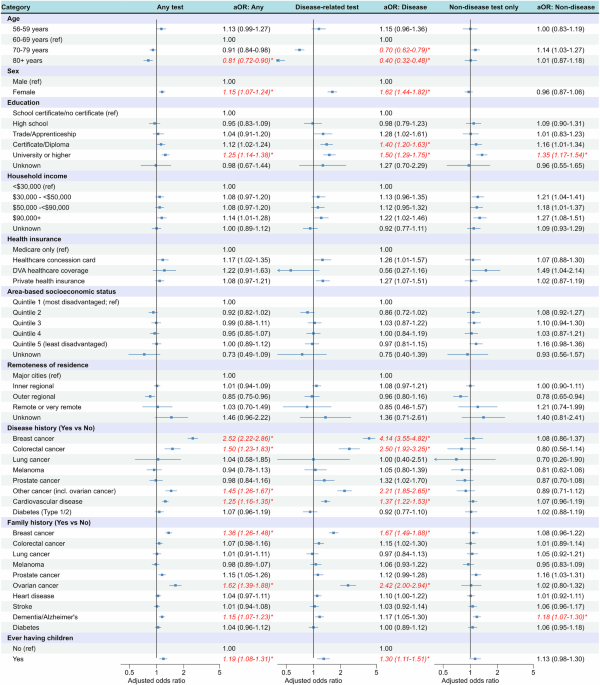
Supplemental Table 4). ASSOCIATIONS BETWEEN GENETIC TESTING AND PARTICIPANTS’ CHARACTERISTICS Ever having genetic testing was associated with age (80+ years: aOR = 0.81 versus 60–69 years)
and female sex (aOR = 1.15 versus male; Fig. 1). There was a significant association with university education (aOR = 1.25 versus school certificate) and suggestive evidence (_p_ < 0.05)
for $AUD90,000+ household income (aOR = 1.14 versus <$AUD30,000), but no evidence for association with area-based SES or remoteness of residence. Significant associations were also
observed with personal history of breast cancer, colorectal cancer and cardiovascular disease, family history of breast cancer, ovarian cancer and dementia/Alzheimer’s, and ever having
children. Disease-related testing showed similar association patterns, including stronger associations with age (70–79 years: aOR = 0.70; 80+ years: aOR = 0.40) and female sex (aOR = 1.62).
Notably, we found stronger associations for several SES characteristics: significant associations for both certificate/diploma (aOR = 1.40) and university education (aOR = 1.50), suggestive
evidence (_p_ < 0.05) and a higher estimate for $AUD90,000+ household income (aOR = 1.22), and suggestive evidence for private health insurance (aOR = 1.27). Reporting non-disease-related
testing only was significantly associated with university education (aOR = 1.35) and family history of dementia/Alzheimer’s (aOR = 1.18; Fig. 1). Results of analyses restricted to
participants with a personal cancer history were similar to the main analysis (Supplementary Information p12). Disease-related testing was also significantly associated with younger age at
diagnosis, more recent diagnosis periods, and metastatic/unknown spread of cancer at diagnosis (Supplemental Fig. 2). SENSITIVITY ANALYSES Excluding participants with “don’t know/don’t want
to say” and missing responses to any genetic testing (5% of all _n_ = 45,061) from the regression analysis had very little impact on the results. Without adjustment for education,
associations with higher household income increased (relative increase in aOR up to ~10%) and were statistically significant for $AUD90,000+ income (Supplementary Fig. 3). Associations with
other characteristics did not change substantially. There was a similar pattern in this analysis restricted to participants with cancer, with aORs for disease-related testing and $AUD90,000+
household income increasing, though not statistically significant (Supplementary Fig. 4). When the main association analyses were restricted to participants without any personal nor family
history of cancer, the association between disease-related testing and sex was slightly attenuated (aOR = 1.47) but remained significant (Supplementary Fig. 5), suggesting testing related to
sex-specific cancers is not the only contributing factor for this association between genetic testing and sex. When re-weighting study data to the Australian population, association results
were generally similar to the main analysis (Supplemental Table 5; Supplementary Information p17). Results from sex-stratified analyses were also largely similar, with most notable
differences of stronger association between genetic testing (disease-related and non-disease-related) and university education among males than females, and family history of breast cancer
associated with genetic testing (any and disease-related) among females only (Supplementary Table 6; Supplementary Information p18). DISCUSSION In this large-scale analysis of self-reported
genetic testing among >45,000 Australians (age 56+ years) from a population-based cohort, 9.2% of participants reported ever having any genetic testing, among whom 42.4% reported
disease-related testing and 56.3% non-disease-related testing, with 7.9% reporting both (see Supplementary information p20 for additional discussion). Re-weighted estimates to match the
general population age 55+ were similar to the main estimates. Self-reported genetic testing in our study was substantially lower than the 21.6% reported in a cross-sectional 2020 US survey
[14], with the USA currently representing the largest genetic testing market. Our estimate was also lower than the 22.4% reported in the Australian Genioz study [7], which might be related
to different participant demographics (56+ versus 18+ years; 56% versus 72% females) and/or recruitment (established cohort versus mix of strategies including social media; notably, 59% of
Genioz study participants were undertaking/had university education, and 15% were working in life science/genomics, which likely contributed to the high prevalence of genetic testing).
Consistent with previous studies [6, 7, 14], we found strong associations between genetic testing and younger age and female sex (not explained by sex-specific cancers alone, with potential
contributions of different health awareness and attitudes toward preventative care [15]). We also found very strong associations between genetic testing and education. While previous
Australian studies [6, 7] generally focused on university education only, we found a gradient across education levels. Compared to attaining at most a school certificate, odds ratio
estimates for disease-related genetic testing were highest for university education, followed by certificate/diploma (both _p_ < 0.001), then trade/apprenticeship qualifications (_p_ <
0.05). Notably, we found evidence for stronger association between disease-related genetic testing and university education among males than females, which could be of interest for future
investigation. Generally, associations with education could be related to increased health literacy and/or higher income facilitating out-of-pocket expenses for non-reimbursed tests (latter
also supported by the increased and significant association with the highest household income when not adjusting for education). Out-of-pocket expenses for genetic testing are also highly
relevant for DTC tests, with potential for health inequities discussed further in Supplementary Information p21. The strong associations between genetic testing and personal and family
history of several cancers were consistent with expectations based on current Australian genetic testing guidelines [16, 17] and increased use of genetic testing for targeted treatment [18]
(germline and somatic tests were not separated in the self-report). We found a significant association between CVD and genetic testing, consistent with increasing availability of genetic
tests for e.g., inherited cardiomyopathy and inherited hypercholesterolemia [19]. As a study limitation, the cohort was not representative of the general population (e.g., due to older age,
higher education and socioeconomic advantage); nonetheless, previous work suggests within-cohort associations are expected to mirror population relationships [20]. Self-reported genetic
testing is subject to recall bias, which could differ by age and/or education. We could not distinguish whether genetic testing occurred through health professionals. Notable strengths of
this study include the very large sample, inclusion of a very broad range of participants’ characteristics, data linkage to cancer registry, and rigorous statistical analysis. In conclusion,
our results provide insights on genetic testing patterns in Australia as an example of a high-income country, and re-enforce the need for further work to ensure equitable access to current
and future genomic technologies, covering both educational and financial considerations in depth. DATA AVAILABILITY This study uses third-party data not owned or collected by the authors,
with on-provision by authors not permitted by the relevant data custodians (Sax Institute, Cancer Institute NSW), as it would compromise the participants’ confidentiality and privacy.
However, the data are available from the data custodians for approved research projects - data access enquiries can be made to the Sax Institute (see
https://www.saxinstitute.org.au/our-work/45-upstudy/governance/ for details). Other researchers would be able to access these data using the same process followed by the authors. REFERENCES
* Cancer Institute NSW. eviQ: Genetic testing for heritable pathogenic variants 2023 [Available from:
https://www.eviq.org.au/cancer-genetics/adult/genetic-testing-for-heritable-pathogenic-variants. * Cooper-DeHoff RM, Niemi M, Ramsey LB, Luzum JA, Tarkiainen EK, Straka RJ, et al. The
Clinical Pharmacogenetics Implementation Consortium Guideline for SLCO1B1, ABCG2, and CYP2C9 genotypes and Statin-Associated Musculoskeletal Symptoms. Clin Pharmacol Ther. 2022;111:1007–21.
Article CAS PubMed Google Scholar * Lemery S, Keegan P, Pazdur R. First FDA approval agnostic of cancer site - when a biomarker defines the indication. N Engl J Med. 2017;377:1409–12.
Article PubMed Google Scholar * Tattersall A, Ryan N, Wiggans AJ, Rogozińska E, Morrison J. Poly(ADP-ribose) polymerase (PARP) inhibitors for the treatment of ovarian cancer. Cochrane
Database Syst Rev. 2022;2:Cd007929. PubMed Google Scholar * Burns BL, Bilkey GA, Coles EP, Bowman FL, Beilby JP, Pachter NS, et al. Healthcare system priorities for successful integration
of genomics: an Australian focus. Front Public Health. 2019;7:41. Article PubMed PubMed Central Google Scholar * Metcalfe SA, Hickerton C, Savard J, Stackpoole E, Tytherleigh R, Tutty E,
et al. Australians’ perspectives on support around use of personal genomic testing: findings from the Genioz study. Eur J Med Genet. 2019;62:290–9. Article PubMed Google Scholar * Savard
J, Hickerton C, Tytherleigh R, Terrill B, Turbitt E, Newson AJ, et al. Australians’ views and experience of personal genomic testing: survey findings from the Genioz study. Eur J Hum Genet:
EJHG. 2019;27:711–20. Article PubMed PubMed Central Google Scholar * MIT Technology Review. More than 26 million people have taken an at-home ancestry test 2019 [Available from:
https://www.technologyreview.com/2019/02/11/103446/more-than-26-million-people-have-taken-an-at-home-ancestry-test/. * Banks E, Redman S, Jorm L, Armstrong B, Bauman A, Beard J, et al.
Cohort profile: the 45 and up study. Int J Epidemiol. 2008;37:941–7. Article PubMed Google Scholar * Bleicher K, Summerhayes R, Baynes S, Swarbrick M, Navin Cristina T, Luc H, et al.
Cohort Profile Update: the 45 and Up Study. Int J Epidemiol. 2023;52:e92–e101. Article PubMed Google Scholar * Australian Bureau of Statistics. Socio-Economic Indexes for Area (SEIFA),
Australia. 2023 [Available from: https://www.abs.gov.au/statistics/people/people-and-communities/socio-economic-indexes-areas-seifa-australia/latest-release]. * Australian Bureau of
Statistics. Remoteness Areas. 2023 [Available from:
https://www.abs.gov.au/statistics/standards/australian-statistical-geography-standard-asgs-edition-3/jul2021-jun2026/remoteness-structure/remoteness-areas]. * Bentley JP, Ford JB, Taylor LK,
Irvine KA, Roberts CL. Investigating linkage rates among probabilistically linked birth and hospitalization records. BMC Med Res Methodol. 2012;12:149. Article PubMed PubMed Central
Google Scholar * Swoboda CM, Wijayabahu AT, Fareed N. Attitudes towards and sociodemographic determinants of genetic test usage in the USA; data from the Health Information National Trend
Survey, 2020. J Genet Counseling. 2023;32:57–67. Article Google Scholar * Deeks A, Lombard C, Michelmore J, Teede H. The effects of gender and age on health related behaviors. BMC Public
Health. 2009;9:213. Article PubMed PubMed Central Google Scholar * Department of Health and Aged Care. July 2023 Medicare Benefits Schedule (MBS): Medicare Benefits Schedule - Item 73296
2023; [Available from: https://www9.health.gov.au/mbs/fullDisplay.cfm?type=item&q=73296&qt=item. * Department of Health and Aged Care. July 2023 Medicare Benefits Schedule (MBS):
Medicare Benefits Schedule - Item 73354 2023 [Available from: https://www9.health.gov.au/mbs/fullDisplay.cfm?type=item&q=73354&qt=item&criteria=mismatch%20repair. * Harbeck N,
Gnant M. Breast cancer. Lancet. 2017;389:1134–50. Article PubMed Google Scholar * Gray MP, Fatkin D, Ingles J, Robertson EN, Figtree GA. Genetic testing in cardiovascular disease. Med J
Aust. 2024;220:428–34. Article PubMed Google Scholar * Mealing NM, Banks E, Jorm LR, Steel DG, Clements MS, Rogers KD. Investigation of relative risk estimates from studies of the same
population with contrasting response rates and designs. BMC Med Res Methodol. 2010;10:26. Article PubMed PubMed Central Google Scholar Download references ACKNOWLEDGEMENTS This research
was completed using data collected through the 45 and Up Study (www.saxinstitute.org.au). The 45 and Up Study is managed by the Sax Institute in collaboration with major partner Cancer
Council NSW and partners the Heart Foundation and the NSW Ministry of Health. We thank the many thousands of people participating in the 45 and Up Study and the Centre for Health Record
Linkage (CHeReL) for the record linkage. The NSW Cancer Registry data is provided by the Cancer Institute NSW. Secure data access was provided through the Sax Institute’s Secure Unified
Research Environment (SURE). The questions on genetic testing in the Sax Institute’s 45 and Up Study survey in Australia were sponsored by Cancer Council NSW. Population-based
sociodemographic characteristics were obtained from the Australian Bureau of Statistics 2021 Census data. FUNDING JS is the recipient of a Cancer Institute NSW Career Development Fellowship
(2022/CDF1154). KC receives salary support from the National Health and Medical Research Council (#APP1194679). AEC is funded by a National Health and Medical Research Council Investigator
Fellowship (#2008454). AKS is supported by a National Health and Medical Research Council Synergy grant (#2009923) and Medical Research Future Fund grant (#MRFF 2024995). KLAD is supported
by a National Health and Medical Research Council Investigator grant to AEC (#2008454) and a Medical Research Future Fund grant (#MRFF2024995). HMT is supported by a Medical Research Future
Fund grant (#MRF2007708). YJK and PN are supported by a Medical Research Future Fund grant (#MRFF 1200535). MAM is supported by a Department of Defense Ovarian Cancer Research Program,
Ovarian Cancer Academy Early Career Investigator Award (W81XWH-21-1-0914). Open Access funding enabled and organized by CAUL and its Member Institutions. AUTHOR INFORMATION Author notes *
These authors contributed equally: David E. Goldsbury, Yoon-Jung Kang. AUTHORS AND AFFILIATIONS * The Daffodil Centre, The University of Sydney, a joint venture with Cancer Council NSW,
Sydney, NSW, Australia David E. Goldsbury, Yoon-Jung Kang, Hamzeh M. Tanha, Amelia K. Smit, Kate L. A. Dunlop, Lara Petelin, Preston Ngo, Harriet Hui, Nicola S. Meagher, Melissa A. Merritt,
Marianne Weber, Anna DeFazio, Anne E. Cust & Julia Steinberg * The University of Sydney, Sydney, NSW, Australia Catherine Tang * Melbourne School of Population & Global Health,
University of Melbourne, Melbourne, VIC, Australia Lara Petelin * Department of Gynaecological Oncology, Westmead Hospital, Sydney, NSW, Australia Anna DeFazio * The Westmead Institute for
Medical Research, Sydney, NSW, Australia Anna DeFazio * School of Public Health, The University of Sydney, Sydney, NSW, Australia Karen Canfell Authors * David E. Goldsbury View author
publications You can also search for this author inPubMed Google Scholar * Yoon-Jung Kang View author publications You can also search for this author inPubMed Google Scholar * Catherine
Tang View author publications You can also search for this author inPubMed Google Scholar * Hamzeh M. Tanha View author publications You can also search for this author inPubMed Google
Scholar * Amelia K. Smit View author publications You can also search for this author inPubMed Google Scholar * Kate L. A. Dunlop View author publications You can also search for this author
inPubMed Google Scholar * Lara Petelin View author publications You can also search for this author inPubMed Google Scholar * Preston Ngo View author publications You can also search for
this author inPubMed Google Scholar * Harriet Hui View author publications You can also search for this author inPubMed Google Scholar * Nicola S. Meagher View author publications You can
also search for this author inPubMed Google Scholar * Melissa A. Merritt View author publications You can also search for this author inPubMed Google Scholar * Marianne Weber View author
publications You can also search for this author inPubMed Google Scholar * Anna DeFazio View author publications You can also search for this author inPubMed Google Scholar * Anne E. Cust
View author publications You can also search for this author inPubMed Google Scholar * Karen Canfell View author publications You can also search for this author inPubMed Google Scholar *
Julia Steinberg View author publications You can also search for this author inPubMed Google Scholar CONTRIBUTIONS JS led study conception, with contributions from MW and KC. JS and DG
designed the study, with other authors reviewing and commenting on the analysis plan. CT led a scan of other relevant literature, in collaboration with JS, YJK, and HMT. DG performed
statistical analysis. DG, YJK, CT, and JS drafted the manuscript. All authors contributed to interpretation of the results and critical review of the manuscript, approving the final version
for publication. CORRESPONDING AUTHOR Correspondence to Julia Steinberg. ETHICS DECLARATIONS COMPETING INTERESTS Professor Karen Canfell is co-principal investigator of an
investigator-initiated trial of cervical screening, Compass, run by the Australian Centre for Prevention of Cervical Cancer (ACPCC), which is a government-funded not-for-profit charity; the
ACPCC has received equipment and a funding contribution from Roche Molecular Diagnostics, and operational support from the Australian Government. KC is also co- principal investigator on a
major investigator-initiated implementation programme Elimination Partnership in Cervical Cancer (EPICC) which receives support from the Australian government and Minderoo Foundation and
equipment donations from Cepheid. Anna DeFazio has received research support from AstraZeneca and Illumina. David E Goldsbury, Yoon-Jung Kang, Catherine Tang, Hamzeh M Tanha, Amelia K Smit,
Kate L A Dunlop, Lara Petelin, Preston Ngo, Harriet Hui, Nicola S Meagher, Melissa A Merritt, Marianne Weber, Anne E Cust and Julia Steinberg declare that they have no conflict of interest.
ETHICAL APPROVAL The conduct of the Sax Institute’s 45 and Up Study was approved by the University of New South Wales Human Research Ethics Committee. The NSW Population Health and Health
Services Research Ethics Committee approved the work described here (HREC/14/CIPHS/54). ADDITIONAL INFORMATION PUBLISHER’S NOTE Springer Nature remains neutral with regard to jurisdictional
claims in published maps and institutional affiliations. SUPPLEMENTARY INFORMATION APPENDIX A APPENDIX B APPENDIX C RIGHTS AND PERMISSIONS OPEN ACCESS This article is licensed under a
Creative Commons Attribution 4.0 International License, which permits use, sharing, adaptation, distribution and reproduction in any medium or format, as long as you give appropriate credit
to the original author(s) and the source, provide a link to the Creative Commons licence, and indicate if changes were made. The images or other third party material in this article are
included in the article’s Creative Commons licence, unless indicated otherwise in a credit line to the material. If material is not included in the article’s Creative Commons licence and
your intended use is not permitted by statutory regulation or exceeds the permitted use, you will need to obtain permission directly from the copyright holder. To view a copy of this
licence, visit http://creativecommons.org/licenses/by/4.0/. Reprints and permissions ABOUT THIS ARTICLE CITE THIS ARTICLE Goldsbury, D.E., Kang, YJ., Tang, C. _et al._ Sociodemographic and
health factors associated with genetic testing in Australia: insights from a cohort-based study of 45,061 participants. _Eur J Hum Genet_ (2025). https://doi.org/10.1038/s41431-025-01816-x
Download citation * Received: 27 June 2024 * Revised: 05 February 2025 * Accepted: 11 February 2025 * Published: 27 February 2025 * DOI: https://doi.org/10.1038/s41431-025-01816-x SHARE THIS
ARTICLE Anyone you share the following link with will be able to read this content: Get shareable link Sorry, a shareable link is not currently available for this article. Copy to clipboard
Provided by the Springer Nature SharedIt content-sharing initiative