- Select a language for the TTS:
- UK English Female
- UK English Male
- US English Female
- US English Male
- Australian Female
- Australian Male
- Language selected: (auto detect) - EN
Play all audios:
Previous studies indicated existing, albeit limited, genetic-geographic population substructure in the Dutch population based on genome-wide data and a lack of this for mitochondrial SNP
based data. Despite the aforementioned studies, Y-chromosomal SNP data from the Netherlands remain scarce and do not cover the territory of the Netherlands well enough to allow a reliable
investigation of genetic-geographic population substructure. Here we provide the first substantial dataset of detailed spatial Y-chromosomal haplogroup information in 2085 males collected
across the Netherlands and supplemented with previously published data from northern Belgium. We found Y-chromosomal evidence for genetic–geographic population substructure, and several
Y-haplogroups demonstrating significant clinal frequency distributions in different directions. By means of prediction surface maps we could visualize (complex) distribution patterns of
individual Y-haplogroups in detail. These results highlight the value of a micro-geographic approach and are of great use for forensic and epidemiological investigations and our
understanding of the Dutch population history. Moreover, the previously noted absence of genetic-geographic population substructure in the Netherlands based on mitochondrial DNA in contrast
to our Y-chromosome results, hints at different population histories for women and men in the Netherlands.
An extensive database of genetic variation and detailed insight in genetic-geographic population substructure is essential for forensic investigation, epidemiology and historical,
archaeological, evolutionary and genealogy studies within a nation (see for example [1]). For the Netherlands there are several databases available on autosomal data from which inferences
have been made about Dutch population (sub)structure. The study by Lao et al. [2] on genome-wide autosomal single nucleotide polymorphism (SNP) data demonstrated genetic-geographic
population substructure and a clinal distribution of genomic diversity in southeast to northwest direction across the current territory of the Netherlands. They concluded that these patterns
must have a relatively recent origin, considering multiple recent events that could have influenced the Dutch population structure, such as large-scale land reclamation projects starting in
the High Middle Ages. Furthermore, Abdellaoui et al. [3], using an independent genome-wide dataset, observed population differentiation along both a north–south and a west-east direction
and identified a higher rate of homozygosity in the north compared with the south, which was explained by a serial founder effect as a result of historical northward migrations. Similarly,
also the study of The Genome of the Netherlands Consortium [4] on whole-genome sequencing data observed subtle genetic-geographic substructure along a north–south gradient and also increased
homozygosity in the north, for which they proposed the same explanation as Abdellaoui et al. [3]. In contrast to the autosomal genome-wide data, a study on mitochondrial DNA on a subset of
the above mentioned dataset studied by Lao et al. [2], could not detect significant genetic-geographic substructure in the Netherlands [5].
Considering the non-recombining part of the Y-chromosome, Roewer et al. described a significant division between the north and the south of the Netherlands, based on Y-chromosomal short
tandem repeat (YSTR) haplotypes from 275 samples from five different locations, but this division was not detectable based on SNP data [6]. Moreover, studies on SNP based Y-chromosome
haplogroup (YHG) frequencies in the southern Netherlands and Belgium showed a significant difference between the Dutch and the Belgian samples based on haplogroup proportions and gradients
for YHGs R1b-M405, R1b-L48, and R1b-M529 [7,8,9].
Despite the aforementioned studies, YHG data from the Netherlands remain scarce and do not cover the territory of the Netherlands well enough to allow a reliable investigation of
genetic-geographic population substructure. Such a Dutch YHG database would be a valuable addition to the already available autosomal and mitochondrial DNA information for various reasons.
First of all, in contrast to the autosomes the Y-chromosome is uniparental. This means its genetic variation is influenced by, but also indicative of, male-specific demographic processes and
is therefore very useful in reconstructing population histories. Also, in the forensic world genome wide data analysis is still scarcely applied (and standardized) and therefore uniparental
markers remain essential for inferring bio-geographic ancestry of suspects or unidentified victims. Therefore, regional knowledge on genetic-geographic substructure of the Y-chromosome is
of great value.
The phylogenetic resolution of the current YHG tree is now sufficiently high [10] to be able to detect geographic patterns on a micro-regional scale [7]. In this context, the Netherlands can
be considered a micro-region, covering only 33,687 km2 of land [11], although it is densely populated with about 17 million inhabitants [12]. The goal of this study is to develop a database
with Dutch YHG information and identify and quantify the possible presence of geographic patterns and population substructure based on this data within the Netherlands. For some of our
analyses, we also included data from the northern part of Belgium, including Flanders and the Brussels-Capital region. This part of Belgium borders the south of the Netherlands and Dutch is
(one of) the official language(s) there. This area covers 13,684 km2 of land [13, 14] and has about 7.5 million inhabitants [15].
For our study, we used 2085 blood-donor samples from male donors that are reported to be unrelated and residing in a-priori selected locations. This is the same dataset as published in
Westen et al. for autosomal STR data [16] and Westen et al. for YSTR data [17]. Samples were received anonymously, with only the place of residency of the donor indicated (see also
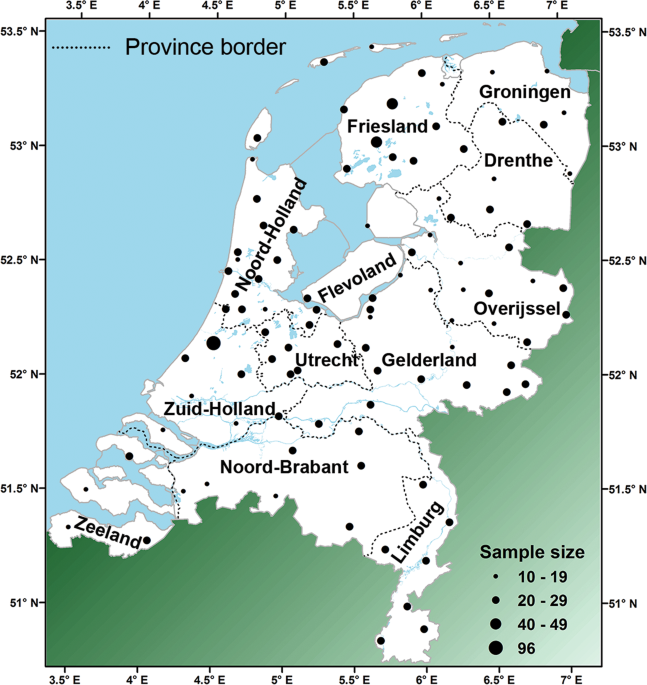
Supplementary information). The number of samples per location varied from 1 to 96. Locations with less than ten samples were pooled with nearby locations. This resulted in sample sizes
varying between 10 and 96 (average = 21) from 99 locations covering the Dutch area in a grid-like scheme (Fig. 1 and Table S1). This dataset will from here on be referred to as the “Dutch
dataset”.
Map of the Netherlands with sample locations and province names
Because of the sampling strategy, excluding several of the major cities that harbor large recent (since 1950) immigrant populations [18], this dataset is to some extend biased in
representing the full genetic diversity among the Dutch male population. DNA was isolated as described in Westen et al. [16]. A SNaPshot® Multiplex System Kit (Applied Biosystems, Foster
City, CA, USA) assay was designed for a core set of 26 SNPs covering all the main YHGs (A-T) and four subgroups of YHG R (Fig. 2). Further subtyping of samples assigned to YHGs E and R1b was
done in additional multiplexes and for YHGs F(xG, H, I/ J, and K), J, and Q in monoplex (Fig. 2). In total, 92 Y-SNPs were analyzed allowing the inference of 88 YHGs. Subgroups of YHG
I-M170 were inferred with Whit Athey’s Haplogroup Predictor [19, 20], based on 16 YSTRs that were previously published for our dataset [17]. Because sub-haplogroups of I-M170 were inferred
from YSTR data, they were not considered for further analysis, other than proportion estimates, due to potential inference inaccuracies. For detailed information on SNP design, sequencing,
and haplogroup prediction see Supplementary information.
Typed SNPs in phylogenetic trees, grouped in the core set and the E-M96, E1b-M2, and R1b-M415 multiplex assays. Monoplexes are marked gray. SNP P143 in the core set multiplex was not typed
but recommended instead of M168
To increase the study area and enhance the possibility to detect geographic patterns, a dataset of 773 males from the northern Belgian provinces West-Vlaanderen, Oost-Vlaanderen, Antwerpen,
Vlaams-Brabant, the Brussels region, and Limburg, using the actual living place at the time of sample collection (the “present” dataset), as previously described by Larmuseau et al. [7], was
incorporated in this study for part of the statistical analyses. This dataset will be referred to as the “Flanders dataset” and the dataset consisting of both the Dutch and the Flanders
dataset will be referred to as the “combined dataset”. Because there were some differences between the SNP assays applied to the Dutch and Flanders datasets, YHGs were synchronized to a
level that they were comparable for data analysis (consensus YHGs, Table S2).
The samples from the Flanders dataset were collected with a different sampling strategy than the Dutch dataset and mostly single samples are available per location. Therefore, several
methods for detecting population substructure and gradients were not applicable to the Flanders dataset.
We used two different approaches in order to search for genetic-geographic patterns in the Dutch dataset. First, classical multidimensional scaling (MDS) analysis was performed with R
software version 3.4.4 [21] to represent in two dimensions a distance matrix based on Slatkin’s linearized FST on YHG proportions among sampling locations. This matrix was computed with
ARLEQUIN software version 3.11 with standard settings [22]. The resemblance of the first two MDS dimensions with the geographic sampling locations was quantified by means of a symmetric
Procrustes rotation, as implemented in the protest method of the “vegan” R package [23]. Second, a correspondence analysis on YHG proportions and sample locations was performed in R with the
“ca” package. Outliers, if any, in the first two dimensions were removed on visual inspection. The first two dimensions were compared with the geographic coordinates of the sampling
locations with a symmetric Procrustes rotation. Both methods were only applied to the Dutch dataset.
The above mentioned previous study by Lao et al. [2] on genome-wide autosomal SNP data was based on a subset of the Dutch dataset as published here. This study found evidence for
genetic-geographic substructure in the Dutch population. To test for similarities between genetic-geographic substructure based on the genome-wide autosomal SNP data and YHG data we
estimated the similarity between the Slatkin’s linearized FST genetic distance matrices between populations while controlling by geographic distance, by conducting a partial Mantel test with
PASSaGE version 2 software [24]. Since the dataset of Lao et al. [2] is a subset of the Dutch dataset (917 samples from 46 locations), we applied the same selection on the YHG dataset
(applying all selection criteria as described in Lao et al. [2] and additionally excluding all locations with less than ten samples).
To detect geographic patterns for individual YHGs, we applied two statistical methods on (sub)YHGs with a proportion of ≥1% (corresponding to a minimum of 20 samples in the Dutch dataset).
First, we computed Moran’s I spatial autocorrelograms with binary weight tests for each YHG using PASSaGE version 2 software, with ten distance classes of equal width, assuming randomly
distributed data and excluding the largest distance class. Statistical significance (p-value

