- Select a language for the TTS:
- UK English Female
- UK English Male
- US English Female
- US English Male
- Australian Female
- Australian Male
- Language selected: (auto detect) - EN
Play all audios:
ABSTRACT The stromal compartment of the tumor microenvironment consists of a heterogeneous set of tissue-resident and tumor-infiltrating cells, which are profoundly moulded by cancer cells.
An outstanding question is to what extent this heterogeneity is similar between cancers affecting different organs. Here, we profile 233,591 single cells from patients with lung, colorectal,
ovary and breast cancer (_n_ = 36) and construct a pan-cancer blueprint of stromal cell heterogeneity using different single-cell RNA and protein-based technologies. We identify 68 stromal
cell populations, of which 46 are shared between cancer types and 22 are unique. We also characterise each population phenotypically by highlighting its marker genes, transcription factors,
metabolic activities and tissue-specific expression differences. Resident cell types are characterised by substantial tissue specificity, while tumor-infiltrating cell types are largely
shared across cancer types. Finally, by applying the blueprint to melanoma tumors treated with checkpoint immunotherapy and identifying a naïve CD4+ T-cell phenotype predictive of response
to checkpoint immunotherapy, we illustrate how it can serve as a guide to interpret scRNA-seq data. In conclusion, by providing a comprehensive blueprint through an interactive web server,
we generate the first panoramic view on the shared complexity of stromal cells in different cancers. You have full access to this article via your institution. Download PDF SIMILAR CONTENT
BEING VIEWED BY OTHERS INTEGRATED SINGLE-CELL TRANSCRIPTOME ANALYSIS REVEALS HETEROGENEITY OF ESOPHAGEAL SQUAMOUS CELL CARCINOMA MICROENVIRONMENT Article Open access 17 December 2021
PAN-CANCER CLASSIFICATION OF SINGLE CELLS IN THE TUMOUR MICROENVIRONMENT Article Open access 23 March 2023 COMPREHENSIVE SINGLE-CELL SEQUENCING REVEALS THE STROMAL DYNAMICS AND
TUMOR-SPECIFIC CHARACTERISTICS IN THE MICROENVIRONMENT OF NASOPHARYNGEAL CARCINOMA Article Open access 09 March 2021 INTRODUCTION In recent years, single-cell RNA sequencing (scRNA-seq)
studies have provided an unprecedented view on how stromal cells consist of heterogeneous and phenotypically diverse populations of cells. Indeed, by now, the tumor microenvironment (TME) of
several cancer types has been profiled, including melanoma,1 lung cancer,2 head and neck cancer,3 hepatocellular carcinoma,4 glioma,5 medulloblastoma,6 pancreatic cancer,7 etc. However,
while there is still an unmet need to chart TME heterogeneity in additional tumors and cancer types, the higher-level question relates to the similarities between these microenvironments.
Indeed, it remains unexplored whether the same stromal cell phenotypes are present in different cancer types. Also, it is not clear to what extent these phenotypes are reminiscent of the
normal tissue from which they originate and are thus characterised by tissue-specific expression. Such knowledge is highly desirable, because it not only facilitates comparison between
different scRNA-seq studies, but also contributes to our insights in cancer type-specific gene expression patterns and treatment vulnerabilities. Furthermore, this knowledge would allow us
to assess at single-cell level the underlying mechanisms of action of novel cancer therapies. Indeed, most innovative cancer therapies are given to cancer patients with advanced disease, in
which tissue biopsies often can only be collected from metastasized organs. It is difficult, however, to systematically identify stromal phenotypes in biopsies taken from different organs,
as their expression is determined by the metastasized tissue. Another challenge is that rare stromal cell phenotypes often cluster together with other more common phenotypes, and can
therefore only be detected when several 10,000s of cells derived from multiple patient biopsies are profiled together. Many of these rare phenotypes are critical in determining response to
cancer treatment and therefore need to be assessed as a separate population of cells. For instance, scRNA-seq of melanoma T-cells exposed to anti-PD1 identified TCF7+ CD8+ memory-precursor
T-cells as the population underlying treatment response. These cells are rare, as they represent only ∼15% of CD8+ T-cells, which by themselves represent only ∼2.5% of cells in these
tumors.8 In order not to miss these rare phenotypes, a blueprint of the different cell populations present in each cancer type would be of considerable benefit. We therefore generated a
comprehensive blueprint of stromal cell heterogeneity across cancer types and provide a detailed view on the shared complexity and heterogeneity of stromal cells in these cancers. We
illustrate how this blueprint can serve as a guide to interpret scRNA-seq data at individual patient level, even when comparing tumors collected from different tissues or profiled using
different scRNA-seq technologies. Our single-cell blueprint can be visualised, analysed and downloaded from an interactive web server (http://blueprint.lambrechtslab.org). RESULTS SCRNA-SEQ
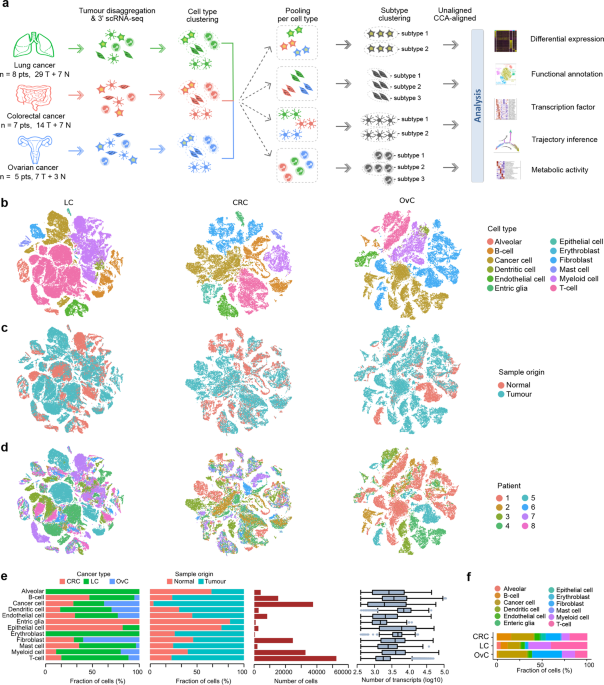
AND CELL TYPING OF TUMOR AND NORMAL TISSUE First, we performed scRNA-seq on tumors from 3 different organs (or cancer types): colorectal cancer (CRC, _n_ = 7), lung cancer (LC, _n_ = 8) and
ovarian cancer (OvC, _n_ = 5). Whenever possible, we retrieved both malignant (tumor) and matched non-malignant (normal) tissue during surgical resection with curative intent. All tumors
were treatment-naïve and reflected different disease stages (e.g., stage I–IV CRC) or histopathologies (e.g., adenocarcinoma versus squamous LC), and whenever possible tissues were collected
from different anatomic sites (e.g., primary tumor from the ovary and omentum in OvC, or from core versus border regions in CRC). Overall, 50 tumor tissues and 17 normal tissues were
profiled (Fig. 1a). Clinical and tumor mutation data are summarised in Supplementary information, Tables S1–3. Following resection, tissues were rapidly digested to a single-cell suspension
and unbiasedly subjected to 3′-scRNA-seq. After quality filtering (Materials and methods), we obtained ~1 billion unique transcripts from 183,373 cells with > 200 genes detected. Of
these, 71.7% of cells originated from malignant tissue. Principle component analysis (PCA) using variably expressed genes was used to generate t-SNEs at different resolutions (Supplementary
information, Fig. S1a, b). Marker genes were used to identify cell types (Supplementary information, Fig. S1c). At low resolution, cells clustered based on cancer type, whereas at high
resolution they clustered based on patient identity (Supplementary information, Fig. S1d). Also, when assessing how cell types previously identified in LC now clustered,2 obvious differences
were noted, with similar phenotypic cells now belonging to distinct clusters. SUB-PHENOTYPING OF CELL TYPES We therefore used a different strategy. First, we clustered cells for each cancer
type separately and assigned cell type identities to each cell (Fig. 1a). The result revealed that cells mostly clustered based on cell type (Fig. 1b; Supplementary information, Fig. S1e),
allowing us to assess the relative contribution of tumor versus normal tissue or individual patients to each cell type (Fig. 1c–e; Supplementary information, Fig. S1f). We observed that
dendritic cells were transcriptionally most active, while T-cells were the most frequent cell type across cancer types (Fig. 1e, f), especially in LC (as observed in other datasets;
Supplementary information, Fig. S1g). We also identified cell types specific for one cancer type, including lung alveolar, epithelial and enteric glial cells. Next, we pooled cells from
different cancer types based on cell type identity and performed PCA-based unaligned clustering, generating t-SNEs displaying the phenotypic heterogeneity for each cell type (Fig. 1a). For
alveolar, epithelial and enteric glial cells this generated 15 tissue-specific subclusters (LC: 5 alveolar clusters and 1 epithelial cluster; CRC: 8 epithelial clusters and 1 enteric glial
cluster), most of which have been described previously9,10 (Supplementary information, Fig. S1h–p). Additionally, 7 tissue-specific subclusters were identified amongst the fibroblasts and
macrophages (see below). Separately, we performed canonical correlation analysis (CCA) for each cancer type followed by graph-based clustering to generate a t-SNE per cell type11 (Fig. 1a).
To avoid that CCA would erroneously assign cells unique for a cancer type, we did not include any of the 22 tissue-specific subclusters. Thus, while unaligned clustering revealed patient or
cancer type-specific clusters, CCA aligned common sources of variation between cancer types. Two measures to calculate sample bias (i.e., “Shannon index” and “mixing metrics”, see “Materials
and methods”) confirmed that after CCA bias decreased in all clusters (Supplementary information, Fig. S1q, r). Overall, we identified 68 stromal subclusters or phenotypes, of which 46 were
shared across cancer types. The number of phenotypes varied between cell types, ranging between 5 to 11 for dendritic cells and fibroblasts, respectively. Our approach was less successful
for cancer cells, which due to underlying genetic heterogeneity continued to cluster patient-specifically (Supplementary information, Fig. S1s–u). The number of cancer cells varied
substantially between tumors, while also T-cells, myeloid cells and B-cells varied considerably (Supplementary information, Fig. S1v–w). Below, we describe each stromal phenotype in more
detail, highlighting the number of cells, read counts and transcripts across all cancer types and for each cancer type separately, both in tumor versus normal tissue (Supplementary
information, Table S4). Additionally, marker genes and functional characteristics of each phenotype are highlighted (Supplementary information, Table S5). The enrichment or depletion of
these phenotypes in a cancer type (LC, CRC and OvC) or tissue (tumor versus normal) are evaluated (Supplementary information, Table S6), while gene set enrichment analysis for biological and
disease pathways (REACTOME and Gene Ontology) is also performed (see http://blueprint.lambrechtslab.org). ENDOTHELIAL CELLS, TISSUE-SPECIFICITY CONFINED TO NORMAL TISSUE Clustering the
transcriptomes of 8223 endothelial cells (ECs) using unaligned and CCA-aligned approaches identified, respectively, 13 and 9 clusters, each with corresponding marker genes (Fig. 2a–c;
Supplementary information, Fig. S2a–c). Five CCA-aligned clusters were shared between cancer types (Fig. 2d, e), including, based on marker gene expression, C1_ESM1 tip cells (_ESM1_,
_NID2_), C2_ACKR1 high endothelial venules (HEVs) and venous ECs (_ACKR1_, _SELP_), C3_CA4 capillary (_CA4_, _CD36_), C4_FBLN5 arterial (_FBLN5_, _GJA5_) and C5_PROX1 lymphatic (_PROX1_,
_PDPN_) ECs. Three other clusters displayed T-cell (C6_CD3D), pericyte (C7_RGS5) and myeloid-specific (C8_AIF1) marker genes and consisted of doublet cells, while one cluster consisted of
low-quality ECs (C9; Supplementary information, Fig. S2d, e). Tip ECs only resided in malignant tissue and were most prevalent in CRC, while also HEVs were enriched in tumors. In contrast,
capillary ECs (cECs) were enriched in normal tissue (Fig. 2d–f; Supplementary information, Fig. S2f). We identified several genes differentially expressed between tumor and normal tissue
(Supplementary information, Fig. S2g and Table S7). For instance, the pro-angiogenic factor perlecan (or _HSPG2_) was highly expressed in tumor versus normal cECs. There were 5 unaligned cEC
clusters, which clustered together (in C3_CA4) after CCA. Among these, 4 were derived from normal tissue (NEC1–4; Fig. 2g). Moreover, NEC1–3s were all from lung, suggesting that most cEC
heterogeneity is ascribable to normal lung. C3_NEC1s represented alveolar cECs based on the absence of _VWF_, while C3_NEC2s and C3_NEC3s represented extra-alveolar cECs12,13 (Fig. 2g–i).
C3_NEC1s expressed _EDNRB_, an oxygen-sensitive regulator mediating vasodilation,14 but also IL33-receptor _IL1RL1_ (ST2). This is surprising as major IL-33 effector cell types are thus far
only immune cells, including basophils and innate lymphocytes.10 Both extra-alveolar cNEC clusters expressed _EDN1_, which is a potent vasoconstrictor. C3_NEC3s additionally expressed
cytokines, chemotactic and immune cell homing molecules (e.g., _IL6_, _CCL2_, _ICAM1_) (Supplementary information, Fig. S2h). In contrast, C3_NEC4s were exclusively composed of ovary and
colon-derived cells, suggesting similarities between NECs from both tissues. A polarized distribution of ovary and colon-derived ECs within the C3_NEC4 cluster (Fig. 2g) suggests, however,
that there are also differences between both tissues. In contrast, tumor cECs (C3_TECs) were derived from all 3 cancer types and lacked tissue specificity on the t-SNE. Indeed, C3_TECs were
all characterised by tumor EC markers _PLVAP_ and _IGFBP7_15,16,17 (Supplementary information, Fig. S2h and Table S5), and only few genes were differentially expressed between cancer types
in TECs (Supplementary information, Fig. S2i). SCENIC18 identified different transcription factors (TFs) underlying each EC phenotype (Fig. 2j, k; Supplementary information, Table S8). For
instance, activation of NF-κB (NFKB1) and HOXB pathways was confined to C3_NEC3s and C3_TECs, respectively. Metabolic pathway analysis revealed distinct metabolic signatures among EC
phenotypes (Fig. 2l, m): glycolysis and oxidative phosphorylation, which promote vessel sprouting,19 were upregulated in tip cells, while fatty acid oxidation, essential for
lymphangiogenesis was increased in lymphatic ECs.19 Metabolic activities within cECs also differed: carbonic acid metabolism was most active in C3_NEC1, confirming these are alveolar cECs,
which actively convert carbonic acid into CO2 during respiration. However, carbonic acid metabolism was reduced in C3_TECs, which instead deployed glycolysis and oxidative phosphorylation
(Supplementary information, Fig. S2j). Similar characteristics were observed when assessing activation of cancer hallmark pathways (Supplementary information, Fig. S2k, l). FIBROBLASTS SHOW
THE HIGHEST CANCER TYPE SPECIFICITY Fibroblasts are highly versatile cell types endowed with extensive heterogeneity.20 Indeed, unaligned clustering of 24,622 fibroblasts resulted in 17
clusters (Fig. 3a, b), which were often tissue-specific (Supplementary information, Fig. S3a–d). Particularly, C1–C3 represented colon-specific clusters derived from normal tissue, while
C4–C6 represented stroma (C4, C5) and mesothelium-derived cells (C6) specific for the ovary. C1–C6 fibroblasts were excluded from CCA, because they have a tissue-specific identity,
localization and function that are unlikely to have counterparts in other tissues (see below). All other fibroblasts clustered into 5 clusters shared across cancer types and patients
(C7–C11; Fig. 3c–e; Supplementary information, Fig. S3e). Three other CCA clusters represented a low-quality (C12) or doublet cluster (C13_CD3D, C14_AIF1) (Supplementary information, Fig.
S3f, g). Fibroblasts therefore consist of 11 cellular phenotypes: tissue-specific clusters C1–C6 identified by unaligned clustering and shared clusters C7–C11 identified by CCA (Fig. 3f, g
for marker genes and functional gene sets). Colon-specific C1–C3s mostly resided in normal tissue (Fig. 3e). C1_KCNN3 fibroblasts co-expressed _KCNN3_ and _P2RY1_ (Fig. 3f), a potassium
calcium-activated channel (SK3-type) and purine receptor (P2Y1), respectively. Their co-expression defines a novel excitable cell that co-localizes with motor neurons in the gastrointestinal
tract and regulates their purinergic inhibitory response to smooth muscle function in the colon.21,22 C1_KCNN3s also expressed _LY6H_, a neuron-specific regulator of nicotine-induced
glutamatergic signalling,23 suggesting these cells to regulate multiple neuromuscular transmission processes. C2_ADAMDEC1s represented mesenchymal cells of the colon lamina propria,24
characterised by _ADAMDEC1_ and _APOE_. C3_SOX6s were marked by _SOX6_ expression, as well as _BMP4_, _BMP5_, _WNT5A_ and _FRZB_ expression (Fig. 3f). They located in close proximity to the
epithelial stem cell niche and promote stem cell maintenance in the colon.24 C4–C5 ovarian stroma cells were marked by _STAR_ and _FOXL2_,25,26 which promote folliculogenesis.27 Both
clusters also expressed _DLK1_, which is typical for embryonic fibroblasts. C4_STARs were derived from normal tissue, while C5_STARs were exclusive to tumor tissue, suggesting that C4_STARs
give rise to C5_STARs.25 Based on calretinin (_CALB2_) and mesothelin (_MSLN_) expression, C6_CALB2s were likely to represent mesothelium-derived cells.28 These cells were especially
enriched in omentum (Supplementary information, Fig. S3h), known to contain numerous mesothelial cells. C7_MYH11 corresponded to myofibroblasts and were characterised by high expression of
smooth muscle-related contractile genes, including _MYH11_, _PLN_ and _ACTG2_ (Fig. 3f). C8_RGS5 represented pericytes (_RGS5_, _PDGFRB_), which similar as myofibroblasts expressed
contractile genes, but also showed pronounced expression of RAS superfamily members (_RRAS_, _RASL12_). Additionally, pericytes expressed a distinct subset of collagens (_COL4A1_, _COL4A2_,
_COL18A1_), genes involved in angiogenesis (_EGFL6_, _ANGPT2_; Fig. 3g) and vessel maturation (_NID1_, _LAMA4_, _NOTCH3_; Supplementary information, Fig. S3i). Pericytes were enriched in
malignant tissue (Fig. 3e, h; Supplementary information, Fig. S3j). When comparing pericytes from malignant versus normal tissue, the former exhibited increased expression of collagens and
angiogenic factors (_PDGFA_, _VEGFA_; Supplementary information, Fig. S3k), but reduced expression of the vascular stabilization factor _TIMP3_.29 These differences may contribute to a leaky
tumor vasculature. C9_CFDs expressed adipocyte markers adipsin (_CFD_) and apolipoprotein D (_APOD_), suggesting these are adipogenic fibroblasts. They are positively associated with aging
in the dermis,30 but their role in malignancy has not been established. Notably, in the unaligned clusters, C9s separated into 3 tissue-specific clusters and a single cancer-associated
fibroblasts (CAF) cluster (Fig. 3a), suggesting that C9 fibroblasts (similar as cECs) lose tissue-specificity in the TME. C10–C11 represented CAFs showing strong activation of cancer
hallmark pathways, including glycolysis, hypoxia, and epithelial-to-mesenchymal transition (Supplementary information, Fig. S3l). C10_COMPs typically expressed metalloproteinases (MMPs),
TGFβ-signalling molecules and extracellular matrix (ECM) genes, including collagens (Fig. 3g). They also expressed the TGF-β co-activator _COMP_, which is activated during chondrocyte
differentiation, and activin (_INHBA_), which synergizes with TGF-β signalling.31,32 Accordingly, chondrocyte-specific TGF-β targets (_COL10A1_, _COL11A1_) were strongly upregulated.
C11_SERPINE1s exhibited increased expression of _SERPINE1_, _IGF1_, _WT1_ and _CLDN1_, which all promote cell migration and/or wound healing via various mechanisms.33,34,35,36 They also
expressed collagens, albeit to a lesser extent as C10_COMPs. Additionally, high expression of the pro-angiogenic _EGFL6_ suggests these cells to exert paracrine functions.37,38
Interestingly, the number of C10–C11 CAFs positively correlated with the presence of cancer cells (Supplementary information, Fig. S3m), confirming the role of CAFs in promoting tumor
growth.20 Using SCENIC, we identified TFs unique to each fibroblast cluster (Fig. 3i). For instance, MYC and EGR3 underpinned C11_CAFs, while pericytes were characterised by EPAS1, TBX2 and
NR2F2 activity. Interestingly, MYC activation of CAFs promotes aggressive features in cancer cells through upregulation of unshielded RNA in exosomes.39 At the metabolic level, we observed
that creatine and cyclic nucleotide metabolism, which are essential for smooth muscle function, were upregulated in myofibroblasts (C7), while glycolysis was most prominent in C10–C11 CAFs
(Fig. 3j). Indeed, highly proliferative CAFs rely on aerobic glycolysis and their glycolytic adaptation promotes a reciprocal metabolic symbiosis between CAFs and cancer cells.20 DENDRITIC
CELLS, NOVEL MARKERS OF CDC MATURATION REVEALED Clustering the transcriptomes of 2722 DCs identified 5 different DC phenotypes using unaligned and CCA-aligned approaches (Fig. 4a). 92% of
cells clustered similarly with both approaches, suggesting DCs in line with their non-resident nature to have limited cancer type specificity. C1_CLEC9As corresponded to conventional DCs
type 1 (cDC1; _CLEC9A_, _XCR1_),40,41 C2_CLEC10As to cDCs type 2 (cDC2; _CD1C, CLEC10A_, _SIRPA_), while C3_CCR7s represented migratory cDCs (_CCR7_, _CCL17_, _CCL19_; Fig. 4b, c;
Supplementary information, Fig. S4a, b). Further, C4_LILRA4s represented plasmacytoid DCs (pDCs; _LILRA4_, _CXCR3_, _IRF7_), while C5_CD207s were related to cDC2s based on _CD1C_ expression.
C5_CD207s additionally expressed Langerhans cell-specific markers: _CD207_ (langerin) and _CD1A_, but not the epithelial markers _CDH1_ and _EPCAM_, typically expressed in Langerhans
cells.42 These cells therefore likely represented a subset of cDC2s with a similar expression as Langerhans cells. Notably, Langerhans-like and migratory DCs were not previously
characterised by scRNA-seq, possibly because these studies focused on blood-derived DCs.40 Overall, C2_CLEC10As were most abundant, while the number of other DCs varied per cancer type. For
instance, C3 was rare in OvC, and C5 enriched in malignant tissue (Fig. 4d, e; Supplementary information, Fig. S4c, d). SCENIC confirmed known TFs to underlie each DC phenotype, including
_BATF3_ for cDC1s, _CEBPB_ for cDC2s, _NFKB2_ for migratory cDCs and _TCF4_ for pDCs (Fig. 4f, g). We also identified novel TFs (Supplementary information, Table S8). For instance, _SPI1_, a
master regulator of Langerhans cell differentiation,43 and _RXRA_, required for cell survival and antigen presentation in Langerhans cells,44 were both expressed in C5. Cancer hallmark
pathway analysis revealed activation of interferon-α and -γ signalling in migratory cDCs, while metabolic pathway analysis confirmed a critical role for folate metabolism (Supplementary
information, Fig. S4e, f).45 By leveraging trajectory inference analyses (using 3 different pipelines; see Materials and methods), we recapitulated the cDC maturation process and observed
that cDC2s are enriched in the migrating branch (Fig. 4h, i), suggesting that migratory cDCs originate from cDC2s but not cDC1s, at least in tumors. Consistent herewith, some migratory
cDC-related genes, i.e., _CCL17_ and _CCL22_, were already upregulated in a subset of cDC2s (Supplementary information, Fig. S4g), highlighting that cDC2s are in a transitional state. In
contrast, cDC maturation markers _CCR7_ and _LAMP3_ were only upregulated at a later stage of the trajectory (Fig. 4j; Supplementary information, Fig. S4h).46 Interestingly, in OvC, cDC2s
got stuck early in the differentiation lineage compared to CRC and LC (Supplementary information, Fig. S4i). By modelling expression along the branches, we retrieved 4 clusters with distinct
temporal expression (Fig. 4k), in which we identified 30 and 210 genes up- or down-regulated (Supplementary information, Table S9). For example, _CLEC10A_ was gradually lost during cDC2
maturation, while _BIRC3_ was upregulated, suggesting they represent novel markers of cDC maturation. Also, when investigating TF dynamics from cDC2s to migratory cDCs, we identified 22 up-
and 23 down-regulated TFs, respectively (Fig. 4l; Supplementary information, Fig. S4j). B-CELLS, COMPREHENSIVE TAXONOMY AND DEVELOPMENTAL TRAJECTORY Amongst the 15,247 B-cells, we identified
8 clusters using unaligned clustering (Fig. 5a). Three of these represented follicular B-cells (_MS4A1_/CD20), which reside in lymphoid follicles of intra-tumor tertiary lymphoid
structures, while 4 clusters were antibody-secreting plasma cells (_MZB1_ and _SDC1_/CD138) (Supplementary information, Fig. S5a, b). We also retrieved a T-cell (C9_CD3D) doublet cluster
(Supplementary information, Fig. S5c). CCA identified 2 additional clusters: one unaligned follicular B-cell cluster, which was split into 2 separate clusters (C2 and C3; Fig. 5a, b), and
one additional cancer cell (C10_KRT8) doublet cluster (Supplementary information, S5c). Overall, this resulted in 8 relevant B-cell clusters, each of them characterised by functional gene
sets (Fig. 5c). Follicular B-cells were composed of mature-naïve (_CD27_−, C1) and memory (_CD27_+, C2–C4) B-cells (Fig. 5c). The former cells are characterised by a unique
_CD27_−/_IGHD_+(IgD)/_IGHM_+(IgM) signature and give rise to the latter by migrating through the germinal centre (GC; referred to as GC-memory B-cells). This process requires expression of
migratory factors _CCR7_ (for GC entry) and _GPR183_ (for GC exit; Supplementary information, Fig. S5d).47 In the GC, _IGHM_ undergoes class-switch recombination to form other immunoglobulin
isotypes. Indeed, GC-memory B-cells separated into _IGHM_+ and _IGHM__−_ populations, i.e., C2 _IGHM__+_ and C3 _IGHM__−_ clusters (Fig. 5a–c). A rare population of memory B-cells is
generated independently of the GC.48 These GC-independent memory B-cells corresponded to C4_CD27+/CD38+s, lacking GC migratory factors _GPR183_ and _CCR7_, but expressing the anti-GC
migration factor _RGS13_, which may form the basis for their GC exclusion49 (Fig. 5b; Supplementary information, Fig. S5d). Although little is known about GC-independent B-cells, they appear
early during immune response and respond to a broader range of antigens with less specificity as GC-memory B-cells.50 Interestingly, C4s exhibited an expression signature intermediate to
mature-naïve and GC-memory B-cells (Supplementary information, Fig. S5e). Expression of _IGHD_ and _IGHM_ was low, while _IGHG1_ and _IGHG3_ were elevated (Supplementary information, Fig.
S5f), suggesting C4s to have completed class-switch recombination. Indeed, _AICDA_ expression, which induces mutations in class-switch regions during recombination,50 was elevated in C4s
(Fig. 5c). They were also characterised by several uniquely expressed genes and enriched for proliferative cells (Supplementary information, Fig. S5g and Table S5). Next to follicular
B-cells, we identified 4 clusters of plasma B-cells (C5–C8), which can be separated based on expression of immunoglobulin heavy chains, i.e., _IGHG1_ (IgG) versus _IGHA1_ (IgA). Both could
be further stratified based on their antibody-secreting capacity as determined by _PRDM1_ (Blimp-1)50: low versus high for immature versus mature plasma cells, overall resulting in 4 plasma
B-cell clusters (Fig. 5c). Importantly, B-cell clusters were enriched in all tumors, except for IgA-expressing plasma cells, which mainly resided in mucosa-rich normal colon (Fig. 5d, e;
Supplementary information, Fig. S5h–j). Additionally, GC-independent memory B-cells were most prevalent in CRC. B-cells were also enriched in border versus core fractions of LC tumors
(Supplementary information, Fig. S5k). Using SCENIC, each B-cell cluster was characterised by a unique set of TFs (Fig. 5f). For instance, GC-independent memory B-cells upregulated NF-κB
(RELB) and STAT6, which is known to suppress _GPR183_.51 Some TFs were upregulated in mature (_PRDM1_high) plasma cells, irrespective of their heavy chain expression. These included multiple
immediate-early response TFs (FOS, JUND and EGR1) and the interferon regulatory factor IRF1 (Supplementary information, Fig. S5l), suggesting they are involved in plasma cell maturation.
C5_IgG_mature B-cells, relative to all other plasma B-cells, exhibited strong activation of nearly all cancer hallmark pathways, indicating an active role of C5s in the TME (Supplementary
information, Fig. S5m). Trajectory inference analysis confirmed that mature-naïve B-cells differentiate into either GC-memory IgM+ or IgM− branches. As expected, IgM+ but not IgM− cells were
located halfway the trajectory (Fig. 5g; Supplementary information, Fig. S5n), confirming IgM+ cells to undergo class-switch recombination into IgM− cells. Memory B-cells of the IgM+ and
IgM− lineages were similarly distributed in OvC and CRC, but in LC they were more differentiated (Supplementary information, Fig. S5o). By overlaying gene expression dynamics on the
trajectory, we identified several up- or down-regulated genes along the pseudotime, including _CD27_ and _TCL1A_, respectively (Fig. 5h; Supplementary information, Fig. S5p, q and Table S9).
In line with _CCR7_ and _GPR183_ determining GC entry and exit, _CCR7_ was expressed in mature-naïve B-cells (C1, before entry) but disappeared in _IGHM_− B-cells. Vice versa, _GPR183_ was
only expressed after GC entry (C2 and C3, Supplementary information, Fig. S5d, q). Similarly, we assessed the trajectory of class-switched GC-memory B-cells (C3) differentiating into plasma
cells. We confirmed that GC-memory B-cells differentiate into either IgG+- or IgA+-expressing plasma cells (Fig. 5i), and that both branches subsequently dichotomize into mature or immature
states based on _PRDM1_ expression (Fig. 5j). Cells were similarly distributed along the trajectory regardless of the cancer type, although in LC there was an enrichment towards the
beginning of the IgA lineage (Supplementary information, Fig. S5r). Further, when assessing underlying expression dynamics along the trajectory, we identified several genes staging the
differentiation process (Supplementary information, Fig. S5s and Table S9). For example, we found _TNFRSF17_ (also known as B-cell maturation antigen) to increase along the IgA+ plasma cell
trajectory.52 T-/NK-CELLS SHOW CANCER TYPE-DEPENDENT PREVALENCE Altogether, 52,494 T- and natural killer (NK) cells clustered into 12 and 11 clusters using unaligned and CCA-aligned methods
(Fig. 6a, b). The additional cluster identified by unaligned clustering (C12) was composed of cells from normal lung tissue (Supplementary information, Fig. S6a, b). CCA did not affect
clustering of T-/NK-cells in tumors, indicating that T-cells have limited cancer type-specific differences. Besides C12 and a low-quality cluster (C11, Supplementary information, Fig. S6c,
d), T-/NK-cells consisted of 10 phenotypes, including 4 CD8+ T-cell (C1–C4), 4 CD4+ T-cell (C5–C8) and 2 NK-cell clusters (C9–C10). The C1_CD8_HAVCR2 cluster consisted of exhausted CD8+
cytotoxic T-cells characterised by cytotoxic effectors (_GZMB_, _GNLY_, _IFNG_) and inhibitory markers (_HAVCR2_, _PDCD1_, _CTLA4_, _LAG3_, _TIGIT_; Fig. 6c). C2_CD8_GZMKs represented
pre-effector cells as expression of _GZMK_ was high, but expression of cytotoxic effectors low. C3_CD8_ZNF683s constituted memory CD8+ T-cells based on _ZNF683_ expression,53 while
C4_CD8_CX3CR1s corresponded to effector T-cells due to high cytotoxic marker expression. Remarkably, C4s also expressed markers typically observed in NK-cells (_KLRD1_, _FGFBP2_, _CX3CR1_),
suggesting they are endowed with NK T-cell (NKT) activity. Similarly, based on marker gene expression, we assigned C5_CD4_CCR7s to naïve (_CCR7_, _SELL_, _LEF1_), C6_CD4_GZMAs to CD4+
memory/effector (_GZMA_, _ANXA1_) and C7_CD4_CXCL13s to exhausted CD4+ effector T-cells (_CXCL13_, _PDCD1_, _CTLA4_, _BTLA_). Based on the expression of _FOXP3_, C8_FOXP3s were assigned CD4+
regulatory T-cells (Tregs). Finally, two clusters contained NK-cells based on NK- (_NCR1_, _NCAM1_) but not T-cell (_CD3D_, _CD4_, _CD8A_; Fig. 6b, c) marker gene expression. Particularly,
C9_NK_FGFBP2s represented cytotoxic NK-cells due to the expression of _FGFBP2, FCGR3A_ and cytotoxic genes including _GZMB_, _NKG7_ and _PRF1_, while C10_NK_XCL1s appeared to be less
cytotoxic, but positive for _XCL1_ and _XCL2_, two chemo-attractants involved in DC recruitment enhancing immunosurveillance.54 Interestingly, T-cell clusters were highly similar to the
T-cell taxonomy derived from breast, liver and lung cancer, despite underlying differences in sample preparation and single-cell technology53,55,56 (Supplementary information, Fig. S6e).
Indeed, C8 cells could be re-clustered into CLTA4high and CLTA4low clusters with corresponding marker genes53,56 (Supplementary information, Fig. S6f, g), while also both NK clusters
corresponded to recently identified NK subclusters shared across organs and species.57 Several T-cell phenotypes, especially those with inhibitory markers, were enriched in tumor tissue
(Fig. 6d, e; Supplementary information, Fig. S6h). C9_NK_FGFBP2s were more prevalent in normal tissue, suggesting these to represent tissue-patrolling phenotypes of NK-cells. All T-cell
clusters were more frequent in LC, while cytotoxic T-cells were rare in CRC and regulatory T-cells underrepresented in OvC (Fig. 6f). Expression of inhibitory markers (_HAVCR2_, _LAG3_,
_PDCD1_) was enhanced in exhausted/cytotoxic C1_CD8_HAVCR2s residing in tumor versus normal tissue (Supplementary information, Fig. S6i). We also observed expression of KLRC1 (_NKG2A_), a
novel checkpoint,58,59 exclusively in C10 NK-cells (Fig. 6c). CD8+ T-cell trajectory analysis revealed that C2 pre-effector T-cells also contained naïve CD8+ T-cells, which expressed _CCR7_,
_TFC7_ and _SELL_, and formed the root of the trajectory (Supplementary information, Fig. S6j, k). Pre-effector T-cells then differentiated into either exhausted (C1_CD8_HAVCR2) or effector
(C4_CD8_CX3CR1) T-cells (Fig. 6g). Dynamic expression of marker genes along both trajectories confirmed high expression of _IFNG_, inhibitory and cytotoxicity markers in the HAVCR2
trajectory (Supplementary information, Fig. S6l). Interestingly, LC CD8+ T-cells were more differentiated in this trajectory and thus more exhausted compared to T-cells from CRC and OvC
(Fig. 6h). TFs underlying each T-/NK-cell phenotype were identified by SCENIC (Fig. 6i): for instance, FOXP3 was specific for C8s, as expected, while IRF9, which induces _PDCD1_,60 was
increased in exhausted CD8+ T-cells (C1). C1_CD8_HAVCR2 T-cells exhibited high interferon activation based on cancer hallmark analysis (Supplementary information, Fig. S6m), while metabolic
pathway analysis revealed upregulation of glycolysis and nucleotide metabolism in T-cell phenotypes enriched in tumors (C1, C7–C8; Supplementary information, Fig. S6n). Finally, we noticed a
negative correlation between the prevalence of cancer and immune cells, including several T-cell phenotypes (Supplementary information, Fig. S3m). When scoring cancer cells for cancer
hallmark pathways and comparing these scores with stromal cell phenotype abundance, some remarkable associations were noticed. Specifically, C1_CD8_HAVCR2 T-cells were positively correlated
with augmented interferon signalling, inflammation and IL6/JAK/STAT3 signalling in cancer cells (Supplementary information, Fig. S6o). TRAJECTORY OF MONOCYTE-TO-MACROPHAGE DIFFERENTIATION
REVEALED In the 32,721 myeloid cells, we identified 12 unaligned clusters, including 2 monocyte (C1–C2), 7 macrophage (C3–C9) and 1 neutrophil (C10) clusters (Fig. 7a, b). A low-quality
cluster (C11) and myeloid/T-cell doublet cluster (C12_CD3D) were not discussed (Supplementary information, S7a, b). Only C8 macrophages were tissue-specific, while remaining cells clustered
similarly with CCA as with unaligned clustering, expressing the same marker genes and functional gene sets (Fig. 7c; Supplementary information, Fig. S7c, d). Monocytes clustered separately
from macrophages based on reduced macrophage marker expression (_CD68_, _MSR1_, _MRC1_) and a phylogenetic reconstruction (Supplementary information, Fig. S7e, f). C1_CD14 monocytes
represented classical monocytes based on high expression of _CD14_ and _S100A8_/_9_, and typically being recruited during inflammation. They expressed the monocyte trafficking factors _SELL_
(CD62L) —involved in EC adhesion— and C_CR2_, a receptor for the pro-migratory cytokine CCL2. C2_CD16s were less abundant and represented non-classical monocytes based on low expression of
_CD14_, but high expression of _FCGR3A_ (CD16) and other marker genes61 (_CDKN1C_, _MTSS1_; Supplementary information, Fig. S7f). C2s constantly patrol the vasculature, express _CX3CR1_
(Supplementary information, Fig. S7d, g) and migrate into tissues in response to CX3CL1 derived from inflamed ECs. Macrophages were classified based on origin (tissue-resident versus
recruited) or their pro- _versus_ anti-inflammatory role (M1-like versus M2-like, Fig. 7c). C3_CCR2s and C4_CCL2s represented early-stage macrophages that were closely-related, not enriched
in tumors (Fig. 7d; Supplementary information, Fig. S7e) and become replenished by classical monocytes. Specifically, C3 macrophages represented immature macrophages closely related to C1
monocytes, as they also expressed _CCR2_ (Fig. 7b). They were characterised by pronounced M1 marker gene expression (_IL1B_, _CXCL9_, _CXCL10_, _SOCS3_; Fig. 7c). C4_CCL2s were characterised
by _CCL2_ expression, which is another M1 marker promoting immune cell recruitment to inflammatory sites. Compared to C3s, C4 macrophages expressed less _CCR2_, but moderate levels of the
M2 marker gene _MRC1_, suggesting an intermediate pro-inflammatory phenotype. Macrophages belonging to C5–C7 clusters were enriched in malignant tissue and represented tumor-associated
macrophages (TAMs, Fig. 7d; Supplementary information, Fig. S7h). C5_CCL18s represented ~72% of all TAMs and were characterised by M2 marker expression, including _CCL18_ and _GPNMB_ (Fig.
7c). Additional heterogeneity separated C5 cells into intermediate and more differentiated M2 macrophages, although differences were graded, consistent with a continuous phenotypic spectrum
(Supplementary information, Fig. S7i). Indeed, there was more pronounced M2 marker expression (e.g., _SEPP1_, _STAB1_, _CCL13_) in 34% of C5s.62 These also expressed key metabolic pathway
regulators, i.e., _SLC40A1_ (iron), _FOLR2_ (folate), _FUCA1_ (fucose) and _PDK4_ (pyruvate), linking M2 differentiation with metabolic reprogramming. C6_MMP9 macrophages expressed a unique
subset of M2 markers (_CCL22_, _IL1RN_, _CHI3L1_) and several MMPs, suggesting a role in tumor tissue remodelling. Cancer hallmark analysis revealed enrichment in EMT, hypoxia, glycolysis
and many other pathways (Supplementary information, Fig. S7j). C7_CX3CR1 macrophages expressed genes involved both in M1 and M2 polarization (_CCL3, CCL4_, _TNF_, _AXL_, respectively, Fig.
7c). Interestingly, AXL is involved in apoptotic cell clearance,63 whereas other M2 markers involved in pathogen clearance, i.e., _MRC1_ and _CD163_, were absent, suggesting a unique
phagocytic pattern of C7 cells. They are also correlated with poor prognosis in OvC and CRC.64,65 Of note, C7 macrophages shared their CD16high/CX3CR1high phenotype with C2 non-classical
monocytes, suggesting both clusters may be related (Supplementary information, Fig. S7g). C8_PPARG macrophages corresponded to resident alveolar macrophages due to expression of the resident
alveolar macrophage marker _PPARG_. They were exclusive to normal lung tissue (Fig. 7d), expressed established M2 markers (_MSR1_, _CCL18_, _AXL_)62,66 in addition to anti-inflammatory
genes (_FABP4_, _ALDH2_).67,68 C9_LYVE1 macrophages also represented resident macrophages with pronounced M2 marker expression and enrichment in normal tissue. They often locate at the
perivasculature of different tissues where they contribute to both angiogenesis and vasculature integrity.69,70,71 Indeed, C9 macrophages expressed the angiogenic factor _EGFL7_, but also
immunomodulators _CD209_, _CH25H_ and _LILRB5_, which are implicated in both innate and adaptive immunity.62,72,73 Finally, the C10_FCGR3B cluster represented neutrophils expressing the
neutrophil-specific antigen CD16B (encoded by _FCGR3B_), but not _MPO_, which is typically expressed in neutrophils during inflammation and microbial infection. C10 cells expressed
pro-inflammatory factors (_CXCL8_, _IL1B_, _CCL3_, _CCL4_; Supplementary information, Fig. S7g) and, in line with their pro-tumor activity, also pro-angiogenic factors (_VEGFA_, _PROK2_).74
Notably, neutrophils were strongly enriched in malignant tissue, but were characterised by low transcriptional activity (689 detected genes/cell; Fig. 7d; Supplementary information, Fig.
S7b). Interestingly, except for resident alveolar macrophages (C8), all myeloid clusters were present in each cancer type, albeit with some preferences (Fig. 7d, e). Similar to other
scRNA-seq studies,4,6,7,75 we failed to identify myeloid-derived suppressor cells (MDSCs), which are known to be morphologically and phenotypically similar to monocytes and neutrophils.
Indeed, the _S100A8/9_ markers expressed in MDSCs were also highly expressed in C1 monocytes and C10 neutrophils76,77,78 (Supplementary information, Fig. S7g). This highlights that scRNA-seq
fails to fully dissect the heterogeneity underlying myeloid cells and, if possible, should be combined with mass cytometry to profile cell-surface markers that characterize MDSCs.79 To
delineate monocyte-to-macrophage differentiation, we performed a trajectory inference analysis. We excluded non-classical monocytes and related macrophages (C2, C7), and resident macrophages
(C8, C9). In the trajectory, C1 monocytes were progenitor cells for C3 immature macrophages (Fig. 7f). Next on the time scale were C4 macrophages, which further separated into C5 and C6
macrophages, suggesting C4 macrophages to be endowed with high plasticity prior to M2 differentiation. Interestingly, most of LC macrophages differentiated into both lineages (Supplementary
information, Fig. S7k). Profiling of gene expression dynamics along the trajectory (Fig. 7g, h) revealed a reduction of known monocyte markers (_CD14_, _S100A8_, _SELL_) and increased
expression of 230 other genes (Supplementary information, Table S9), including several M2 markers. SCENIC identified several TFs underlying each myeloid phenotype or the
monocyte-to-macrophage differentiation trajectory (Fig. 7i, j; Supplementary information, S7l, m). For example, there was a gradual increase of MAFB and decrease of FOS, FOSB and EGR1 along
the trajectory, as reported.80,81 Interestingly, terminally differentiated clusters (C5, C6) were characterised by distinct TFs, but also shared TFs, including the hypoxia-induced HIF-2α82
(EPAS1; Supplementary information, Fig. S7n). Finally, we also identified 1962 mast cells. These cells represent a rare stromal cell type that was not enriched for in tumors, and that could
be subclustered into 4 cellular phenotypes (Supplementary information, Fig. S8a–h). MAPPING THE BLUEPRINT IN BREAST CANCER In 3 different cancers, we identified 68 stromal cell (sub)types,
of which 46 were shared. To confirm this heterogeneity in another cancer type, we profiled 14 treatment-naïve breast cancers (BC) using 5′-scRNA-seq and clustered the 44,024 cells with high
quality data (Materials and methods). After assigning cell types (Fig. 8a; Supplementary information, Fig. S9a), we re-clustered cells per cell type using unaligned clustering, or after
pooling cell type data from BC with those from other cancer types, while applying CCA alignment for 5′ versus 3′-scRNA-seq. Both approaches clustered the 14,413 T-cells from BC into their 10
cellular phenotypes, each with similar expression signatures as described for 3′-scRNA-seq (Fig. 8b; Supplementary information, Fig. S9b). However, in other cell types unaligned clustering
failed to identify the cellular phenotypes, especially when they were less abundant. In contrast, CCA recovered 43 out of the 46 shared phenotypes (Fig. 8b, c; Supplementary information,
Fig. S9c). Only for mast cells, for which too few cells were detected (_n_ = 360), CCA also failed to identify the respective phenotypes. Notably, across cancer types all cellular phenotypes
were characterised by a highly similar expression of marker genes and underlying TFs (Fig. 8d, e; Supplementary information, Fig. S9d–h). These data confirm that the stromal cell blueprint
can also be assigned to other cancer types. When subsequently comparing stromal cell type distribution between BC and all other cancers, we found more T-cells in BC than CRC or OvC, but not
LC (Supplementary information, Fig. S9i). At the subcluster level, BC was enriched for pDCs (C4_LILRA4), but had few lymphatic ECs (C5_PROX1; Supplementary information, Fig. S9j). This is
possibly because most patients (8/14) had a triple-negative BC, which is more immunogenic, without lymph node involvement. THE BLUEPRINT AS A GUIDE TO INTERPRET SCRNA-SEQ STUDIES We also
applied our blueprint to SMART-seq2 data from melanomas treated with immune checkpoint inhibitors (ICIs). We clustered our T-/NK-cells from the blueprint with the 12,681 T-/NK-cells profiled
by SMART-seq2,8 while performing CCA for technology. This resulted in the 10 T-/NK-cell phenotypes of the blueprint (Supplementary information, Fig. S10a–c). Cells profiled by both
technologies contributed to every phenotypic T-/NK-cell cluster, each with similar expression signatures, suggesting effective CCA alignment. Next, we confirmed findings of Sade-Feldman et
al.,8 showing that (i) presence of exhausted CD8+ T-cells (C1) in melanoma tumors predicts resistance to ICI, while (ii) increased expression of the naïve T-cell marker _TCF7_ across CD8+
T-cells predicts response to ICI (Supplementary information, Fig. S10d). However, when assessing _TCF7_ in the context of the blueprint, we found it was expressed in 2 out of 4 CD8+ T-cell
phenotypes (C2–C3), of which only pre-effector CD8+ T-cells (C2) were significantly more prevalent in responders (Fig. 8f, g). Additionally, _TCF7_ expression was high in naïve CD4+ T-cells
(C5), which were also enriched in responders (_P_ = 0.0021). Receiver operating characteristic (ROC) analysis to evaluate the predictive effect of the C5 cluster revealed an AUC of 0.90 (_P_
= 0.0021; Fig. 8h). Albeit to a lesser extent, C1 and C2 clusters were also enriched in non-responders and responders, respectively (Supplementary information, Fig. S10e). Notably, CD4+
TCF7+ T-cells resided outside of blood vessels, within the tumor at the peritumoral front (Supplementary information, Fig. S10f). Next, we applied our blueprint to monitor changes in
T-/NK-cells during ICI. When comparing pre- versus on-treatment biopsies (_n_ = 4 with response versus _n_ = 6 without response), we observed an increase in exhausted CD8+ T-cells
(C1_CD8_HAVCR2) in on-treatment biopsies. Vice versa, there was a relative decrease in naïve CD4+ (C5_CD4_CCR7) T-cells (Supplementary information, Fig. S10g, h). Notably, these differences
were only observed in responding patients, suggesting that during response, phenotypic clusters that predict resistance in the pre-treatment biopsy increase, while those predicting response
decrease in prevalence. Overall, these data illustrate that single-cell data obtained with various technologies can be re-analysed in the context of the blueprint. VALIDATION OF THE
BLUEPRINT AT PROTEIN LEVEL With the availability of CITE-seq, we can now simultaneously detect RNA and protein expression at single-cell level.83 To confirm the cancer blueprint at protein
level, a panel of 198 antibodies (Supplementary information, Table S10) compatible with 3′-scRNA-seq was used. We processed 5 BCs, obtaining 6,194 cells with both transcriptome and proteome
data. Independent clustering of both datasets revealed how cell types could be discerned based on either marker gene or protein expression (Fig. 9a, b). Since antibodies were mainly directed
against immune cells, especially T-cells, we focused our subclustering efforts on this cell type. We pooled 1310 T-/NK-cells with both RNA and protein data together with T-/NK-cells from
the blueprint. Subsequent clustering based on scRNA-seq data accurately assigned each T-/NK-cell to its phenotypic cluster (Fig. 9c, d). Next, we selected marker genes amongst the 198
antibodies and explored protein expression per cluster (Fig. 9e). A combination of CD3, CD4, CD8 and NCR1 effectively discriminated CD4+, CD8+ T-cells and NK-cells. The T-cell exhaustion
marker PD-1 discriminated exhausted CD4+ and CD8+ T-cell phenotypes (C1, C7), while IL2RA (CD25) was specific for CD4+ Tregs (C8). CD8+ memory T-cells (C3) were characterised by high ITGA1
but low PDCD1. Both the cytotoxic T-/NK-cells (C4, C9) had high levels of KLRG1, while CD4+ naïve cells had high ITGA6 and SELL (C5). Unfortunately, there were no antibodies specific for C2
and C6 cells. Despite this limitation, a random forest model developed to predict major cell types and T-cell phenotypes based on CITE-seq classified > 80% of cells into the same cell
(sub)type compared to scRNA-seq data. DISCUSSION Here, we performed scRNA-seq on 233,591 single cells from 36 patients with either lung, colon, ovarian or breast cancer. By applying two
different clustering approaches —one designed to detect tissue-specific differences, the other to find shared heterogeneity amongst stromal cell types— we constructed a pan-cancer blueprint
of stromal cell heterogeneity. Briefly, we found that tissue-resident cell types, including ECs and fibroblasts, were characterised by considerable patient and tissue specificity in the
normal tissue, but that part of this heterogeneity disappeared within the TME. On the other hand, phenotypes involving non-residential cell types, which encompass most of the
tumor-infiltrating immune cells, were often shared amongst all patients and cancer types. Overall, we identified 68 stromal phenotypes, of which 46 were shared between cancer types and 22
were cancer type-unique. Amongst the shared phenotypes, several have not previously been described at single-cell level, including tumor-associated pericytes and other fibroblast phenotypes,
mast cells, GC-independent B-cells, neutrophils, etc. Of note, by applying a CITE-seq approach to simultaneously profile gene and protein expression, we confirmed all major cell types and
T-cell phenotypes identified by scRNA-seq. An important merit of our study is the public availability of the scRNA-seq data and the stromal blueprint we describe, which can all be
interactively accessed via our blueprint server. This will allow scientists to co-cluster their own scRNA-seq data together with blueprint data and assign each of their individual cells to a
cellular phenotype. This can also be achieved by feeding our stromal blueprint dataset to established machine learning pipelines, e.g., CellAssign,84 and assigning each new cell to the most
likely proxy. Such strategy would indeed be highly relevant, as several of our cellular phenotypes are missed when a smaller number of cells is analysed. Interestingly, as illustrated for
melanoma, pooling new with existing scRNA-seq data was even possible when a different single-cell technology was used. Similarly, this blueprint could serve as training matrix to estimate
the prevalence from specific cell (sub)types in bulk tissue transcriptomes using newly developed deconvolution methods, i.e., CIBERSORTx.85 This is important, as bulk RNA-seq data of tumor
tissues are often available for multiple large and homogeneous cohorts of cancer patients. We also built trajectories between relevant cell phenotypes, highlighting how several of these do
not represent separate entities. Stratification of these trajectories for cancer type revealed some intriguing differences. For instance, LC contained more exhausted CD8+ cytotoxic T-cells
in the C1_CD8_HAVCR2 trajectory. Moreover, LC appeared more inflammatory as it was enriched for differentiated myeloid cells along both the CCL18 and MMP9 lineage. Also, memory B-cells were
more differentiated in LC, while cDC2s got stuck early in the trajectory in OvC. Most probably, these differences are due to the fact that LC is an immune-infiltrated cancer with a high
tumor mutation burden (TMB) and neoepitope load,86 while OvC and CRC are cold tumors with a low TMB. We believe our blueprint is also useful when monitoring dynamic changes in the TME during
cancer treatment. Indeed, by performing scRNA-seq on individual biopsies obtained before and during treatment, individual cells can be assigned to each phenotypic cluster and changes can
easily be interpreted in the context of the blueprint. For instance, when re-analysing a set of pre- versus on-treatment biopsies from melanomas exposed ICIs, we observed that exhausted CD8+
T-cells became gradually more common during treatment, while naïve CD4+ T-cells became less common. Notably, these shifts were only observed in patients responding to the treatment.
Although findings that naïve CD4+ helper T-cells predict checkpoint immunotherapy are novel, these findings are not unexpected. Firstly, CD4+ helper T-cells can also express PD1, and are
thus targeted by the treatment. Furthermore, they can enhance CD8+ T-cell infiltration,87 improve antibody penetration,88 T-cell memory formation, or have a direct cytolytic capacity.89
Several other studies suggest the role of both naïve CD4+ and CD8+ T-cells in priming anti-tumor activity.90 Overall, we believe that our approach to monitor how blueprint phenotypes change
in response to cancer treatment and gradually also contribute to therapeutic resistance, will allow scientists to gain important insights into the mechanisms of action of novel cancer
drugs. MATERIALS AND METHODS PATIENTS This study was approved by the local ethics committee at the University Hospital Leuven for each cancer type. Only patients provided with informed
consent were included in this study. The clinical information of all patients was summarised in Supplementary information, Table S1. PREPARATION OF SINGLE-CELL SUSPENSIONS Following
resection, samples from the tumor and adjacent non-malignant tissue were rapidly processed for single-cell RNA-sequencing. Samples were rinsed with PBS, minced on ice to pieces of < 1 mm3
and transferred to 10 mL digestion medium containing collagenase P (2 mg mL−1, ThermoFisher Scientific) and DNAse I (10U µL−1 Sigma) in DMEM (ThermoFisher Scientific). Samples were
incubated for 15 min at 37 °C, with manual shaking every 5 min. Samples were then vortexed for 10 s and pipetted up and down for 1 min using pipettes of descending sizes (25, 10 and 5 mL).
Next, 30 mL ice-cold PBS containing 2% fetal bovine serum was added and samples were filtered using a 40 µm nylon mesh (ThermoFisher Scientific). Following centrifugation at 120× _g_ and 4
°C for 5 min, the supernatant was decanted and discarded, and the cell pellet was resuspended in red blood cell lysis buffer. Following a 5-min incubation at room temperature, samples were
centrifuged (120× _g_, 4 °C, 5 min) and resuspended in 1 mL PBS containing 8 µL UltraPure BSA (50 mg/mL−1; AM2616, ThermoFisher Scientific) and filtered over Flowmi 40 µm cell strainers
(VWR) using wide-bore 1 mL low-retention filter tips (Mettler-Toledo). Next, 10 µL of this cell suspension was counted using an automated cell counter (Luna) to determine the concentration
of live cells. The entire procedure was completed in less than 1 h (typically about 45 min). SINGLE CELL RNA-SEQ DATA ACQUISITION AND PRE-PROCESSING Libraries for scRNA-seq were generated
using the Chromium Single Cell 3′ or 5′ library and Gel Bead & Multiplex Kit from 10x Genomics (Supplementary information, Table S2). We aimed to profile 5000 cells per library (if
sufficient cells were retained during dissociation). All libraries were sequenced on Illumina NextSeq, HiSeq4000 or NovaSeq6000 until sufficient saturation was reached (73.8% on average,
Supplementary information, Table S2). After quality control, raw sequencing reads were aligned to the human reference genome GRCh38 and processed to a matrix representing the UMI’s per cell
barcode per gene using CellRanger (10x Genomics, v2.0). SINGLE-CELL RNA ANALYSIS TO DETERMINE MAJOR CELL TYPES AND CELL PHENOTYPES Raw gene expression matrices generated per sample were
merged and analysed with the Seurat package (v2.3.4). Matrices were filtered by removing cell barcodes with < 401 UMIs, < 201 expressed genes, > 6000 expressed genes or > 25% of
reads mapping to mitochondrial RNA. The remaining cells were normalized and genes with a normalized expression between 0.125 and 3, and a quantile-normalized variance > 0.5 were selected
as variable genes. The number of variably-expressed genes differs for each clustering step (Supplementary information, Table S4). When clustering cell types, we regressed out confounding
factors: number of UMIs, percentage of mitochondrial RNA, patient ID and cell cycle (S and G2M phase scores calculated by the CellCycleScoring function in Seurat). After regression for
confounding factors, all variably-expressed genes were used to construct principal components (PCs) and PCs covering the highest variance in the dataset were selected. The selection of these
PCs was based on elbow and Jackstraw plots. Clusters were calculated by the FindClusters function with a resolution between 0.2 and 2, and visualised using the t-SNE dimensional reduction
method. Differential gene-expression analysis was performed for clusters generated at various resolutions by both the Wilcoxon rank sum test and Model-based Analysis of Single-cell
Transcriptomics (MAST) using the FindMarkers function. A specific resolution was selected when known cell types were identified as a cluster at a given resolution, but not at a lower
resolution (Supplementary information, Table S5), with the minimal constraint that each cluster has at least 10 significantly differentially expressed genes (FDR < 0.01 with both methods)
with at least a 2-fold difference in expression compared to all other clusters. Annotation of the resulting clusters to cell types was based on the expression of marker genes (Supplementary
information, Fig. S1c). All major cell types were identified in one clustering step, except for DCs; pDCs co-clustered with B-cells, while other DCs co-clustered with myeloid cells.
Therefore, we first separated DCs per cancer type based on established marker genes (pDC: _LILRA4_ and _CXCR3_; cCDs: _CLEC9A_, _XCR1_, _CD1C_, _CCR7_, _CCL17_, _CCL19_, Langerhans-like:
_CD1A_, _CD207_)2,40 and then pooled these DCs for subclustering. Next, all cells assigned to a given cell type per cancer type were merged and further subclustered into functional
phenotypes using the same strategy, which we refer to as the unaligned clustering approach in the manuscript. However, the confounding factors used for cell types were not sufficient to
reduce patient-specific effects when performing the subclustering. Instead of directly applying an unsupervised batch correction algorithm, we found that the interferon response
(BROWNE_INTERFERON_RESPONSIVE_GENES in the Molecular Signatures Database or MSigDB v6.2) and the sample dissociation-induced gene signatures91 represent common patient-specific confounders,
which were therefore regressed out. We additionally regressed out the hypoxia signature92 for myeloid cells to avoid clusters driven by hypoxia state instead of its origin or
(anti-)inflammatory functions. Since hemoglobin and immunoglobulin genes are common contaminants from ambient RNA, hemoglobin genes were excluded for PCA. This also applied to immunoglobulin
genes, except when subclustering B-cells. For T-cell subclustering, variable genes of T-cell receptor (_TRAV_s, _TRBV_s, _TRDV_s, _TRGV_s) were excluded to avoid somatic hypermutation
associated variances. Similarly, variable genes of B-cell receptor (_IGLV_s, _IGKV_s, _IGHV_s) were all excluded when subclustering B-cells. To reveal similarities between the subclusters
across cancer types, we performed canonical correlation analysis (CCA, RunMultiCCA function) by aligning data from different cancer types into a subspace with the maximal correlation.11 The
selection of CCA dimensions or canonical correction vectors (CCs) for subspace alignment were guided by the CC bicor saturation plot (MetageneBicorPlot function). Resolution was determined
similar to the PCA-based approach described above, followed by marker gene-based cluster annotation. Since CCA is designed to identify shared clusters, we performed CCA alignment without
cancer-type specific cells defined by PCA-based approach for fibroblasts and myeloid cells. Low quality clusters were identified based on the number of detected genes within subclusters and
the lack of marker genes. Doublet clusters expressed marker genes from other cell lineages, and had a higher than expected (3.9% according to the User Guide from 10x Genomics) doublets rate,
as predicted by the artificial k-nearest neighbours algorithm implemented in DoubletFinder (v1.0).93 We also used Scrublet94 to identify doublet cells and could predict the same clusters as
predicted by DoubletFinder. As an example, we evaluate for each of the B-cell clusters, (i) the expression of marker genes from other cell types, (ii) the higher number of detected genes,
and (iii) the overlap of cells predicted to be doublets by DoubletFinder and Scrublet (Supplementary Information, Fig. S11a–d). For a comprehensive statistical analysis, we used a
single-cell specific method based on mixed-effects modelling of associations of single cells (MASC)95. The analysis systematically addressed two major questions: which cell types are
enriched or depleted in all cancers or in a particular cancer type, and which cell types or stromal phenotypes are enriched or depleted in tumors versus normal tissues in all cancers or in a
particular cancer type. Events with FDR < 0.05 were considered significant as summarised in Supplementary information, Table S6. SCENIC ANALYSIS Transcription factor (TF) activity was
analysed using SCENIC (v1.0.0.3) per cell type with raw count matrices as input. The regulons and TF activity (AUC) for each cell were calculated with the pySCENIC (v0.8.9) pipeline with
motif collection version mc9nr. The differentially activated TFs of each subcluster were identified by the Wilcoxon rank sum test against all the other cells of the same cell type. TFs with
log-fold-change > 0.1 and an adjusted _P_ < 1e−5 were considered as significantly upregulated. TRAJECTORY INFERENCE ANALYSIS We applied the Monocle (v2.8.0) algorithm to determine the
potential lineage between diverse stromal cell phenotypes.96 Seurat objects were imported to Monocle using importCDS function. DDRTree-based dimension reduction was performed with conserved
and differentially expressed genes. These genes were calculated for each subcluster across LC, CRC and OvC using FindConservedMarkers function in Seurat using the metap (v1.0) algorithm and
Wilcoxon rank sum test (max_pval < 0.01, minimum_p_val < 1e−5). PC selection was determined using the PC variance plot (plot_pc_variance_explained function in Monocle, 3−5 PCs). Genes
with branch-dependent expression dynamics were calculated using the BEAM test in Monocle. Genes with a _q_ < 1e−10 were plotted in heatmaps. The dynamics of transcription factor activity
(or AUC) was calculated by SCENIC and plotted per branch of trajectory along the pseudotime calculated by Monocle. For each TF, the AUC and pseudotime, smoothed as a natural spline using
sm.ns function, were fitted in vector generalised linear model (VGLM) using VGAM package v1.1. TF with _q_ < 1e−50 were selected for plotting. Two other trajectory inference pipelines,
i.e., Slingshot and SCORPIUS,97,98 were also used. Since SCORPIUS cannot handle branched trajectories, we analysed both trajectories separately with the branching topology informed by
Monocle analysis. To assess consistency between these pipelines, scaled pseudotime between Monocle, Slingshot and SCORPIUS were compared and high correlations were consistently observed
between all lineages. Additionally, we compared expression of key marker genes along the trajectories of all 3 tools (Supplementary Information, Fig. S12a–k). METABOLIC AND CANCER HALLMARK
PATHWAYS AND GENESET ENRICHMENT ANALYSIS Metabolic pathway activities were estimated with gene signatures from a curated database.99 For robustness of the analysis, lowly expressed genes
(< 1% cells) or genes shared by multiple pathways were trimmed. And pathways with less than 3 genes were excluded. Cancer hallmark gene sets from Molecular Signatures Database (MSigDB
v6.1) were used. The activity of individual cells for each gene set was estimated by AUCell package (v1.2.4). The differentially activated pathways of each subcluster were identified by
running the Wilcoxon rank sum test against other cells of the same cell type. Pathways with log-fold-change > 0.05 and an adjusted _P_ < 0.01 were considered as significantly
upregulated. GO and REACOTOME geneset enrichment analyses were performed using hypeR package,100 geneset over-representation was determined by hypergeometric test. CITE-SEQ We adopted the
established CITE-seq protocol83 with some modifications. Briefly, 100,000–500,000 single cells of breast tumors were suspended in 100 μL staining buffer (2% BSA, 0.01% Tween in PBS) before
adding 10 µL Fc-blocking reagent (FcX, BioLegend). and incubating during 10 min on ice. This was followed by the addition of 25 µL TotalSeq-A (Biolegend) antibody-oligo pool (1:1000 diluted
in staining buffer) and another 30 min incubation on ice. Cells were washed 3 times with staining buffer and filtered through a 40 µm flowmi strainer before processing with 3′-scRNA-seq
library kits. ADT (Antibody-Derived Tags) additive primers were added to increase the yield of the ADT product. ADT-derived and mRNA-derived cDNAs were separated by SPRI purification and
amplified for library construction and subsequent sequencing. For each cell barcode detected in the corresponding RNA library, ADTs were counted in the raw sequencing reads of CITE-seq
experiments using CITE-seq-Count version 1.4. In the resulting UMI per ADT matrix, the noise level was calculated for each cell by taking the average signal increased with 3× the standard
deviation of 10 control probes. Signals below this level were excluded. We divided the UMIs by the total UMI count for each cell to account for differences in library size and a centred
log-ratio (CLR) normalization specific for each gene was computed. Clustering of protein data was performed using the Euclidean distance matrix between cells and t-SNE coordinates were
calculated using this distance matrix. The random forest algorithm incorporated in Seurat was iteratively applied on a training and test set, consisting of 67% and 33% of cells respectively,
to predict cell types and T-/NK-cell phenotypes. IMMUNOFLUORESCENCE ASSAY AND ANALYSIS A 5-µm-section of a formalin-fixed, paraffin-embedded (FFPE) microarray containing 14 melanoma
metastasis from 9 patients was stained with antibodies against SOX10 (SCBT; sc-365692), CD4 (abcam; ab133616), CD31 (LSBio; LS-C173974) and TCF7 (R&D systems; AF5596) at a concentration
of 1 µg/mL according to the Multiple Iterative Labeling by Antibody Neodeposition (MILAN) protocol, as described.101 TUMOR MUTATION DETECTION Whole-exome sequencing was performed as
described previously.102 The average sequencing depth was ×161 ± 67 coverage. Mutation of CRC samples were detected using Illumina Trusight26 Tumour kit. DATA AVAILABILITY Raw sequencing
reads of the single-cell RNA experiments have been deposited in the ArrayExpress database at EMBL-EBI (www.ebi.ac.uk/arrayexpress) under accession number E-MTAB-8107, E-MTAB-6149 and
E-MTAB-6653. Based on SCope package,103 an interactive web server for scRNA-seq data visualisation, exploration and downloading of the count matrix is available at
http://blueprint.lambrechtslab.org. REFERENCES * Tirosh, I. et al. Dissecting the multicellular ecosystem of metastatic melanoma by single-cell RNA-seq. _Science_ 352, 189–96 (2016). CAS
PubMed PubMed Central Google Scholar * Lambrechts, D. et al. Phenotype molding of stromal cells in the lung tumor microenvironment. _Nat. Med._ 24, 1277–1289 (2018). CAS PubMed Google
Scholar * Puram, S. V. et al. Single-cell transcriptomic analysis of primary and metastatic tumor ecosystems in head and neck cancer. _Cell_ 171, 1611–1624 (2017). CAS PubMed PubMed
Central Google Scholar * Aizarani, N. et al. A human liver cell atlas reveals heterogeneity and epithelial progenitors. _Nature_ 572, 199–204 (2019). CAS PubMed PubMed Central Google
Scholar * Venteicher, A. S. et al. Decoupling genetics, lineages, and microenvironment in IDH-mutant gliomas by single-cell RNA-seq. _Science_ 355, eaai8478 (2017). PubMed PubMed Central
Google Scholar * Hovestadt, V. et al. Resolving medulloblastoma cellular architecture by single-cell genomics. _Nature_ 572, 74–79 (2019). CAS PubMed PubMed Central Google Scholar *
Peng, J. et al. Single-cell RNA-seq highlights intra-tumoral heterogeneity and malignant progression in pancreatic ductal adenocarcinoma. _Cell Res._ 29, 725–738 (2019). CAS PubMed PubMed
Central Google Scholar * Sade-Feldman, M. et al. Defining T cell states associated with response to checkpoint immunotherapy in melanoma. _Cell_ 175, 998–1013 (2018). CAS PubMed PubMed
Central Google Scholar * Parikh, K. et al. Colonic epithelial cell diversity in health and inflammatory bowel disease. _Nature_ 567, 49–55 (2019). CAS PubMed Google Scholar * Cohen, M.
et al. Lung single-cell signaling interaction map reveals basophil role in macrophage imprinting. _Cell_ 175, 1031–1044 (2018). CAS PubMed Google Scholar * Butler, A., Hoffman, P.,
Smibert, P., Papalexi, E. & Satija, R. Integrating single-cell transcriptomic data across different conditions, technologies, and species. _Nat. Biotechnol._ 36, 411–420 (2018). CAS
PubMed PubMed Central Google Scholar * Pusztaszeri, M. P., Seelentag, W. & Bosman, F. T. Immunohistochemical expression of endothelial markers CD31, CD34, von Willebrand factor, and
Fli-1 in normal human tissues. _J. Histochem. Cytochem._ 54, 385–395 (2006). CAS PubMed Google Scholar * Müller, A. M., Skrzynski, C., Skipka, G. & Müller, K.-M. Expression of von
Willebrand factor by human pulmonary endothelial cells in vivo. _Respiration_ 69, 526–533 (2002). PubMed Google Scholar * Dhaun, N. & Webb, D. J. Endothelins in cardiovascular biology
and therapeutics. _Nat. Rev. Cardiol. 2019_ 6, 1 (2019). Google Scholar * Strickland, L. A. et al. Plasmalemmal vesicle-associated protein (PLVAP) is expressed by tumour endothelium and is
upregulated by vascular endothelial growth factor-A (VEGF). _J. Pathol._ 206, 466–475 (2005). CAS PubMed Google Scholar * Rupp, C. et al. IGFBP7, a novel tumor stroma marker, with
growth-promoting effects in colon cancer through a paracrine tumor-stroma interaction. _Oncogene_ 34, 815–825 (2015). CAS PubMed Google Scholar * van Beijnum, J. R. Gene expression of
tumor angiogenesis dissected: specific targeting of colon cancer angiogenic vasculature. _Blood_ 108, 2339–2348 (2006). PubMed Google Scholar * Aibar, S. et al. SCENIC: Single-cell
regulatory network inference and clustering. _Nat. Methods_ 14, 1083–1086 (2017). CAS PubMed PubMed Central Google Scholar * Eelen, G. et al. Endothelial cell metabolism. _Physiol. Rev._
98, 3–58 (2018). CAS PubMed Google Scholar * Kalluri, R. The biology and function of fibroblasts in cancer. _Nat. Rev. Cancer_ 16, 582–598 (2016). CAS PubMed Google Scholar *
Kurahashi, M. et al. A functional role for the ‘fibroblast-like cells’ in gastrointestinal smooth muscles. _J. Physiol._ 589, 697–710 (2011). CAS PubMed Google Scholar * Lee, H., Koh, B.
H., Peri, L. E., Sanders, K. M. & Koh, S. D. Purinergic inhibitory regulation of murine detrusor muscles mediated by PDGFRα + interstitial cells. _J. Physiol._ 592, 1283–1293 (2014). CAS
PubMed PubMed Central Google Scholar * Puddifoot, C. A., Wu, M., Sung, R.-J. & Joiner, W. J. Ly6h regulates trafficking of Alpha7 nicotinic acetylcholine receptors and
nicotine-induced potentiation of glutamatergic signaling. _J. Neurosci._ 35, 3420–3430 (2015). CAS PubMed PubMed Central Google Scholar * Kinchen, J. et al. Structural remodeling of the
human colonic mesenchyme in inflammatory bowel disease. _Cell_ 175, 372–386 (2018). CAS PubMed PubMed Central Google Scholar * Fujisawa, M. et al. Ovarian stromal cells as a source of
cancer-associated fibroblasts in human epithelial ovarian cancer: a histopathological study. _PLoS One_ 13, 1–15 (2018). Google Scholar * Jabara, S. et al. Stromal cells of the human
postmenopausal ovary display a distinctive biochemical and molecular phenotype. _J. Clin. Endocrinol. Metab._ 88, 484–492 (2003). CAS PubMed Google Scholar * Pisarska, M. D., Barlow, G.
& Kuo, F. T. Minireview: roles of the forkhead transcription factor FOXL2 in granulosa cell biology and pathology. _Endocrinology_ 152, 1199–1208 (2011). CAS PubMed PubMed Central
Google Scholar * Rynne-Vidal, A. et al. Mesothelial-to-mesenchymal transition as a possible therapeutic target in peritoneal metastasis of ovarian cancer. _J. Pathol._ 242, 140–151 (2017).
CAS PubMed PubMed Central Google Scholar * Saunders, W. B. et al. Coregulation of vascular tube stabilization by endothelial cell TIMP-2 and pericyte TIMP-3. _J. Cell Biol._ 175, 179–191
(2006). CAS PubMed PubMed Central Google Scholar * Salzer, M. C. et al. Identity noise and adipogenic traits characterize dermal fibroblast aging. _Cell_ 175, 1575–1590 (2018). CAS
PubMed Google Scholar * Haudenschild, D. R. et al. Enhanced activity of transforming growth factor β1 (TGF-β1) bound to cartilage oligomeric matrix protein. _J. Biol. Chem._ 286,
43250–43258 (2011). CAS PubMed PubMed Central Google Scholar * Staudacher, J. J. et al. Activin signaling is an essential component of the TGF-β induced pro-metastatic phenotype in
colorectal cancer. _Sci. Rep._ 7, 1–9 (2017). Google Scholar * Simone, T. & Higgins, P. Inhibition of SERPINE1 function attenuates wound closure in response to tissue injury: a role for
PAI-1 in re-epithelialization and granulation tissue formation. _J. Dev. Biol._ 3, 11–24 (2015). CAS Google Scholar * Ghahary, A. et al. Mannose-6-phosphate/IGF-II receptors mediate the
effects of IGF-1-induced latent transforming growth factor β1 on expression of type I collagen and collagenase in dermal fibroblasts. _Growth Factors_ 17, 167–176 (2000). CAS PubMed Google
Scholar * Brett, A., Pandey, S. & Fraizer, G. The Wilms’ tumor gene (WT1) regulates E-cadherin expression and migration of prostate cancer cells. _Mol. Cancer_ 12, 1–13 (2013). Google
Scholar * Volksdorf, T. et al. Tight junction proteins Claudin-1 and Occludin are important for cutaneous wound healing. _Am. J. Pathol._ 187, 1301–1312 (2017). CAS PubMed Google Scholar
* Chim, S. M. et al. EGFL6 promotes endothelial cell migration and angiogenesis through the activation of extracellular signal-regulated kinase. _J. Biol. Chem._ 286, 22035–22046 (2011).
CAS PubMed PubMed Central Google Scholar * Orimo, A. et al. Stromal fibroblasts present in invasive human breast carcinomas promote tumor growth and angiogenesis through elevated
SDF-1/CXCL12 Secretion. _Cell_ 121, 335–348 (2005). CAS PubMed Google Scholar * Nabet, B. Y. et al. Exosome RNA unshielding couples stromal activation to pattern recognition receptor
signaling in cancer. _Cell_ 170, 352–366 (2017). CAS PubMed PubMed Central Google Scholar * Villani, A.-C. et al. Single-cell RNA-seq reveals new types of human blood dendritic cells,
monocytes, and progenitors. _Science_ 356, eaah4573 (2017). PubMed PubMed Central Google Scholar * Guilliams, M. et al. Unsupervised high-dimensional analysis aligns dendritic cells
across tissues and species. _Immunity_ 45, 669–684 (2016). CAS PubMed PubMed Central Google Scholar * Merad, M., Ginhoux, F. & Collin, M. Origin, homeostasis and function of
Langerhans cells and other langerin-expressing dendritic cells. _Nat. Rev. Immunol._ 8, 935–947 (2008). CAS PubMed Google Scholar * Chopin, M. et al. Langerhans cells are generated by two
distinct PU.1-dependent transcriptional networks. _J. Exp. Med._ 210, 2967–2980 (2013). CAS PubMed PubMed Central Google Scholar * Geissmann, F. et al. Retinoids regulate survival and
antigen presentation by immature dendritic cells. _J. Exp. Med._ 198, 623–634 (2003). CAS PubMed PubMed Central Google Scholar * Wu, C. H., Huang, T. C. & Lin, B. F. Folate
deficiency affects dendritic cell function and subsequent T helper cell differentiation. _J. Nutr. Biochem._ 41, 65–72 (2017). CAS PubMed Google Scholar * Salaun, B. et al. Cloning and
characterization of the mouse homologue of the human dendritic cell maturation marker CD208/DC-LAMP. _Eur. J. Immunol._ 33, 2619–2629 (2003). CAS PubMed Google Scholar * Gatto, D., Wood,
K. & Brink, R. EBI2 operates independently of but in cooperation with CXCR5 and CCR7 to direct B cell migration and organization in follicles and the germinal center. _J. Immunol._ 187,
4621–4628 (2011). CAS PubMed Google Scholar * Takemori, T., Kaji, T., Takahashi, Y., Shimoda, M. & Rajewsky, K. Generation of memory B cells inside and outside germinal centers. _Eur.
J. Immunol._ 44, 1258–1264 (2014). CAS PubMed Google Scholar * Shi, G.-X., Harrison, K., Wilson, G. L., Moratz, C. & Kehrl, J. H. RGS13 regulates germinal center b lymphocytes
responsiveness to CXC chemokine ligand (CXCL)12 and CXCL13. _J. Immunol._ 169, 2507–2515 (2002). CAS PubMed Google Scholar * Cyster, J. G. & Allen, C. D. C. B cell responses: cell
interaction dynamics and decisions. _Cell_ 177, 524–540 (2019). CAS PubMed PubMed Central Google Scholar * Turqueti-Neves, A. et al. B-cell-intrinsic STAT6 signaling controls germinal
center formation. _Eur. J. Immunol._ 44, 2130–2138 (2014). CAS PubMed Google Scholar * Gustafson, C. E. et al. Limited expression of APRIL and its receptors prior to intestinal IgA plasma
cell development during human infancy. _Mucosal Immunol._ 7, 467–477 (2014). CAS PubMed Google Scholar * Guo, X. et al. Global characterization of T cells in non-small-cell lung cancer
by single-cell sequencing. _Nat. Med._ 24, 978–985 (2018). CAS PubMed Google Scholar * Böttcher, J. P. et al. NK cells stimulate recruitment of cDC1 into the tumor microenvironment
promoting cancer immune control. _Cell_ 172, 1022–1037 (2018). PubMed PubMed Central Google Scholar * Savas, P. et al. Single-cell profiling of breast cancer T cells reveals a
tissue-resident memory subset associated with improved prognosis. _Nat. Med._ 24, 986–993 (2018). CAS PubMed Google Scholar * Zheng, C. et al. Landscape of infiltrating t cells in liver
cancer revealed by single-cell sequencing. _Cell_ 169, 1342–1356 (2017). CAS PubMed Google Scholar * Crinier, A. et al. High-dimensional single-cell analysis identifies organ-specific
signatures and conserved NK cell subsets in humans and mice. _Immunity_ 49, 971–986 (2018). CAS PubMed PubMed Central Google Scholar * André, P. et al. Anti-NKG2A mAb is a checkpoint
inhibitor that promotes anti-tumor immunity by unleashing both T and NK cells. _Cell_ 175, 1731–1743 (2018). PubMed PubMed Central Google Scholar * van Montfoort, N. et al. NKG2A blockade
potentiates cd8 t cell immunity induced by cancer vaccines. _Cell_ 175, 1744–1755 (2018). PubMed PubMed Central Google Scholar * Terawaki, S. et al. IFN-α directly promotes programmed
cell death-1 transcription and limits the duration of t cell-mediated immunity. _J. Immunol._ 186, 2772–2779 (2011). CAS PubMed Google Scholar * Ancuta, P. et al. Transcriptional
profiling reveals developmental relationship and distinct biological functions of CD16+ and CD16- monocyte subsets. _BMC Genomics_ 10, 403 (2009). PubMed PubMed Central Google Scholar *
Rőszer, T. Understanding the mysterious M2 macrophage through activation markers and effector mechanisms. _Mediators Inflamm._ 2015, 1–16 (2015). Google Scholar * Zagórska, A., Través, P.
G., Lew, E. D., Dransfield, I. & Lemke, G. Diversification of TAM receptor tyrosine kinase function. _Nat. Immunol._ 15, 920–928 (2014). PubMed PubMed Central Google Scholar * Hart,
K. M., Bak, S. P., Alonso, A. & Berwin, B. Phenotypic and functional delineation of nurine CX3CR1+ monocyte-derived cells in ovarian cancer. _Neoplasia_ 11, 564–IN10 (2009). CAS PubMed
PubMed Central Google Scholar * Zheng, J. et al. Chemokine receptor CX3CR1 contributes to macrophage survival in tumor metastasis. _Mol. Cancer_ 12, 141 (2013). PubMed PubMed Central
Google Scholar * Schraufstatter, I. U., Zhao, M., Khaldoyanidi, S. K. & Discipio, R. G. The chemokine CCL18 causes maturation of cultured monocytes to macrophages in the M2 spectrum.
_Immunology_ 135, 287–298 (2012). CAS PubMed PubMed Central Google Scholar * Steen, K. A., Xu, H. & Bernlohr, D. A. FABP4/aP2 regulates macrophage redox signaling and inflammasome
activation via control of UCP2. _Mol. Cell. Biol_. 37, e00282–16 (2017). * Pan, C. et al. Aldehyde dehydrogenase 2 inhibits inflammatory response and regulates atherosclerotic plaque.
_Oncotarget_ 7, 35562–35576 (2016). PubMed PubMed Central Google Scholar * Lim, H. Y. et al. Hyaluronan receptor LYVE-1-expressing macrophages maintain arterial tone through
Hyaluronan-mediated regulation of smooth muscle cell collagen. _Immunity_ 49, 326–341 (2018). CAS PubMed Google Scholar * Xu, H., Chen, M., Reid, D. M. & Forrester, J. V.
LYVE-1–positive macrophages are present in normal murine eyes. _Investig. Opthalmol. Vis. Sci._ 48, 2162 (2007). Google Scholar * Chakarov, S. et al. Two distinct interstitial macrophage
populations coexist across tissues in specific subtissular niches. _Science_ 363, eaau0964 (2019). CAS PubMed Google Scholar * Wu, T. et al. Regulating innate and adaptive immunity for
controlling SIV infection by 25-hydroxycholesterol. _Front. Immunol._ 9, 2686 (2018). PubMed PubMed Central Google Scholar * Hogan, L. E., Jones, D. C. & Allen, R. L. Expression of
the innate immune receptor LILRB5 on monocytes is associated with mycobacteria exposure. _Sci. Rep._ 6, 21780 (2016). CAS PubMed PubMed Central Google Scholar * Shojaei, F. et al. Bv8
regulates myeloid-cell-dependent tumour angiogenesis. _Nature_ 450, 825–831 (2007). CAS PubMed Google Scholar * van Galen, P. et al. Single-cell RNA-Seq reveals AML hierarchies relevant
to disease progression and immunity. _Cell_ 176, 1265–1281 (2019). PubMed PubMed Central Google Scholar * Elyada, E. et al. Cross-species single-cell analysis of pancreatic ductal
adenocarcinoma reveals antigen-presenting cancer-associated fibroblasts. _Cancer Discov._ 9, 1102–1123 (2019). PubMed PubMed Central Google Scholar * Marvel, D. & Gabrilovich, D. I.
Myeloid-derived suppressor cells in the tumor microenvironment: expect the unexpected. _J. Clin. Investig._ 125, 3356–3364 (2015). PubMed PubMed Central Google Scholar * Ryckman, C.,
Vandal, K., Rouleau, P., Talbot, M. & Tessier, P. A. Proinflammatory activities of S100: proteins S100A8, S100A9, and S100A8/A9 induce neutrophil chemotaxis and adhesion. _J. Immunol._
170, 3233–3242 (2003). CAS PubMed Google Scholar * Bronte, V. et al. Recommendations for myeloid-derived suppressor cell nomenclature and characterization standards. _Nat. Commun._ 7,
12150 (2016). CAS PubMed PubMed Central Google Scholar * Liu, H., Shi, B., Huang, C.-C., Eksarko, P. & Pope, R. M. Transcriptional diversity during monocyte to macrophage
differentiation. _Immunol. Lett._ 117, 70–80 (2008). CAS PubMed PubMed Central Google Scholar * Kelly, L. M. MafB is an inducer of monocytic differentiation. _EMBO J._ 19, 1987–1997
(2000). CAS PubMed PubMed Central Google Scholar * Hickey, M. M. et al. Hypoxia-inducible factor 2α regulates macrophage function in mouse models of acute and tumor inflammation. _J.
Clin. Investig._ 120, 2699–2714 (2010). PubMed PubMed Central Google Scholar * Stoeckius, M. et al. Simultaneous epitope and transcriptome measurement in single cells. _Nat. Methods_ 14,
865–868 (2017). CAS PubMed PubMed Central Google Scholar * Zhang, A. W. et al. Probabilistic cell-type assignment of single-cell RNA-seq for tumor microenvironment profiling. _Nat.
Methods_ 16, 1007–1015 (2019). CAS PubMed PubMed Central Google Scholar * Newman, A. M. et al. Determining cell type abundance and expression from bulk tissues with digital cytometry.
_Nat. Biotechnol._ 37, 773–782 (2019). CAS PubMed PubMed Central Google Scholar * Samstein, R. M. et al. Tumor mutational load predicts survival after immunotherapy across multiple
cancer types. _Nat. Genet._ 51, 202–206 (2019). CAS PubMed PubMed Central Google Scholar * Nakanishi, Y., Lu, B., Gerard, C. & Iwasaki, A. CD8+ T lymphocyte mobilization to
virus-infected tissue requires CD4+ T-cell help. _Nature_ 462, 510–513 (2009). CAS PubMed PubMed Central Google Scholar * Iijima, N. & Iwasaki, A. Access of protective antiviral
antibody to neuronal tissues requires CD4 T-cell help. _Nature_ 533, 552–556 (2016). CAS PubMed PubMed Central Google Scholar * Quezada, S. A. et al. Tumor-reactive CD4+ T cells develop
cytotoxic activity and eradicate large established melanoma after transfer into lymphopenic hosts. _J. Exp. Med._ 207, 637–650 (2010). CAS PubMed PubMed Central Google Scholar * Borst,
J., Ahrends, T., Bąbała, N., Melief, C. J. M. & Kastenmüller, W. CD4+ T cell help in cancer immunology and immunotherapy. _Nat. Rev. Immunol._ 18, 635–647 (2018). CAS PubMed Google
Scholar * Van Den Brink, S. C. et al. Single-cell sequencing reveals dissociation-induced gene expression in tissue subpopulations. _Nat. Methods_ 14, 935–936 (2017). PubMed Google Scholar
* Buffa, F. M., Harris, A. L., West, C. M. & Miller, C. J. Large meta-analysis of multiple cancers reveals a common, compact and highly prognostic hypoxia metagene. _Br. J. Cancer_
102, 428–435 (2010). CAS PubMed PubMed Central Google Scholar * McGinnis, C. S., Murrow, L. M. & Gartner, Z. J. DoubletFinder: doublet detection in single-cell RNA sequencing data
using artificial nearest neighbors. _Cell Syst._ 8, 329–337 (2019). CAS PubMed PubMed Central Google Scholar * Wolock, S. L., Lopez, R. & Klein, A. M. Scrublet: computational
identification of cell doublets in single-cell transcriptomic data. _Cell Syst._ 8, 281–291.e9 (2019). CAS PubMed PubMed Central Google Scholar * Fonseka, C. Y. et al. Mixed-effects
association of single cells identifies an expanded effector CD4+ T cell subset in rheumatoid arthritis. _Sci. Transl. Med._ 10, eaaq0305 (2018). PubMed PubMed Central Google Scholar *
Qiu, X. et al. Reversed graph embedding resolves complex single-cell trajectories. _Nat. Methods_ 14, 979–982 (2017). CAS PubMed PubMed Central Google Scholar * Street, K. et al.
Slingshot: cell lineage and pseudotime inference for single-cell transcriptomics. _BMC Genomics_ 19, 1–16 (2018). Google Scholar * Cannoodt, R. et al. SCORPIUS improves trajectory inference
and identifies novel modules in dendritic cell development. _bioRxiv_ https://doi.org/10.1101/079509 (2016). * Gaude, E. & Frezza, C. Tissue-specific and convergent metabolic
transformation of cancer correlates with metastatic potential and patient survival. _Nat. Commun._ 7, 1–9 (2016). Google Scholar * Federico, A. & Monti, S. hypeR: an R package for
geneset enrichment workflows. _Bioinformatics_ 36, 1307–1308 (2019). PubMed Central Google Scholar * Bosisio, F. M. et al. Functional heterogeneity of lymphocytic patterns in primary
melanoma dissected through single-cell multiplexing. _Elife_ 9, 1–21 (2020). Google Scholar * Boeckx, B. et al. The genomic landscape of nonsmall cell lung carcinoma in never smokers. _Int.
J. Cancer_ 146, 3207–3218 (2019). PubMed Google Scholar * Davie, K. et al. A single-cell transcriptome atlas of the aging Drosophila brain. _Cell_ 174, 982–998 (2018). CAS PubMed PubMed
Central Google Scholar Download references ACKNOWLEDGEMENTS We thank T. Van Brussel, R. Schepers, and E. Vanderheyden for their technical assistance. This work was supported by VIB
TechWatch funding, Scientific Fund for Research-Flanders (FWO) grants to D. Lambrechts (G065615N), a Stichting tegen Kanker (STK) grant to D. Lambrechts (FAF-C/2016/876) and a VIB Grand
Challenge grant to D. Lambrechts. The computational resources used in this work were provided by the Flemish Supercomputer Center (VSC), funded by the Hercules Foundation and the Flemish
Government, Department of Economy, Science and Innovation (EWI). AUTHOR INFORMATION AUTHORS AND AFFILIATIONS * VIB Center for Cancer Biology, Leuven, Belgium Junbin Qian, Siel Olbrecht, Bram
Boeckx, Ayse Bassez, Amelie Franken, Marlies Vanden Bempt, Jieyi Xiong & Diether Lambrechts * Laboratory for Translational Genetics, Department of Human Genetics, KU Leuven, Leuven,
Belgium Junbin Qian, Siel Olbrecht, Bram Boeckx, Ayse Bassez, Amelie Franken, Marlies Vanden Bempt, Jieyi Xiong & Diether Lambrechts * Department of Obstetrics and Gynaecology,
University Hospitals Leuven, Leuven, Belgium Siel Olbrecht, Pieter Busschaert & Ignace Vergote * Department of Oncology, KU Leuven, Surgical Oncology, University Hospitals Leuven,
Leuven, Belgium Hanne Vos & Ann Smeets * Lab of Cellular and Molecular Immunology, Vrije Universiteit Brussel, Brussels, Belgium Damya Laoui * Myeloid Cell Immunology Lab, VIB Center for
Inflammation Research, Brussels, Belgium Damya Laoui * Laboratory of Molecular Digestive Oncology, Department of Oncology, KU Leuven, Leuven, Belgium Emre Etlioglu, Valentina Pomella, Sara
Verbandt & Sabine Tejpar * Respiratory Oncology Unit (Pneumology) and Leuven Lung Cancer Group, University Hospital KU Leuven, Leuven, Belgium Els Wauters * Laboratory of Pneumology,
Department of Chronic Diseases, Metabolism and Ageing, KU Leuven, Leuven, Belgium Els Wauters * Department of Imaging and Pathology, Laboratory of Translational Cell & Tissue Research
and University Hospitals Leuven, Department of Pathology, KU Leuven-University of Leuven, B-3000, Leuven, Belgium Birgit Weynand, Asier Antoranz, Francesca Maria Bosisio & Giuseppe
Floris * Laboratory of Experimental Oncology, KU Leuven, Leuven, Belgium Yannick van Herck * Laboratory for Functional Epigenetics, Department of Human Genetics, KU Leuven, Leuven, Belgium
Bernard Thienpont Authors * Junbin Qian View author publications You can also search for this author inPubMed Google Scholar * Siel Olbrecht View author publications You can also search for
this author inPubMed Google Scholar * Bram Boeckx View author publications You can also search for this author inPubMed Google Scholar * Hanne Vos View author publications You can also
search for this author inPubMed Google Scholar * Damya Laoui View author publications You can also search for this author inPubMed Google Scholar * Emre Etlioglu View author publications You
can also search for this author inPubMed Google Scholar * Els Wauters View author publications You can also search for this author inPubMed Google Scholar * Valentina Pomella View author
publications You can also search for this author inPubMed Google Scholar * Sara Verbandt View author publications You can also search for this author inPubMed Google Scholar * Pieter
Busschaert View author publications You can also search for this author inPubMed Google Scholar * Ayse Bassez View author publications You can also search for this author inPubMed Google
Scholar * Amelie Franken View author publications You can also search for this author inPubMed Google Scholar * Marlies Vanden Bempt View author publications You can also search for this
author inPubMed Google Scholar * Jieyi Xiong View author publications You can also search for this author inPubMed Google Scholar * Birgit Weynand View author publications You can also
search for this author inPubMed Google Scholar * Yannick van Herck View author publications You can also search for this author inPubMed Google Scholar * Asier Antoranz View author
publications You can also search for this author inPubMed Google Scholar * Francesca Maria Bosisio View author publications You can also search for this author inPubMed Google Scholar *
Bernard Thienpont View author publications You can also search for this author inPubMed Google Scholar * Giuseppe Floris View author publications You can also search for this author inPubMed
Google Scholar * Ignace Vergote View author publications You can also search for this author inPubMed Google Scholar * Ann Smeets View author publications You can also search for this
author inPubMed Google Scholar * Sabine Tejpar View author publications You can also search for this author inPubMed Google Scholar * Diether Lambrechts View author publications You can also
search for this author inPubMed Google Scholar CONTRIBUTIONS J.Q. and D. Lambrechts. designed and supervised the study and wrote the manuscript; J.Q. and B.B. performed data analysis with
significant contributions from P.B. and J.X.; I.V., A.S., S.T. and E.W. coordinated sample collection and clinical annotation with assistance from S.O., H.V., E.E., V.P., S.V., A.B., M.V.B.,
A.F. and G.F.; F.M.B., Y.V.H. and A.A. performed MILAN for melanoma samples. D. Laoui and B.T. contributed with critical data interpretation. All the authors have read the manuscript and
provided useful comments. CORRESPONDING AUTHOR Correspondence to Diether Lambrechts. ETHICS DECLARATIONS COMPETING INTERESTS The authors declare no competing interests. SUPPLEMENTARY
INFORMATION FIG. S1 FIG. S2 FIG. S3 FIG. S4 FIG. S5 FIG. S6 FIG. S7 FIG. S8 FIG. S9 FIG. S10 FIG. S11 FIG. S12 TABLE S1 TABLE S2 TABLE S3 TABLE S4 TABLE S5 TABLE S6 TABLE S7 TABLE S8 TABLE
S9 TABLE S10 RIGHTS AND PERMISSIONS Reprints and permissions ABOUT THIS ARTICLE CITE THIS ARTICLE Qian, J., Olbrecht, S., Boeckx, B. _et al._ A pan-cancer blueprint of the heterogeneous
tumor microenvironment revealed by single-cell profiling. _Cell Res_ 30, 745–762 (2020). https://doi.org/10.1038/s41422-020-0355-0 Download citation * Received: 09 October 2019 * Accepted:
05 May 2020 * Published: 19 June 2020 * Issue Date: September 2020 * DOI: https://doi.org/10.1038/s41422-020-0355-0 SHARE THIS ARTICLE Anyone you share the following link with will be able
to read this content: Get shareable link Sorry, a shareable link is not currently available for this article. Copy to clipboard Provided by the Springer Nature SharedIt content-sharing
initiative