- Select a language for the TTS:
- UK English Female
- UK English Male
- US English Female
- US English Male
- Australian Female
- Australian Male
- Language selected: (auto detect) - EN
Play all audios:
ABSTRACT Bipolar disorder (BD) and major depressive disorder (MDD) have both common and distinct clinical features, that pose both conceptual challenges in terms of their diagnostic
boundaries and practical difficulties in optimizing treatment. Multivariate machine learning techniques offer new avenues for exploring these boundaries based on clinical neuroanatomical
features. Brain structural data were obtained at 3 T from a sample of 90 patients with BD, 189 patients with MDD, and 162 healthy individuals. We applied sparse partial least squares
discriminant analysis (s-PLS-DA) to identify clinical and brain structural features that may discriminate between the two clinical groups, and heterogeneity through discriminative analysis
(HYDRA) to detect patient subgroups with reference to healthy individuals. Two clinical dimensions differentiated BD from MDD (area under the curve: 0.76, _P_ < 0.001); one dimension
emphasized disease severity as well as irritability, agitation, anxiety and flight of ideas and the other emphasized mostly elevated mood. Brain structural features could not distinguish
between the two disorders. HYDRA classified patients in two clusters that differed in global and regional cortical thickness, the distribution proportion of BD and MDD and positive family
history of psychiatric disorders. Clinical features remain the most reliable discriminant attributed of BD and MDD depression. The brain structural findings suggests that biological
partitions of patients with mood disorders are likely to lead to the identification of subgroups, that transcend current diagnostic divisions into BD and MDD and are more likely to be
aligned with underlying genetic variation. These results set the foundation for future studies to enhance our understanding of brain–behavior relationships in mood disorders. SIMILAR CONTENT
BEING VIEWED BY OTHERS STRUCTURAL BRAIN MEASURES LINKED TO CLINICAL PHENOTYPES IN MAJOR DEPRESSION REPLICATE ACROSS CLINICAL CENTRES Article 15 February 2021 NEUROANATOMICAL DIMENSIONS IN
MEDICATION-FREE INDIVIDUALS WITH MAJOR DEPRESSIVE DISORDER AND TREATMENT RESPONSE TO SSRI ANTIDEPRESSANT MEDICATIONS OR PLACEBO Article Open access 12 January 2024 IDENTIFYING MISDIAGNOSED
BIPOLAR DISORDER USING SUPPORT VECTOR MACHINE: FEATURE SELECTION BASED ON FMRI OF FOLLOW-UP CONFIRMED AFFECTIVE DISORDERS Article Open access 08 January 2024 INTRODUCTION Mood disorders,
primarily major depressive disorder (MDD) and bipolar disorder (BD), jointly affect up 20% of the population over their lifetime1 and rank amongst the most significant causes of disability
worldwide1. Both disorders present with recurrent depressive psychopathology while manic symptoms are the diagnostic hallmark of BD2. BD is further subdivided in two main subtypes; type I
(BD-I), characterized by episodes of mania, and type II (BD-II), that presents with hypomanic episodes2. Regardless of subtype, the course of BD is dominated by depressive symptoms3,4. In
about two-thirds of cases, BD begins with depression5 while the first manic episode does not emerge for another 5–9 years on average6. The significant symptomatic overlap between MDD and BD
across the entire course of these disorders and the dominance of depressive symptoms at the early stages of BD often delays the correct identification of BD cases7 with significant
implications for treatment decisions8, clinical outcomes9, and service use10. Accordingly, the differentiation of BD from MDD depression is an issue of ongoing research interest. Initial
investigations focused exclusively on the patients’ symptom profiles and found that concomitant depressive and manic symptoms, higher number of overall episodes and early age at the onset of
depression (<25 years) were more characteristic of BD than MDD11,12,13,14,15. The advent of neuroimaging offered the opportunity to examine whether brain measures could assist in
discriminating between MDD and BD depression. Direct comparisons using mass-univariate analyses identified a wide array of brain structural and functional differences but with marked
inter-study variability16,17. More recently the field has turned towards machine learning techniques which use multivariate algorithms to parse clinical samples into more biologically
homogeneous groups. The largest study to date applied a support vector machine to volumetric data from 596 depressed patients with MDD, 158 depressed patients with BD and 777 healthy
individuals recruited at four different sites18. The results were not reproducible across sites but the features the influenced intersite variation were not systematically examined.
Nevertheless, the volume of the middle, superior and inferior frontal gyrus emerged as the most promising discriminatory features in each site. Collectively the available evidence suggests
that differentiating MDD and BD depression using either clinical symptoms or brain structural data remains a challenge. In response, the aim of the current study was to test whether a
data-driven approach enhanced by the application of advanced multivariate methods may improve the discrimination of depressed patients with MDD or BD and the identification of the most
distinguishing features. To achieve this, we capitalized on a large sample of patients and healthy participants (total sample _n_ = 441) who were assessed and scanned at a single site.
First, we used sparse partial least squares discriminant analysis (s-PLS-DA)19 to test whether we could detect clinical or brain structural measures that could reliably differentiate the two
patient groups. This supervised machine learning method is an extension of the classic PLS; it enables categorical classification with a specific focus on feature selection20, and has been
used successfully in neuroimaging21. Second, we tested whether we could identify subgroups of patients in reference to healthy individuals based on brain structural data. We used
heterogeneity through discriminative analysis (HYDRA)22, a novel semi-supervised classifier that can detect multiple subgroups, if present, within the clinical sample, and then further
examine whether such brain-based clusters might differ in terms of clinical features. METHODS SAMPLE The pooled analysis sample comprised 90 patients with BD, 189 patients with MDD and 162
healthy individuals, all of Han Chinese origin (Table 1, Supplementary Table S1 and Supplementary Figs. S1, S2). All study procedures were undertaken at the Division of Mood Disorders,
Shanghai Mental Health Center (SMHC), Shanghai Jiao Tong University School of Medicine, China, and are described in detail in the Supplementary Material. Briefly, after providing written
informed consent, all participants, regardless of diagnosis, were screened to exclude medical and neurological comorbidity, substance and alcohol problem use and contraindications to MRI.
All patients fulfilled criteria for either MDD or BD as defined in the fourth edition of the Diagnostic and Statistical Manual of Mental Disorders (DSM-IV)23, while the healthy comparison
individuals had no personal or family history of psychiatric disorders. All patients were recruited for participation in two clinical trials (Clinical Trail Registry ID: NCT01938859 and
NCT01764867). However, all the data used here were acquired at enrollment and prior to study treatment initiation. Patients were required to meet the following criteria for a depressive
episode: (a) total score ≥17 in the 17-item Hamilton Depression Rating Scale (HAMD)24 and a score of ≥2 in the HAMD item for depressed mood and, (b) total score ≤10 in the Young Mania Rating
Scale (YMRS)25. Patients with rapid cycling, mixed affective episodes, other psychiatric comorbidity and patients who received electroconvulsive or other neuromodulation treatments were
excluded. CLINICAL ASSESSMENT The diagnostic assignment of patients was based on consensus by specialist psychiatrists according to the DSM-IV criteria for each mood disorder. In all
participants, information was collected on sociodemographic variables, psychopathology was rated with the 17-item-HAMD and the YMRS, an estimate of executive function was obtained using a
computerized version of the Wisconsin Card sorting test (WCST)26, and body mass index (BMI)27 was used as a global estimate of metabolic status. In patients only, further assessments were
undertaken using the Hamilton anxiety scale (HAMA)28, the global assessment of functioning (GAF)29 and the Sheehan disability scale (SDS)30. Information on age of onset, duration of illness,
number of episodes, and medication status was also collected. NEUROIMAGING In all participants, T1-weighted magnetic resonance imaging (MRI) data were acquired on the same Siemens Magnetom
Verio 3 T scanner (Erlangen, Germany) at the Radiological Department of the SMHC. Details of the data acquisition and processing are provided in the Supplement. Following preprocessing, the
gray matter was parcellated and segmented into distinct regions, using the FreeSurfer 6.0 software suite (http://surfer.nmr.mgh.harvard.edu/), yielding 68 cortical thickness measures, 16
subcortical volume measures and 16 hippocampal subfield volumes (Supplementary Table S2). STATISTICAL ANALYSES CONVENTIONAL GROUP COMPARISONS Conventional univariate analyses were undertaken
to compare patients to healthy individuals and conduct comparisons amongst the clinical subgroups in terms of clinical, cognitive, and brain structural data (Supplemental Material).
S-PLS-DA We chose s-PLS-DA to identify features discriminating between MDD and BD patients as this approach accommodates correlated variables while the penalty prevents overfitting and
enables robust feature selection19. We constructed two datasets, one comprising the brain structural variables (Supplementary Table S2) and another comprising sociodemographic measures (age,
sex, years of education, marital status), clinical course specifiers (number of episodes, illness duration, age at onset), medication use, family history, BMI, cognitive measures from the
WCST, and item scores from each clinical instrument (Table 1). Patients with BD were considered together regardless of subtype. The variables of each dataset were used as predictors while
the clinical diagnoses (i.e., MDD and BD) were modeled as outcomes. s-PLS-DA was implemented using the mixOmics package (version 6.8.0)31. The detailed code is available on the website
(https://github.com/AmirhosseinModabbernia/DepressionStudy). Each dataset was treated as a separate block, with the option for follow-up with multiblock analyses32. For each block, we
created an optimization sample (80% of the original) and a held-out sample (20% of the original) by random sampling. We tuned the s-PLS-DA parameters based on the classification error rate
with respect to the number of selected variables, for one component at a time, up to a maximum of 5. Optimization further involved cross validation (folds = 5) repeated ten times in the
optimization sample. Following optimization, the best model was identified by calculating the area under the receiver operating characteristic (AUROC) in the held-out sample. Statistical
significance was based on permutation, whereby we randomly permuted the optimization sample 10,000 times. For each permuted sample, we performed s-PLS-DA using the optimal parameters
identified in the original model and retested the weights identified in the permuted data on the held-out set. To test generalizability, we followed an established multi-holdout procedure33,
whereby we created ten randomly selected optimization/held-out samples using the 80/20 split and repeated the above analyses. Of the ten samples, the one yielding the lowest _P_-value in
the held-out set was chosen as the best model based on a Bonferroni corrected _P_ < 0.05. HYDRA This is a non-linear machine learning algorithm for integrated binary classification and
subpopulation clustering22. Key advantages of HYDRA, over other machine learning techniques, are that it disposes of the need for a priori specification of the number of clusters and does
not use similarity measures for clustering as such measures are susceptible to the effect of non-specific factors such as age and sex. The detailed code can be found on
https://github.com/evarol/HYDRA. Classification in HYDRA is based on indices of deviation between a clinical and the healthy reference group; healthy individuals are separated from the
clinical sample using a convex polytope formed by combining multiple linear hyperplanes. This confers an additional advantage to HYDRA because the multiple hyperplanes model potential
heterogeneity within clinical samples while their combination extends linear max-margin classifiers to the non-linear space. The regional cortical thickness measures and subcortical volumes
(Supplementary Table S2) of all patients and healthy individual and entered into the algorithm as input features and sex and age were modeled as covariates. The clinical diagnoses of MDD and
BD were not entered as variables to enable data-driven classification independent of clinical categorization; therefore the patients’ data were considered together without reference to
diagnostic labels. We used 5-fold cross validation to determine the clustering stability for a cluster range of 2–5. The resultant clustering solutions were evaluated using the adjusted Rand
index (ARI), adjusted for the chance grouping of elements; the solution with the highest ARI was chosen. The generalizability of the clustering solutions was tested through permutation
(Supplementary Material). Subgroups identified as above were compared in terms of their demographics, clinical, and cognitive characteristics. RESULTS SAMPLE CHARACTERISTICS Patients with BD
were marginally younger and had fewer years of education compared to healthy individuals; regardless of diagnosis, a higher number of patients were unemployed (Table 1). Clinical
differences between MDD and BD groups were noted in the total YMRS and GAF scores, age of onset and illness duration and total number of episodes (Table 1). Regardless of diagnosis, patients
underperformed in the WCST compared to healthy individuals in terms of percentage of perseverative responses, percentage of total errors, percentage of conceptual level responses, number of
categories completed, and total number required for completing the first category (Supplementary Table S3). Of the 90 patients with BD, 31 had BD-Type I (BD-I) and 59 had BD-Type II
(BD-II). Compared to patients with BD-II, patients with BD-I had higher HAMD and HAMA total scores (Supplementary Table S4). No differences were noted between bipolar subtypes in cognitive
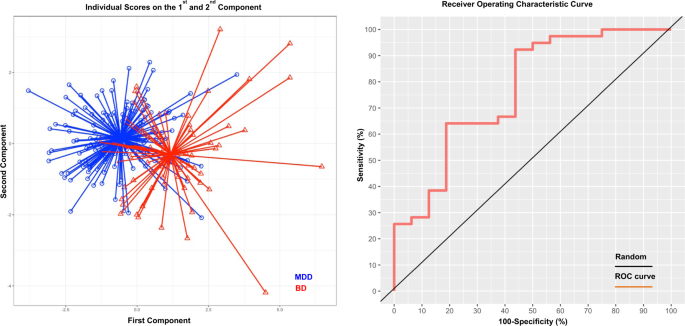
characteristics (Supplementary Table S5). DIFFERENTIATING BETWEEN MDD AND BD WITH S-PLS-DA The s-PLS-DA differentiated between MDD and BD based on clinical (AUROC = 0.76, _P_ = 0.001) but
not brain structural features (AUROC = 0.63, _P_ = 0.47). (Fig. 1 and Supplementary Fig. S3A, B) and identified two components that distinguished between BD and MDD (Fig. 1). The loading
weights of each feature in each component are shown in Supplementary Table S6. In the first component, the highest loadings were observed for measures of disease severity/chronicity (i.e.,
age of onset, total number of episodes, and illness duration), and for clinical symptoms of irritability/aggression, increased activity/energy, flight of ideas, and psychic and somatic
anxiety. In the second component, the highest loading concerned elevated mood and somatic symptoms of anxiety. Age, sex, and medication status had zero or minimal loadings in both
components. NEUROANATOMICAL CLUSTERING OF PATIENTS WITH HYDRA Cluster stability in HYDRA showed a significant peak in ARI values favoring the 2-cluster solution (Fig. 2). Cluster 1 comprised
151 patients, of whom 93 (61.6%) had a diagnosis of MDD, 17 (11.3%) had a diagnosis of BD-I and 41 (27.1%) had a diagnosis of BD-II. Cluster 2 comprised 128 patients, of whom 96 (75%) had a
diagnosis of MDD, 14 (10.9%) had a diagnosis of BD-I and 18 (14.1%) had a diagnosis of BD-II. A nearly equal proportion of patients with BD-I were assigned to each cluster. However, there
were more patients with BD-II and less patients with MDD in cluster 1 than those in cluster 2 (_χ_2 = 7.46, df = 2, _P_ = 0.024). Details of the cluster comparisons in demographic and
clinical features are presented in Supplementary Table S7. Notably, there were no differences in age, sex, age of onset, illness duration, and medication status (all _P_ > 0.20). The only
clinical feature that was statistically significant different between the two clusters was the percentage of patients with positive family history for psychiatric disorders, which was
higher in cluster 1 than that cluster 2 (_P_FDR = 0.03). Additionally, cluster 1 had lower cortical thickness globally (right _P_ = 8.33E−43, left _P_ = 8.84E−46) and in all cortical regions
(range of _P_-values: 6.07E−30 to 6.03E−05) (Fig. 2B and Supplementary Fig. S4) although less pronounced along the cingulate cortex (Fig. 2). No significant differences were noted for
subcortical volumes (range of _P_-values: 0.009 to 0.81). GROUP-LEVEL ANALYSES OF BRAIN STRUCTURAL DATA Conventional group-level analyses comparing patients with MDD or BD to healthy
individuals identified widespread differences in cortical thickness but not in subcortical volumes (Supplemental Material and Supplementary Figs. S5–S7). Patients with BD had reduced
cortical thickness in the left caudal middle frontal gyrus and the left pars opercularis compared to patients with MDD (_P_FDR < 0.05). All other pairwise comparisons did not yield
significant results (Supplemental Material). In univariate correlation analyses, only the SDS-study score was negatively correlated with the cortical thickness of the left temporal pole in
patients with BD (Supplementary Fig. S8). DISCUSSION We applied multivariate methods to clinical and brain structural data from depressed patients with BD or MDD. The results showed that the
two disorders in our study could be distinguished from each other with moderate accuracy based on clinical features but not brain structure. Clustering patients using healthy individuals as
a “normative” reference identified two clusters that crossed diagnostic boundaries, and highlighted cortical thickness as a brain structural feature most likely to differentiate patients
irrespective of symptoms. Consistent with prior studies11,12,13,14,15, we confirmed the value of clinical features in discriminating between MDD and BD. The performance of the discriminant
analysis presented here is comparable to that of Inoue et al.14 and Leopacher et al.15, who used conceptually similar analyses to ours on Japanese and US samples, and reported AUC ranging
between 0.74 and 0.84. Data-driven feature selection implemented in s-PLS-DA identified of two clinical dimensions (i.e., components) underpinning the differentiation of the two disorders.
The main dimension (component 1), included clinical features indicative of irritability, agitation, anxiety, and flight of ideas. The second component involved elevated mood and physical
symptoms of anxiety. The irritability/agitation dimension, in the context of a depressive episode, dates back to the concept of “agitated depression”, first proposed by Weygandt34, as the
combination of depressed mood, psychomotor agitation, and flight of ideas. The concept was revived and revised as “anxious agitated depression”35, while further research has focused on
whether or not elevated mood should be considered part of “agitated depression” or assigned to a new construct of “mixed states”36,37. The present results suggest that
irritability/agitation/anxiety dimension is the most discrepant dimension between BD and MDD depression and that mood elevation is a secondary and separate dimension. To some extent, these
findings align with genetic findings indicating the mood elevation may have distinct genetic underpinnings from depression, either in the context of BD or MDD38,39. Brain structural data did
not differentiate patients with BD from patients with MDD either when using s-PLS-DA or conventional group-level analyses. These findings are aligned with a recent meta-analysis of
group-level comparisons of BD and MDD which found evidence of a continuum of brain structural abnormalities, with deficits being generally more pronounced in BD than MDD, with the exception
of the cingulate cortical regions that seen similarly affected in both disorders40. A similar pattern emerges from multivariate comparisons of BD to MDD; although initial small studies
appeared promising41, the largest and most reliable study to date by Matsuo et al.18 showed that such results are unlikely to generalize. By contrast, each diagnostic group showed
significant differences when compared to healthy individuals both in group-level and multivariate analyses. The group-level analyses largely recapitulate the findings of the large studies
conducted by the BD and MDD working groups of the Enhancing Neuroimaging Genetics through Meta-Analysis (ENIGMA) Consortium41,42,43,44,45. We identified two patient clusters using
heterogeneity through HYDRA, a semi-supervised machine learning algorithm that classifies patients in reference to healthy individuals. The two clusters transcended diagnostic boundaries and
did not differ in demographic, clinical and cognitive features. However, cluster 1 differed from cluster 2, as it was associated with lower global and regional cortical thickness, the
distribution of BD and MDD and higher positive family history for psychiatric disorders. These findings align with previous studies showing associations between brain structure in mood
disorders and specific polymorphisms46,47, and a more recent large-scale study on in 51,665 individuals which showed that cortical thickness is influenced by multiple genetic polymorphisms
some of which overlap with genetic risk loci for mood disorders48. Several limitations of the current study should be noted. First, the cross-sectional nature of the available data precludes
examination of the developmental trajectories of brain structural differences between patients and controls. Second, despite the careful assessment of the patients participating in this
study, there is always a possibility that some MDD patients may present with manic or hypomanic episodes as a future date. Third, evidence from us49 and others50 suggests that brain
structure can be influenced by multiple environmental factors, primarily quality of family life and exposure to significant psychosocial adversity; differential exposure of individuals in
the current sample to such influences may account to the clusters identified. Fourth, the addition of genetic information to clustering models in future studies may lead to more fine-grained
partitions of the clinical groups. Fifth, assessment of cognition in this sample was limited to a single test of abstraction and cognitive flexibility, thus precluding a more detailed
examination of other cognitive features that may be closely related to structural changes. Sixth, patients in the current study were recruited for randomized clinical trials and cannot be
considered representative of MDD and BD. Thus, the reproducibility of the findings reported here will require independent replication in larger and epidemiologically derived samples.
Seventh, the current study focused exclusively on brain morphometry because brain structural data have the highest translational potential. It is possible that the inclusion of data from
other modalities could lead to a different or a more refined partition of the clinical sample and this is worth pursuing in future studies. In conclusion, our study provides support for the
notion that agitated and mixed states being more characteristic of BD depression. The brain structural findings suggests that biological partitions of patients with mood disorders are likely
to lead to the identification of subgroups, that transcend current diagnostic divisions into BD and MDD and are more likely to be aligned with underlying genetic variation. REFERENCES *
GBD. Global, regional, and national incidence, prevalence, and years lived with disability for 354 diseases and injuries for 195 countries and territories, 1990-2017: a systematic analysis
for the Global Burden of Disease Study 2017. _Lancet_ 392, 1789–1858 (2018). Article Google Scholar * American Psychiatric Association. _Diagnostic and Statistical Manual of Mental
Disorders (DSM-5) 5th edn_ (APA, Arlington, VA, 2013). * Judd, L. L. et al. The long-term natural history of the weekly symptomatic status of bipolar I disorder. _Arch. Gen. Psychiatry_ 59,
530–537 (2002). Article PubMed Google Scholar * Judd, L. L. et al. A prospective investigation of the natural history of the long-term weekly symptomatic status of bipolar II disorder.
_Arch. Gen. Psychiatry_ 60, 261–269 (2003). Article PubMed Google Scholar * Daban, C., Colom, F., Sanchez-Moreno, J., Garcia-Amador, M. & Vieta, E. Clinical correlates of
first-episode polarity in bipolar disorder. _Compr. Psychiatry_ 47, 433–437 (2006). Article PubMed Google Scholar * Akiskal, H. S. et al. Switching from ‘unipolar’ to bipolar II. An
11-year prospective study of clinical and temperamental predictors in 559 patients. _Arch. Gen. Psychiatry_ 52, 114–123 (1995). Article CAS PubMed Google Scholar * Howes, O. D. et al. A
comprehensive review and model of putative prodromal features of bipolar affective disorder. _Psychol. Med._ 41, 1567–1577 (2011). Article CAS PubMed Google Scholar * Yatham, L. N. et
al. Canadian network for mood and anxiety treatments (CANMAT) and International Society for bipolar disorders (ISBD) 2018 guidelines for the management of patients with bipolar disorder.
_Bipol. Disord._ 20, 97–170 (2018). Article Google Scholar * Ghaemi, S. N., Boiman, E. E. & Goodwin, F. K. Diagnosing bipolar disorder and the effect of antidepressants: a naturalistic
study. _J. Clin. Psychiatry_ 61, 804–808 (2000). Article CAS PubMed Google Scholar * Li, J., McCombs, J. S. & Stimmel, G. L. Cost of treating bipolar disorder in the California
Medicaid (Medi-Cal) program. _J. Affect. Disord._ 71, 131–139 (2002). Article PubMed Google Scholar * Perlis, R. H., Brown, E., Baker, R. W. & Nierenberg, A. A. Clinical features of
bipolar depression versus major depressive disorder in large multicenter trials. _Am. J. Psychiatry_ 163, 225–231 (2006). Article PubMed Google Scholar * Fiedorowicz, J. G. et al.
Subthreshold hypomanic symptoms in progression from unipolar major depression to bipolar disorder. _Am. J. Psychiatry_ 168, 40–48 (2011). Article PubMed Google Scholar * Xiang, Y. T. et
al. Sociodemographic and clinical features of bipolar disorder patients misdiagnosed with major depressive disorder in China. _Bipol. Disord._ 15, 199–205 (2013). Article Google Scholar *
Inoue, T., Inagaki, Y., Kimura, T. & Shirakawa, O. Prevalence and predictors of bipolar disorders in patients with a major depressive episode: the Japanese epidemiological trial with
latest measure of bipolar disorder (JET-LMBP). _J. Affect. Disord._ 174, 535–541 (2015). Article PubMed Google Scholar * Leonpacher, A. K. et al. Distinguishing bipolar from unipolar
depression: the importance of clinical symptoms and illness features. _Psychol. Med._ 45, 2437–2446 (2015). Article CAS PubMed PubMed Central Google Scholar * Cardoso de Almeida, J. R.
& Phillips, M. L. Distinguishing between unipolar depression and bipolar depression: current and future clinical and neuroimaging perspectives. _Biol. Psychiatry_ 73, 111–118 (2013).
Article PubMed Google Scholar * Han, K. M., De Berardis, D., Fornaro, M. & Kim, Y. K. Differentiating between bipolar and unipolar depression in functional and structural MRI studies.
_Prog. Neuropsychopharmacol. Biol. Psychiatry_ 91, 20–27 (2019). Article PubMed Google Scholar * Matsuo, K. et al. Distinctive neuroanatomical substrates for depression in bipolar
disorder versus major depressive disorder. _Cereb. Cortex_ 29, 202–214 (2019). Article PubMed Google Scholar * Cao, K. A., Boitard, S. & Besse, P. Sparse PLS discriminant analysis:
biologically relevant feature selection and graphical displays for multiclass problems. _BMC Bioinform._ 12, 253 (2011). Article Google Scholar * Tan, Y., Shi, L., Tong, W., Hwang, G. T.
& Wang, C. Multi-class tumor classification by discriminant partial least squares using microarray gene expression data and assessment of classification models. _Comput. Biol. Chem._ 28,
235–244 (2004). Article CAS PubMed Google Scholar * Krishnan, A., Williams, L. J., McIntosh, A. R. & Abdi, H. Partial Least Squares (PLS) methods for neuroimaging: a tutorial and
review. _Neuroimage_ 56, 455–475 (2011). Article PubMed Google Scholar * Varol, E., Sotiras, A. & Davatzikos, C. Alzheimer’s Disease Neuroimaging Initiative. HYDRA: revealing
heterogeneity of imaging and genetic patterns through a multiple max-margin discriminative analysis framework. _Neuroimage_ 145, 346–364 (2017). Article PubMed Google Scholar * American
Psychiatric Association. _Diagnostic and Statistical Manual of Mental Disorders_ 4th edn (APA, Washington, DC, 2000). * Zheng, Y. P. et al. Validity and reliability of the Chinese Hamilton
Depression Rating Scale. _Br. J. Psychiatry_ 152, 660–664 (1988). Article CAS PubMed Google Scholar * Young, R. C., Biggs, J. T., Ziegler, V. E. & Meyer, D. A. A rating scale for
mania: reliability, validity and sensitivity. _Br. J. Psychiatry_ 133, 429–435 (1978). Article CAS PubMed Google Scholar * Bryan, J. & Luszcz, M. A. Measurement of executive
function: considerations for detecting adult age differences. _J. Clin. Exp. Neuropsychol._ 22, 40–55 (2000). Article CAS PubMed Google Scholar * Aune, D. et al. BMI and all cause
mortality: systematic review and non-linear dose-response meta-analysis of 230 cohort studies with 3.74 million deaths among 30.3 million participants. _BMJ_ 353, i2156 (2016). Article
PubMed PubMed Central Google Scholar * Hamilton, M. The assessment of anxiety states by rating. _Br. J. Med. Psychol._ 32, 50–55 (1959). Article CAS PubMed Google Scholar * Jones, S.
H., Thornicroft, G., Coffey, M. & Dunn, G. A brief mental health outcome scale-reliability and validity of the Global Assessment of Functioning (GAF). _Br. J. Psychiatry_ 166, 654–659
(1995). Article CAS PubMed Google Scholar * Leu, S. H. et al. Validity and reliability of the Chinese version of the Sheehan Disability Scale (SDS-C). _Asia Pac. Psychiatry_ 7, 215–222
(2015). Article PubMed Google Scholar * Rohart, F., Gautier, B., Singh, A. & Le Cao, K. A. mixOmics: An R package for ‘omics feature selection and multiple data integration. _PLoS
Comput. Biol._ 13, e1005752 (2017). Article PubMed PubMed Central CAS Google Scholar * Singh, A. et al. DIABLO: an integrative approach for identifying key molecular drivers from
multi-omics assays. _Bioinformatics_ 35, 3055–3062 (2019). Article CAS PubMed PubMed Central Google Scholar * Mihalik, A. et al. Multiple holdouts with stability: improving the
generalizability of machine learning analyses of brain-behavior relationships. _Biol. Psychiatry_ 87, 368–376 (2020). Article PubMed PubMed Central Google Scholar * Weygandt, W. _Über
die Mischzustände des manisch-depressiven Irreseins_ (J.F. Lehmann, Munich, 1899). * Koukopoulos, A. & Koukopoulos, A. Agitated depression as a mixed state and the problem of
melancholia. _Psychiatr. Clin. N. Am._ 22, 547–564 (1999). Article CAS Google Scholar * Schatzberg, A. F. & DeBattista, C. Phenomenology and treatment of agitation. _J. Clin.
Psychiatry_ 60, 17–20 (1999). PubMed Google Scholar * Perugi, G., Akiskal, H. S., Micheli, C., Toni, C. & Madaro, D. Clinical characterization of depressive mixed state in bipolar-I
patients: Pisa-San Diego collaboration. _J. Affect. Disord._ 67, 105–114 (2001). Article CAS PubMed Google Scholar * Charney, A. W. et al. Evidence for genetic heterogeneity between
clinical subtypes of bipolar disorder. _Transl. Psychiatry_ 7, e993 (2017). Article CAS PubMed PubMed Central Google Scholar * Coleman, J. R. I. et al. The genetics of the mood disorder
spectrum: genome-wide association analyses of more than 185,000 cases and 439,000 controls. _Biol. Psychiatry_ 88, 169–184 (2020). Article CAS PubMed Google Scholar * Wise, T. et al.
Common and distinct patterns of grey-matter volume alteration in major depression and bipolar disorder: evidence from voxel-based meta-analysis. _Mol. Psychiatry_ 22, 1455–1463 (2017).
Article CAS PubMed Google Scholar * Claude, L. A., Houenou, J., Duchesnay, E. & Favre, P. Will machine learning applied to neuroimaging in bipolar disorder help the clinician? A
critical review and methodological suggestions. _Bipol. Disord._ 22, 334–355 (2020). Article Google Scholar * Hibar, D. P. et al. Subcortical volumetric abnormalities in bipolar disorder.
_Mol. Psychiatry_ 21, 1710–1716 (2016). Article CAS PubMed PubMed Central Google Scholar * Hibar, D. P. et al. Cortical abnormalities in bipolar disorder: an MRI analysis of 6503
individuals from the ENIGMA Bipolar Disorder Working Group. _Mol. Psychiatry_ 23, 932–942 (2018). Article CAS PubMed Google Scholar * Schmaal, L. et al. Subcortical brain alterations in
major depressive disorder: findings from the ENIGMA Major Depressive Disorder working group. _Mol. Psychiatry_ 21, 806–812 (2016). Article CAS PubMed Google Scholar * Schmaal, L. et al.
Cortical abnormalities in adults and adolescents with major depression based on brain scans from 20 cohorts worldwide in the ENIGMA Major Depressive Disorder Working Group. _Mol. Psychiatry_
22, 900–909 (2017). Article CAS PubMed Google Scholar * Zhou, R. et al. Effects of tumor necrosis factor-alpha polymorphism on the brain structural changes of the patients with major
depressive disorder. _Transl. Psychiatry_ 8, 217 (2018). Article PubMed PubMed Central CAS Google Scholar * Pereira, L. P. et al. The relationship between genetic risk variants with
brain structure and function in bipolar disorder: a systematic review of genetic-neuroimaging studies. _Neurosci. Biobehav Rev._ 79, 87–109 (2017). Article PubMed Google Scholar * Grasby,
K. L. et al. The genetic architecture of the human cerebral cortex. _Science_ 367, eaay6690 (2020). Article CAS PubMed PubMed Central Google Scholar * Modabbernia, A. et al. Linked
patterns of biological and environmental covariation with brain structure in adolescence: a population-based longitudinal study. _Mol. Psychiatry._ https://doi.org/10.1038/s41380-020-0757-x
(2020). * Tozzi, L. et al. Interactive impact of childhood maltreatment, depression, and age on cortical brain structure: mega-analytic findings from a large multi-site cohort. _Psychol.
Med._ 50, 1020–1031 (2020). Article PubMed Google Scholar Download references ACKNOWLEDGEMENTS This work was supported by the National Key R&D Program of China (2016YFC1307100), the
National Natural Science Foundation of China (81761128032, 81930033, 81771465, 91232719, 81201056, and 81301159), the “12th Five-year Plan” of National Key Technologies R&D program
(2012BAI01B04), Shanghai Key Project of Science and Technology (2018SHZDZX05), Science and Technology Program of Guangdong (2018B030334001), and also supported by the Innovative Research
Team of High-level Local Universities in Shanghai. Y.T. is supported by the China Scholarship Council (201906230123). AUTHOR INFORMATION AUTHORS AND AFFILIATIONS * Clinical Research Center
& Division of Mood Disorders, Shanghai Mental Health Center, Shanghai Jiao Tong University School of Medicine, Shanghai, China Tao Yang, Jia Huang, Yousong Su, Ruizhi Mao, Rubai Zhou,
Xiao Lin, Xing Wang, Yun Wang, Daihui Peng, Jun Chen & Yiru Fang * Department of Psychiatry, University of British Columbia, Vancouver, Canada Tao Yang, Sophia Frangou, Raymond W. Lam
& Lakshmi N. Yatham * Department of Psychiatry, Icahn School of Medicine at Mount Sinai, New York, USA Sophia Frangou * Department of Psychology, Provincial Hospital Affiliated to
Shandong University, Jinan, China Guoqing Zhao * Shanghai Pudong New District Mental Health Center, Shanghai, China Na Zhu * Department of Medical Psychology, Xinhua Hospital, Shanghai Jiao
Tong University School of Medicine, Shanghai, China Weiping Xia * Division of Mood Disorders, Shanghai Hongkou District Mental Health Center, Shanghai, China Zuowei Wang * CAS Center for
Excellence in Brain Science and Intelligence Technology, Shanghai, China Yiru Fang * Shanghai Key Laboratory of Psychotic Disorders, Shanghai, China Yiru Fang Authors * Tao Yang View author
publications You can also search for this author inPubMed Google Scholar * Sophia Frangou View author publications You can also search for this author inPubMed Google Scholar * Raymond W.
Lam View author publications You can also search for this author inPubMed Google Scholar * Jia Huang View author publications You can also search for this author inPubMed Google Scholar *
Yousong Su View author publications You can also search for this author inPubMed Google Scholar * Guoqing Zhao View author publications You can also search for this author inPubMed Google
Scholar * Ruizhi Mao View author publications You can also search for this author inPubMed Google Scholar * Na Zhu View author publications You can also search for this author inPubMed
Google Scholar * Rubai Zhou View author publications You can also search for this author inPubMed Google Scholar * Xiao Lin View author publications You can also search for this author
inPubMed Google Scholar * Weiping Xia View author publications You can also search for this author inPubMed Google Scholar * Xing Wang View author publications You can also search for this
author inPubMed Google Scholar * Yun Wang View author publications You can also search for this author inPubMed Google Scholar * Daihui Peng View author publications You can also search for
this author inPubMed Google Scholar * Zuowei Wang View author publications You can also search for this author inPubMed Google Scholar * Lakshmi N. Yatham View author publications You can
also search for this author inPubMed Google Scholar * Jun Chen View author publications You can also search for this author inPubMed Google Scholar * Yiru Fang View author publications You
can also search for this author inPubMed Google Scholar CORRESPONDING AUTHORS Correspondence to Jun Chen or Yiru Fang. ETHICS DECLARATIONS CONFLICT OF INTEREST The authors declare that they
have no conflict of interest. ADDITIONAL INFORMATION PUBLISHER’S NOTE Springer Nature remains neutral with regard to jurisdictional claims in published maps and institutional affiliations.
SUPPLEMENTARY INFORMATION SUPPLEMENTAL MATERIAL RIGHTS AND PERMISSIONS OPEN ACCESS This article is licensed under a Creative Commons Attribution 4.0 International License, which permits use,
sharing, adaptation, distribution and reproduction in any medium or format, as long as you give appropriate credit to the original author(s) and the source, provide a link to the Creative
Commons license, and indicate if changes were made. The images or other third party material in this article are included in the article’s Creative Commons license, unless indicated
otherwise in a credit line to the material. If material is not included in the article’s Creative Commons license and your intended use is not permitted by statutory regulation or exceeds
the permitted use, you will need to obtain permission directly from the copyright holder. To view a copy of this license, visit http://creativecommons.org/licenses/by/4.0/. Reprints and
permissions ABOUT THIS ARTICLE CITE THIS ARTICLE Yang, T., Frangou, S., Lam, R.W. _et al._ Probing the clinical and brain structural boundaries of bipolar and major depressive disorder.
_Transl Psychiatry_ 11, 48 (2021). https://doi.org/10.1038/s41398-020-01169-7 Download citation * Received: 11 November 2020 * Revised: 07 December 2020 * Accepted: 11 December 2020 *
Published: 14 January 2021 * DOI: https://doi.org/10.1038/s41398-020-01169-7 SHARE THIS ARTICLE Anyone you share the following link with will be able to read this content: Get shareable link
Sorry, a shareable link is not currently available for this article. Copy to clipboard Provided by the Springer Nature SharedIt content-sharing initiative