- Select a language for the TTS:
- UK English Female
- UK English Male
- US English Female
- US English Male
- Australian Female
- Australian Male
- Language selected: (auto detect) - EN
Play all audios:
ABSTRACT Epigenetic modifications such as carbon 5 methylation of the cytosine base in a CpG dinucleotide context are involved in the onset and progression of human diseases. A comprehensive
understanding of the role of genome-wide DNA methylation patterns, the methylome, requires quantitative determination of the methylation states of all CpG sites in a genome. So far,
analyses of the complete methylome by whole-genome bisulfite sequencing (WGBS) are rare because of the required large DNA quantities, substantial bioinformatic resources and high sequencing
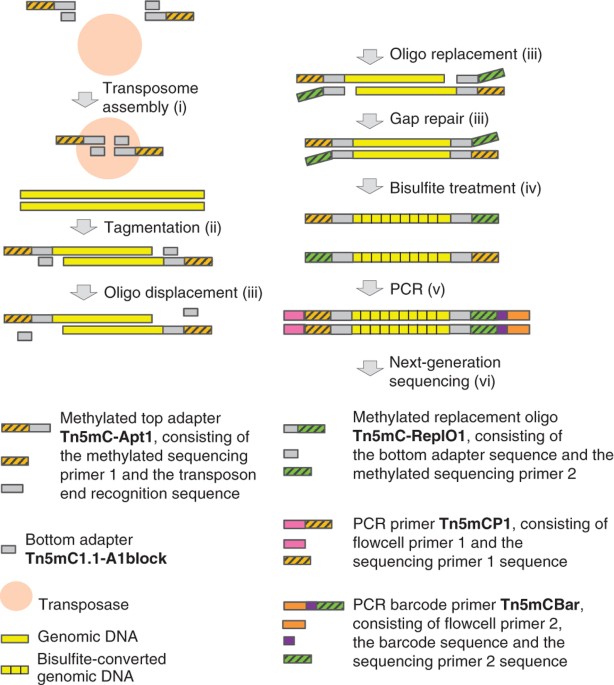
costs. Here we describe a detailed protocol for tagmentation-based WGBS (T-WGBS) and demonstrate its reliability in comparison with conventional WGBS. In T-WGBS, a hyperactive Tn_5_
transposase fragments the DNA and appends sequencing adapters in a single step. T-WGBS requires not more than 20 ng of input DNA; hence, the protocol allows the comprehensive methylome
analysis of limited amounts of DNA isolated from precious biological specimens. The T-WGBS library preparation takes 2 d. Access through your institution Buy or subscribe This is a preview
of subscription content, access via your institution ACCESS OPTIONS Access through your institution Subscribe to this journal Receive 12 print issues and online access $259.00 per year only
$21.58 per issue Learn more Buy this article * Purchase on SpringerLink * Instant access to full article PDF Buy now Prices may be subject to local taxes which are calculated during checkout
ADDITIONAL ACCESS OPTIONS: * Log in * Learn about institutional subscriptions * Read our FAQs * Contact customer support SIMILAR CONTENT BEING VIEWED BY OTHERS ANCHOR-BASED BISULFITE
SEQUENCING DETERMINES GENOME-WIDE DNA METHYLATION Article Open access 16 June 2022 COMPARISON AND IMPUTATION-AIDED INTEGRATION OF FIVE COMMERCIAL PLATFORMS FOR TARGETED DNA METHYLOME
ANALYSIS Article 02 June 2022 SMART-RRBS FOR SINGLE-CELL METHYLOME AND TRANSCRIPTOME ANALYSIS Article 09 July 2021 REFERENCES * Lister, R. et al. Human DNA methylomes at base resolution show
widespread epigenomic differences. _Nature_ 462, 315–322 (2009). Article CAS Google Scholar * Kobayashi, H. et al. Contribution of intragenic DNA methylation in mouse gametic DNA
methylomes to establish oocyte-specific heritable marks. _PLoS Genet._ 8, e1002440 (2012). Article CAS Google Scholar * Popp, C. et al. Genome-wide erasure of DNA methylation in mouse
primordial germ cells is affected by AID deficiency. _Nature_ 463, 1101–1105 (2010). Article CAS Google Scholar * Seisenberger, S. et al. The dynamics of genome-wide DNA methylation
reprogramming in mouse primordial germ cells. _Mol. Cell_ 48, 849–862 (2012). Article CAS Google Scholar * Gu, H. et al. Preparation of reduced representation bisulfite sequencing
libraries for genome-scale DNA methylation profiling. _Nat. Protoc._ 6, 468–481 (2011). Article CAS Google Scholar * Khulan, B. et al. Comparative isoschizomer profiling of cytosine
methylation: the HELP assay. _Genome Res._ 16, 1046–1055 (2006). Article CAS Google Scholar * Meissner, A. et al. Reduced representation bisulfite sequencing for comparative
high-resolution DNA methylation analysis. _Nucleic Acids Res._ 33, 5868–5877 (2005). Article CAS Google Scholar * Oda, M. et al. High-resolution genome-wide cytosine methylation profiling
with simultaneous copy number analysis and optimization for limited cell numbers. _Nucleic Acids Res._ 37, 3829–3839 (2009). Article CAS Google Scholar * Miura, F., Enomoto, Y., Dairiki,
R. & Ito, T. Amplification-free whole-genome bisulfite sequencing by post-bisulfite adaptor tagging. _Nucleic Acids Res._ 40, e136 (2012). Article CAS Google Scholar * Adey, A. &
Shendure, J. Ultra-low-input, tagmentation-based whole-genome bisulfite sequencing. _Genome Res._ 22, 1139–1143 (2012). Article CAS Google Scholar * Adey, A. et al. Rapid, low-input,
low-bias construction of shotgun fragment libraries by high-density _in vitro_ transposition. _Genome Biol._ 11, R119 (2010). Article CAS Google Scholar * Quail, M.A. et al. A large
genome center's improvements to the Illumina sequencing system. _Nat. Methods_ 5, 1005–1010 (2008). Article CAS Google Scholar * Weber, M. et al. Chromosome-wide and
promoter-specific analyses identify sites of differential DNA methylation in normal and transformed human cells. _Nat. Genet._ 37, 853–862 (2005). Article CAS Google Scholar * Taiwo, O.
et al. Methylome analysis using MeDIP-seq with low DNA concentrations. _Nat. Protoc._ 7, 617–636 (2012). Article CAS Google Scholar * Brinkman, A.B. et al. Whole-genome DNA methylation
profiling using MethylCap-seq. _Methods_ 52, 232–236 (2010). Article CAS Google Scholar * Gebhard, C. et al. Genome-wide profiling of CpG methylation identifies novel targets of aberrant
hypermethylation in myeloid leukemia. _Cancer Res._ 66, 6118–6128 (2006). Article CAS Google Scholar * Bock, C. et al. Quantitative comparison of genome-wide DNA methylation mapping
technologies. _Nat. Biotechnol._ 28, 1106–1114 (2010). Article CAS Google Scholar * Harris, R.A. et al. Comparison of sequencing-based methods to profile DNA methylation and
identification of monoallelic epigenetic modifications. _Nat. Biotechnol._ 28, 1097–1105 (2010). Article CAS Google Scholar * Hovestadt, V. et al. Robust molecular subgrouping and
copy-number profiling of medulloblastoma from small amounts of archival tumour material using high-density DNA methylation arrays. _Acta Neuropathol._ 125, 913–916 (2013). Article Google
Scholar * Sturm, D. et al. Hotspot mutations in H3F3A and IDH1 define distinct epigenetic and biological subgroups of glioblastoma. _Cancer Cell_ 22, 425–437 (2012). Article CAS Google
Scholar * Grunenwald, H.L, Caruccio, N., Jendrisak, J. & Dahl, G. Transposon end compositions and methods for modifying nucleic acids. US patent 20100120098A1 (2010). * Hansen, K.D.,
Langmead, B. & Irizarry, R.A. BSmooth: from whole genome bisulfite sequencing reads to differentially methylated regions. _Genome Biol._ 13, R83 (2012). Article Google Scholar Download
references ACKNOWLEDGEMENTS We gratefully acknowledge excellent technical support by M. Helf and helpful discussions with D. Lipka. We also acknowledge the excellent support by the
sequencing core facility at DKFZ. Work in the Plass laboratory was supported by the Helmholtz Foundation and the German Federal Ministry of Education and Science in the program for medical
genome research (FKZ; no. 01KU1001A). Q.W. obtained support by the Humboldt Research Fellowship for Postdoctoral Researchers. A.A. is funded by a National Science Foundation Graduate
Research Fellowship. AUTHOR INFORMATION Author notes * Qi Wang and Lei Gu: These authors contributed equally to this work. AUTHORS AND AFFILIATIONS * Theoretical Bioinformatics, German
Cancer Research Center (DKFZ), Heidelberg, Germany Qi Wang, Lei Gu & Roland Eils * Division of Epigenomics and Cancer Risk Factors, DKFZ, Heidelberg, Germany Lei Gu, Marion Bähr,
Christoph Plass & Dieter Weichenhan * Department of Genome Sciences, University of Washington, Seattle, Washington, USA., Andrew Adey & Jay Shendure * Division of Molecular Genetics,
DKFZ, Heidelberg, Germany Bernhard Radlwimmer, Wei Wang & Volker Hovestadt * Core Facility, High-Throughput Sequencing, DKFZ, Heidelberg, Germany Stephan Wolf Authors * Qi Wang View
author publications You can also search for this author inPubMed Google Scholar * Lei Gu View author publications You can also search for this author inPubMed Google Scholar * Andrew Adey
View author publications You can also search for this author inPubMed Google Scholar * Bernhard Radlwimmer View author publications You can also search for this author inPubMed Google
Scholar * Wei Wang View author publications You can also search for this author inPubMed Google Scholar * Volker Hovestadt View author publications You can also search for this author
inPubMed Google Scholar * Marion Bähr View author publications You can also search for this author inPubMed Google Scholar * Stephan Wolf View author publications You can also search for
this author inPubMed Google Scholar * Jay Shendure View author publications You can also search for this author inPubMed Google Scholar * Roland Eils View author publications You can also
search for this author inPubMed Google Scholar * Christoph Plass View author publications You can also search for this author inPubMed Google Scholar * Dieter Weichenhan View author
publications You can also search for this author inPubMed Google Scholar CONTRIBUTIONS A.A., J.S. and D.W. conceived the study. B.R., W.W. and V.H. contributed data. B.R., R.E. and C.P.
contributed materials. W.W., M.B., S.W. and D.W. performed the experiments and analyzed data. Q.W., L.G. and V.H. performed the bioinformatic analysis. Q.W., L.G. and D.W. wrote the
manuscript. CORRESPONDING AUTHOR Correspondence to Dieter Weichenhan. ETHICS DECLARATIONS COMPETING INTERESTS A provisional US patent application has been deposited for aspects of these
methods (A.A., J.S.). INTEGRATED SUPPLEMENTARY INFORMATION SUPPLEMENTARY FIGURE 1 CONTROL OF SIZE DISTRIBUTION OF THREE DNA SAMPLES AFTER TAGMENTATION. (A) Prior to oligo replacement/gap
repair, the DNA has a size range of about 700–10,000 bp. The non-tagmented DNA (not shown) was ≥ 20 kb in size. (B) Three sequencing libraries prepared from the DNA shown in a without
bisulfite treatment. FU, fluorescence units. SUPPLEMENTARY FIGURE 2 PCR AMPLIFICATION CURVES AND SIZE DISTRIBUTIONS OF T-WGBS LIBRARIES PREPARED FROM SIX DIFFERENT HUMAN BLOOD SAMPLES. Input
DNA amount was 20 ng each. (a) PCR amplification curves indicate that all 6 samples are close to the plateau phase at cycle 12. (b) Size distributions of the six T-WGBS libraries ranging
from about 200 bp to 600 bp with size peaks around 300 bp. The high spikes flanking the curves represent size markers. FU, fluorescence units. SUPPLEMENTARY FIGURE 3 BASE COMPOSITION. (A,B)
Consistency in base composition of sequencing reads between T-WGBS (A) and conventional WGBS (B). The base composition bias in the first bases of the T-WGBS reads is caused by the Tn5
transposase which has a slight base preference at certain positions of the integration target sequence (please see the paragraph entitled ‘Limitations’ in the INTRODUCTION for further
information). SUPPLEMENTARY FIGURE 4 SCATTER PLOT VERSIONS OF THE COMPARATIVE METHYLATION LEVELS SHOWN IN FIGURE 4A,B. (A) High consistency of methylation level estimates between T-WGBS and
conventional WGBS at single CpGs covered at least 30-fold (_r_ = 0.95). (B) High reproducibility of T-WGBS indicated by the similarity of the methylation levels (_r_ = 0.92) in windows of 5
CpGs (read numbers too low for single CpG analysis) in libraries from two independent tagmentations analyzed on a single HiSeq2000 lane each. SUPPLEMENTARY FIGURE 5 HIGH CONSISTENCY, 97.8%
AND 98.3%, BETWEEN T-WGBS AND CONVENTIONAL WGBS METHYLATION DATA FROM TWO HUMAN BLOOD SAMPLES, M AND K, RESPECTIVELY. For each sample, two lanes of T-WGBS data and three lanes of
conventional WGBS were compared. (A,B) Methylation levels were calculated based on scanning windows of 5 CpGs with at least 30-fold coverage and displayed on density plots (A) and scatter
plots (B). The dotted lines mark the 0.2 difference between the _x_ and _y_ axes. Consistency values were calculated by subtracting from 100% the respective numbers in the corners of the
density plots displayed in (A); these numbers indicate the percentage of data points that fall above/below the envelope marked with dotted lines. The _r_ values in (B) indicate Pearson
correlation. SUPPLEMENTARY FIGURE 6 HIGH CONSISTENCY OF METHYLATION LEVELS BETWEEN T-WGBS AND CONVENTIONAL WGBS. (A) 98.5% consistency between T-WGBS and conventional WGBS. (B) 98.1%
consistency is in an analogous analysis as in (A) between the two sequencing strands, designated Watson and Crick, from the conventional WGBS. The lower figures show scatter plot versions of
the figures at the top. Consistency defined as less than 0.2 (20%) difference in methylation level in windows of 5 CpGs. Consistency values were calculated by subtracting from 100% the
respective numbers in the corners of the upper two density plots; these numbers indicate the percentage of data points that fall above/below the envelope marked with dotted lines (marking
the 0.2 difference between the _x_ and _y_ axes). The _r_-values indicate Pearson correlation. SUPPLEMENTARY FIGURE 7 COMPARISON OF SEQUENCING COVERAGE OF CYTOSINES IN CPG, CHG AND CHH
CONTEXT (H CAN BE A, C OR T) BETWEEN T-WGBS AND CONVENTIONAL WGBS. Coverage versus cytosine density in 1-kb windows for WGBS (red) and T-WGBS (blue). The coverage appears stable in genomic
regions with 100–400 cytosines, likely because the majority of 1-kb regions has a cytosine density between 10% and 40%. Variation becomes larger in the two extremes of the cytosine density
for both T-WGBS and conventional WGBS due to low counts in each category. SUPPLEMENTARY FIGURE 8 COMPARISON OF SEQUENCING COVERAGE IN RELATION TO THE GC CONTENT IN 200-BP WINDOWS BETWEEN
T-WGBS AND CONVENTIONAL WGBS. Coverage versus local GC content in 200-bp windows, roughly the median length of genomic DNA in the library fragments, for WGBS (red) and T-WGBS (blue).
Overall, T-WGBS has a higher coverage along a wide range of GC content. SUPPLEMENTARY INFORMATION SUPPLEMENTARY METHODS Sequencing data alignment and methylation calling methods (PDF 84 kb)
SUPPLEMENTARY TABLE 1 Comparison of read numbers, duplications, coverage, methylation level and conversion between T-WGBS and conventional WGBS. (XLS 29 kb) SUPPLEMENTARY TABLE 2 Comparison
of CpG coverage between conventional WGBS and T-WGBS. (XLS 22 kb) SUPPLEMENTARY FIGURE 1 Control of size distribution of three DNA samples after tagmentation. (PDF 176 kb) SUPPLEMENTARY
FIGURE 2 PCR amplification curves and size distributions of T-WGBS libraries prepared from six different human blood samples. (PDF 74 kb) SUPPLEMENTARY FIGURE 3 Base composition. (PDF 117
kb) SUPPLEMENTARY FIGURE 4 Scatter plot versions of the comparative methylation levels shown in Figure 4a,b. (PDF 321 kb) SUPPLEMENTARY FIGURE 5 High consistency, 97.8% and 98.3%, between
T-WGBS and conventional WGBS methylation data from two human blood samples, M and K, respectively. (PDF 255 kb) SUPPLEMENTARY FIGURE 6 High consistency of methylation levels between T-WGBS
and conventional WGBS. (PDF 456 kb) SUPPLEMENTARY FIGURE 7 Comparison of sequencing coverage of cytosines in CpG, CHG and CHH context (H can be A, C or T) between T-WGBS and conventional
WGBS. (PDF 79 kb) SUPPLEMENTARY FIGURE 8 Comparison of sequencing coverage in relation to the GC content in 200-bp windows between T-WGBS and conventional WGBS. (PDF 47 kb) RIGHTS AND
PERMISSIONS Reprints and permissions ABOUT THIS ARTICLE CITE THIS ARTICLE Wang, Q., Gu, L., Adey, A. _et al._ Tagmentation-based whole-genome bisulfite sequencing. _Nat Protoc_ 8, 2022–2032
(2013). https://doi.org/10.1038/nprot.2013.118 Download citation * Published: 26 September 2013 * Issue Date: October 2013 * DOI: https://doi.org/10.1038/nprot.2013.118 SHARE THIS ARTICLE
Anyone you share the following link with will be able to read this content: Get shareable link Sorry, a shareable link is not currently available for this article. Copy to clipboard Provided
by the Springer Nature SharedIt content-sharing initiative