- Select a language for the TTS:
- UK English Female
- UK English Male
- US English Female
- US English Male
- Australian Female
- Australian Male
- Language selected: (auto detect) - EN
Play all audios:
ABSTRACT The superficial layers of the medial entorhinal cortex (MEC) are a major input to the hippocampus. The high proportion of spatially modulated cells, including grid cells and border
cells, in these layers suggests that MEC inputs are critical for the representation of space in the hippocampus. However, selective manipulations of the MEC do not completely abolish
hippocampal spatial firing. To determine whether other hippocampal firing characteristics depend more critically on MEC inputs, we recorded from hippocampal CA1 cells in rats with MEC
lesions. Theta phase precession was substantially disrupted, even during periods of stable spatial firing. Our findings indicate that MEC inputs to the hippocampus are required for the
temporal organization of hippocampal firing patterns and suggest that cognitive functions that depend on precise neuronal sequences in the hippocampal theta cycle are particularly dependent
on the MEC. Access through your institution Buy or subscribe This is a preview of subscription content, access via your institution ACCESS OPTIONS Access through your institution Subscribe
to this journal Receive 12 print issues and online access $209.00 per year only $17.42 per issue Learn more Buy this article * Purchase on SpringerLink * Instant access to full article PDF
Buy now Prices may be subject to local taxes which are calculated during checkout ADDITIONAL ACCESS OPTIONS: * Log in * Learn about institutional subscriptions * Read our FAQs * Contact
customer support SIMILAR CONTENT BEING VIEWED BY OTHERS DISTINCT ROLES OF DENTATE GYRUS AND MEDIAL ENTORHINAL CORTEX INPUTS FOR PHASE PRECESSION AND TEMPORAL CORRELATIONS IN THE HIPPOCAMPAL
CA3 AREA Article Open access 02 January 2025 THE MEDIAL SEPTUM CONTROLS HIPPOCAMPAL SUPRA-THETA OSCILLATIONS Article Open access 10 October 2023 A DIRECT EXCITATORY PROJECTION FROM
ENTORHINAL LAYER 6B NEURONS TO THE HIPPOCAMPUS CONTRIBUTES TO SPATIAL CODING AND MEMORY Article Open access 16 August 2022 REFERENCES * Quirk, G.J., Muller, R.U., Kubie, J.L. & Ranck,
J.B. Jr. The positional firing properties of medial entorhinal neurons: description and comparison with hippocampal place cells. _J. Neurosci._ 12, 1945–1963 (1992). Article CAS PubMed
PubMed Central Google Scholar * Hafting, T., Fyhn, M., Molden, S., Moser, M.B. & Moser, E.I. Microstructure of a spatial map in the entorhinal cortex. _Nature_ 436, 801–806 (2005).
Article CAS PubMed Google Scholar * Sargolini, F. et al. Conjunctive representation of position, direction and velocity in entorhinal cortex. _Science_ 312, 758–762 (2006). Article CAS
PubMed Google Scholar * Solstad, T., Boccara, C.N., Kropff, E., Moser, M.B. & Moser, E.I. Representation of geometric borders in the entorhinal cortex. _Science_ 322, 1865–1868
(2008). Article CAS PubMed Google Scholar * Zhang, S.J. et al. Optogenetic dissection of entorhinal-hippocampal functional connectivity. _Science_ 340, 1232627 (2013). Article PubMed
CAS Google Scholar * Brandon, M.P. et al. Reduction of theta rhythm dissociates grid cell spatial periodicity from directional tuning. _Science_ 332, 595–599 (2011). Article CAS PubMed
PubMed Central Google Scholar * Brandon, M.P., Koenig, J., Leutgeb, J.K. & Leutgeb, S. New and distinct hippocampal place codes are generated in a new environment during septal
inactivation. _Neuron_ 82, 789–796 (2014). Article CAS PubMed PubMed Central Google Scholar * Koenig, J., Linder, A.N., Leutgeb, J.K. & Leutgeb, S. The spatial periodicity of grid
cells is not sustained during reduced theta oscillations. _Science_ 332, 592–595 (2011). Article CAS PubMed Google Scholar * Wang, Y., Romani, S., Lustig, B., Leonardo, A. &
Pastalkova, E. Theta sequences are essential for internally generated hippocampal firing fields. _Nat. Neurosci._ 18, 282–288 (2015). Article CAS PubMed Google Scholar * Hales, J.B. et
al. Medial entorhinal cortex lesions only partially disrupt hippocampal place cells and hippocampus-dependent place memory. _Cell Rep._ 9, 893–901 (2014). Article CAS PubMed PubMed
Central Google Scholar * Deshmukh, S.S., Yoganarasimha, D., Voicu, H. & Knierim, J.J. Theta modulation in the medial and the lateral entorhinal cortices. _J. Neurophysiol._ 104,
994–1006 (2010). Article PubMed PubMed Central Google Scholar * O'Keefe, J. & Recce, M.L. Phase relationship between hippocampal place units and the EEG theta rhythm.
_Hippocampus_ 3, 317–330 (1993). Article CAS PubMed Google Scholar * Hafting, T., Fyhn, M., Bonnevie, T., Moser, M.B. & Moser, E.I. Hippocampus-independent phase precession in
entorhinal grid cells. _Nature_ 453, 1248–1252 (2008). Article CAS PubMed Google Scholar * Mizuseki, K., Sirota, A., Pastalkova, E. & Buzsaki, G. Theta oscillations provide temporal
windows for local circuit computation in the entorhinal-hippocampal loop. _Neuron_ 64, 267–280 (2009). Article CAS PubMed PubMed Central Google Scholar * Skaggs, W.E., McNaughton, B.L.,
Wilson, M.A. & Barnes, C.A. Theta phase precession in hippocampal neuronal populations and the compression of temporal sequences. _Hippocampus_ 6, 149–172 (1996). Article CAS PubMed
Google Scholar * Jensen, O. & Lisman, J.E. Hippocampal CA3 region predicts memory sequences: accounting for the phase precession of place cells. _Learn. Mem._ 3, 279–287 (1996). Article
CAS PubMed Google Scholar * Melamed, O., Gerstner, W., Maass, W., Tsodyks, M. & Markram, H. Coding and learning of behavioral sequences. _Trends Neurosci._ 27, 11–14, discussion
14–15 (2004). Article CAS PubMed Google Scholar * Dragoi, G. & Buzsaki, G. Temporal encoding of place sequences by hippocampal cell assemblies. _Neuron_ 50, 145–157 (2006). Article
CAS PubMed Google Scholar * Bi, G. & Poo, M. Synaptic modification by correlated activity: Hebb's postulate revisited. _Annu. Rev. Neurosci._ 24, 139–166 (2001). Article CAS
PubMed Google Scholar * Byrnes, S., Burkitt, A.N., Grayden, D.B. & Meffin, H. Learning a sparse code for temporal sequences using STDP and sequence compression. _Neural Comput._ 23,
2567–2598 (2011). Article PubMed Google Scholar * Tsodyks, M.V., Skaggs, W.E., Sejnowski, T.J. & McNaughton, B.L. Population dynamics and theta rhythm phase precession of hippocampal
place cell firing: A spiking neuron model. _Hippocampus_ 6, 271–280 (1996). Article CAS PubMed Google Scholar * Robbe, D. & Buzsaki, G. Alteration of theta timescale dynamics of
hippocampal place cells by a cannabinoid is associated with memory impairment. _J. Neurosci._ 29, 12597–12605 (2009). Article CAS PubMed PubMed Central Google Scholar * Gupta, A.S., van
der Meer, M.A., Touretzky, D.S. & Redish, A.D. Segmentation of spatial experience by hippocampal theta sequences. _Nat. Neurosci._ 15, 1032–1039 (2012). Article CAS PubMed PubMed
Central Google Scholar * Hasselmo, M.E., Bodelon, C. & Wyble, B.P. A proposed function for hippocampal theta rhythm: separate phases of encoding and retrieval enhance reversal of prior
learning. _Neural Comput._ 14, 793–817 (2002). Article PubMed Google Scholar * Zugaro, M.B., Monconduit, L. & Buzsaki, G. Spike phase precession persists after transient
intrahippocampal perturbation. _Nat. Neurosci._ 8, 67–71 (2005). Article CAS PubMed Google Scholar * Moser, E.I. et al. A test of the reverberatory activity hypothesis for hippocampal
'place' cells. _Neuroscience_ 130, 519–526 (2005). Article CAS PubMed Google Scholar * Mehta, M.R. Neuronal dynamics of predictive coding. _Neuroscientist_ 7, 490–495 (2001).
Article CAS PubMed Google Scholar * Harvey, C.D., Collman, F., Dombeck, D.A. & Tank, D.W. Intracellular dynamics of hippocampal place cells during virtual navigation. _Nature_ 461,
941–946 (2009). Article CAS PubMed PubMed Central Google Scholar * Harris, K.D. et al. Spike train dynamics predicts theta-related phase precession in hippocampal pyramidal cells.
_Nature_ 417, 738–741 (2002). Article CAS PubMed Google Scholar * Mehta, M.R., Lee, A.K. & Wilson, M.A. Role of experience and oscillations in transforming a rate code into a
temporal code. _Nature_ 417, 741–746 (2002). Article CAS PubMed Google Scholar * Miller, V.M. & Best, P.J. Spatial correlates of hippocampal unit activity are altered by lesions of
the fornix and endorhinal cortex. _Brain Res._ 194, 311–323 (1980). Article CAS PubMed Google Scholar * Van Cauter, T., Poucet, B. & Save, E. Unstable CA1 place cell representation
in rats with entorhinal cortex lesions. _Eur. J. Neurosci._ 27, 1933–1946 (2008). Article PubMed Google Scholar * Ylinen, A. et al. Intracellular correlates of hippocampal theta rhythm in
identified pyramidal cells, granule cells, and basket cells. _Hippocampus_ 5, 78–90 (1995). Article CAS PubMed Google Scholar * Kamondi, A., Acsady, L., Wang, X.J. & Buzsaki, G.
Theta oscillations in somata and dendrites of hippocampal pyramidal cells _in vivo_: activity-dependent phase-precession of action potentials. _Hippocampus_ 8, 244–261 (1998). Article CAS
PubMed Google Scholar * Kempter, R., Leibold, C., Buzsaki, G., Diba, K. & Schmidt, R. Quantifying circular-linear associations: hippocampal phase precession. _J. Neurosci. Methods_
207, 113–124 (2012). Article PubMed Google Scholar * Maurer, A.P., Cowen, S.L., Burke, S.N., Barnes, C.A. & McNaughton, B.L. Organization of hippocampal cell assemblies based on theta
phase precession. _Hippocampus_ 16, 785–794 (2006). Article PubMed Google Scholar * Huxter, J., Burgess, N. & O'Keefe, J. Independent rate and temporal coding in hippocampal
pyramidal cells. _Nature_ 425, 828–832 (2003). Article CAS PubMed PubMed Central Google Scholar * Huxter, J.R., Senior, T.J., Allen, K. & Csicsvari, J. Theta phase–specific codes
for two-dimensional position, trajectory and heading in the hippocampus. _Nat. Neurosci._ 11, 587–594 (2008). Article CAS PubMed Google Scholar * Hargreaves, E.L., Rao, G., Lee, I. &
Knierim, J.J. Major dissociation between medial and lateral entorhinal input to dorsal hippocampus. _Science_ 308, 1792–1794 (2005). Article CAS PubMed Google Scholar * Aghajan, Z.M. et
al. Impaired spatial selectivity and intact phase precession in two-dimensional virtual reality. _Nat. Neurosci._ 18, 121–128 (2015). Article CAS PubMed Google Scholar * Lengyel, M.,
Szatmary, Z. & Erdi, P. Dynamically detuned oscillations account for the coupled rate and temporal code of place cell firing. _Hippocampus_ 13, 700–714 (2003). Article PubMed Google
Scholar * Thurley, K., Leibold, C., Gundlfinger, A., Schmitz, D. & Kempter, R. Phase precession through synaptic facilitation. _Neural Comput._ 20, 1285–1324 (2008). Article PubMed
Google Scholar * Magee, J.C. Dendritic mechanisms of phase precession in hippocampal CA1 pyramidal neurons. _J. Neurophysiol._ 86, 528–532 (2001). Article CAS PubMed Google Scholar *
Ekstrom, A.D., Meltzer, J., McNaughton, B.L. & Barnes, C.A. NMDA receptor antagonism blocks experience-dependent expansion of hippocampal “place fields”. _Neuron_ 31, 631–638 (2001).
Article CAS PubMed Google Scholar * Klausberger, T. et al. Complementary roles of cholecystokinin- and parvalbumin-expressing GABAergic neurons in hippocampal network oscillations. _J.
Neurosci._ 25, 9782–9793 (2005). Article CAS PubMed PubMed Central Google Scholar * Feng, T., Silva, D. & Foster, D.J. Dissociation between the experience-dependent development of
hippocampal theta sequences and single-trial phase precession. _J. Neurosci._ 35, 4890–4902 (2015). Article CAS PubMed PubMed Central Google Scholar * Jaramillo, J., Schmidt, R. &
Kempter, R. Modeling inheritance of phase precession in the hippocampal formation. _J. Neurosci._ 34, 7715–7731 (2014). Article CAS PubMed PubMed Central Google Scholar * Harris, K.D.,
Hirase, H., Leinekugel, X., Henze, D.A. & Buzsaki, G. Temporal interaction between single spikes and complex spike bursts in hippocampal pyramidal cells. _Neuron_ 32, 141–149 (2001).
Article CAS PubMed Google Scholar * Chance, F.S. Hippocampal phase precession from dual input components. _J. Neurosci._ 32, 16693–16703 (2012). Article CAS PubMed PubMed Central
Google Scholar * Leung, L.S. A model of intracellular theta phase precession dependent on intrinsic subthreshold membrane currents. _J. Neurosci._ 31, 12282–12296 (2011). Article CAS
PubMed PubMed Central Google Scholar * Schlesiger, M.I. et al. Hippocampal activation during the recall of remote spatial memories in radial maze tasks. _Neurobiol. Learn. Mem._ 106,
324–333 (2013). Article CAS PubMed Google Scholar * Bragin, A., Jando, G., Nadasdy, Z., van Landeghem, M. & Buzsaki, G. Dentate EEG spikes and associated interneuronal population
bursts in the hippocampal hilar region of the rat. _J. Neurophysiol._ 73, 1691–1705 (1995). Article CAS PubMed Google Scholar * Schmitzer-Torbert, N., Jackson, J., Henze, D., Harris, K.
& Redish, A.D. Quantitative measures of cluster quality for use in extracellular recordings. _Neuroscience_ 131, 1–11 (2005). Article CAS PubMed Google Scholar * Skaggs, W.E.,
McNaughton, B.L., Gothard, K.M. & Markus, E.J. An information-theoretic approach to deciphering the hippocampal code. in _Advances in Neural Information Processing Systems 5_ (eds.
Hanson, S.J., Giles, C.L. & Cowan, J.D.) 1030–1037 (Morgan Kaufmann, San Mateo, CA, 1993). * Bokil, H., Andrews, P., Kulkarni, J.E., Mehta, S. & Mitra, P.P. Chronux: a platform for
analyzing neural signals. _J. Neurosci. Methods_ 192, 146–151 (2010). Article PubMed PubMed Central Google Scholar * Jammalamadaka, S.R. & SenGupta, A. _Topics in Circular
Statistics_ (World Scientific, Singapore, 2001). Download references ACKNOWLEDGEMENTS The authors thank M. Wong for technical assistance, G. Diehl for recording control data and J. Lisman
for comments on the manuscript. This work was supported by a Boehringer Ingelheim Fonds PhD fellowship, the German Research Association (DFG) under grant LE 2250/5-1, the Ellison Medical
Foundation grant AG-NS-0724-10, Walter F. Heiligenberg Professorship, National Science Foundation Collaborative Research in Computational Neuroscience grant 1010463, and US National
Institutes of Health grants R21 MH100354 and R01 NS086947. AUTHOR INFORMATION Author notes * Magdalene I Schlesiger and Christopher C Cannova: These authors contributed equally to this work.
AUTHORS AND AFFILIATIONS * Neurobiology Section and Center for Neural Circuits and Behavior, University of California, San Diego, La Jolla, California, USA Magdalene I Schlesiger,
Christopher C Cannova, Brittney L Boublil, Emily A Mankin, Mark P Brandon, Jill K Leutgeb & Stefan Leutgeb * Graduate School of Systemic Neurosciences, Ludwig-Maximilians-Universität
München, Planegg, Germany Magdalene I Schlesiger * Department of Psychiatry, School of Medicine, University of California, San Diego, La Jolla, California, USA Jena B Hales * Department
Biology II, Ludwig-Maximilians-Universität München, Planegg, Germany Christian Leibold * Kavli Institute for Brain and Mind, University of California, San Diego, La Jolla, California, USA
Stefan Leutgeb Authors * Magdalene I Schlesiger View author publications You can also search for this author inPubMed Google Scholar * Christopher C Cannova View author publications You can
also search for this author inPubMed Google Scholar * Brittney L Boublil View author publications You can also search for this author inPubMed Google Scholar * Jena B Hales View author
publications You can also search for this author inPubMed Google Scholar * Emily A Mankin View author publications You can also search for this author inPubMed Google Scholar * Mark P
Brandon View author publications You can also search for this author inPubMed Google Scholar * Jill K Leutgeb View author publications You can also search for this author inPubMed Google
Scholar * Christian Leibold View author publications You can also search for this author inPubMed Google Scholar * Stefan Leutgeb View author publications You can also search for this author
inPubMed Google Scholar CONTRIBUTIONS M.I.S., S.L. and J.K.L. designed experiments, M.I.S., J.B.H. and S.L. performed surgeries, M.I.S. and B.L.B. acquired data, M.P.B. provided data,
C.C.C., M.I.S., J.B.H., E.A.M., C.L. and S.L. performed analysis, and M.I.S., C.C.C, J.K.L., C.L. and S.L. wrote the manuscript. CORRESPONDING AUTHOR Correspondence to Stefan Leutgeb. ETHICS
DECLARATIONS COMPETING INTERESTS The authors declare no competing financial interests. INTEGRATED SUPPLEMENTARY INFORMATION SUPPLEMENTARY FIGURE 1 SUFFICIENT LFP THETA POWER FOR PHASE AND
FREQUENCY ANALYSIS WAS RETAINED IN ALL RATS WITH LESIONS THAT INCLUDED THE ENTIRE EXTENT OF THE MEDIAL ENTORHINAL CORTEX. (A) (Top two rows) Photographs of NeuN-stained sections through the
medial entorhinal cortex (MEC) from a control rat and from an MEC-lesioned rat in which the lesion size was close to the group average. Three sagittal levels are shown for each rat (d,
dorsal; v, ventral; a, anterior; p, posterior). Red lines delineate MEC borders. Scale bars are 1 mm. (Bottom left) Average lesion size in different MEC layers. The percentage of damaged
tissue was quantified for each layer along the entire extent of MEC (including dorsal, intermediate and ventral MEC). Dots indicate lesion size in individual hemispheres, and matching colors
are from the same rat. Bars graphs, mean ± SEM. (Bottom right) Electrode tracks in the left and right dorsal hippocampus of two MEC-lesioned rats. Termination sites in the CA1 cell layer
are marked with arrows. Scale bars are 1 mm. (B,C) Example LFP traces (gray, raw signal; black, 4-12 Hz filtered) and 1/_f_ corrected spectrograms from the selected tetrode that was used for
phase and frequency analysis in the three control rats and in five MEC-lesioned rats with recordings on the linear track. An additional rat (Rat 587) with recordings from only 2 cells for
which no PSSFs were identified is not shown. Scale bars are 250 μV and 100 ms. Vertical lines indicate the peak of each LFP-theta cycle. SUPPLEMENTARY FIGURE 2 PERIODS OF STABLE SPATIAL
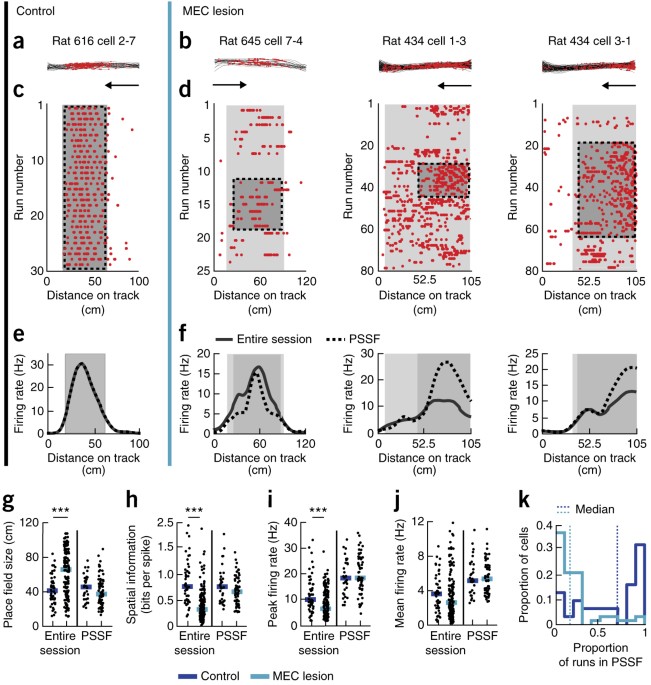
FIRING WERE SHORTER IN MEC-LESIONED THAN IN CONTROL RATS. Example place fields on the linear track from two control rats (A, rat 616 and rat 614) and from two MEC-lesioned rats (B, rat 645
and rat 434). Data recorded during the turn are not shown and were excluded from the analysis. Each column (from i to iii) depicts the spatial firing pattern of one cell during running in
one direction (indicated by the arrow). (i) Trajectories (black lines) and spike locations (red dots) within the place field. (ii) Raster plots with each row corresponding to a run from one
end of the track to the other. (iii) Firing rate versus distance on the linear track. Place field boundaries and firing rates are shown for the entire session (gray line and enclosed entire
shaded area) and for the period of stable spatial firing longest PSSF (PSSF; stippled line and enclosed, darker shaded gray area). SUPPLEMENTARY FIGURE 3 SINGLE‐UNIT RECORDINGS WERE STABLE
THROUGHOUT PERIODS WHEN THE SPATIAL FIRING PATTERNS IN MEC‐LESIONED RATS SHIFTED. (A,B) Recording quality and cluster stability are depicted for representative tetrodes from a control rat
(rat 616, black vertical line) and from an MEC‐lesioned rat (Rat 434, blue vertical line). (i) Scatter plots of spike amplitudes or spike energy (i.e., the area under the amplitude curve)
for two of the four recording channels of a tetrode. The first and second half of the recording session are shown separately. In each scatter plot, spikes are represented as dots. Because
spikes that are generated by individual cells tend to have consistent amplitude distributions across channels, spikes from the same cell form clusters within the scatter plots. Spikes
assigned to each cluster are shown in matching colors. Spikes that did not clearly separate into clusters were not included into the analysis and are shown in gray. Within each recording
session, clusters remained in a stable position in amplitude and energy space. (ii) Raster plots of spatial firing patterns with the spike locations (red dots) during each run in one
direction (black arrow) on the linear track. Periods of stable spatial firing (PSSFs) that were used for phase precession analysis are highlighted in gray. (iii) Spike amplitudes over the
course of a recording session are shown for the cells in the raster plots. Each tetrode channel is a different color. Cluster quality measures (L‐ratio and isolation distance) are noted for
each cell. Cells recorded from MEC‐lesioned rats did not show changes in spike amplitude beyond the small variability that was also observed in controls, and these cells thus showed stable
spike amplitudes even at time points when the spatial firing patterns shifted. (C) Comparison between the average spike amplitudes during the first and during second half of each recording.
The amplitude difference on the channel with the highest amplitude, the percent change on the channel with the highest amplitude, as well as the Euclidean distance between the amplitudes on
all four channels were calculated. None of these measurements showed differences between cells from control and cells from MEC‐lesioned rats (control, _n_ = 74 cells; MEC‐lesioned, _n_ = 163
cells with > 20 spikes; amplitude difference, _P_ = 0.39; percent change, _P_ = 0.23; Euclidean distance, _P_ = 0.51; Mann‐Whitney _U_ tests). (D,E) Cluster quality in control and
MEC-lesioned rats. The L‐ratio indicated a better cluster quality in cells from MEC‐lesioned compared to control rats (control, _n_ = 75 cells; MEC‐lesioned, _n_ = 170 cells with > 12
spikes; _P =_ 0.049, Mann‐Whitney _U_ test) while the isolation distance was significantly lower after the MEC lesion (_P =_ 0.040, Mann‐Whitney _U_ test). Along with these inconsistent
differences between the groups, the distributions showed substantial overlap. Together with lack of amplitude differences within the recording sessions (see C), we could therefore not find
any indication that the more frequent shifts in spatial firing patterns in the cells from MEC‐lesioned rats could be explained by differences in cluster stability or quality. SUPPLEMENTARY
FIGURE 4 PHASE PRECESSION IS SUBSTANTIALLY DISRUPTED IN ALL MEC-LESIONED RATS. Additional examples of spatial and temporal firing patterns on the linear track. Pooled and single pass phase
precession analysis from a control rat (A, rat 614) and two MEC-lesioned rats (B, rat 434 and rat 645). For each PSSF, the place field, LFP traces and spike trains are shown. (Top left of
each panel) Firing rate on the linear track (stippled line) with the extent of the field during the PSSF indicated by a shaded box. Arrows indicate the running direction. (Top right of each
panel) Firing phase versus relative distance in the field for all passes through the field. A regression line (black) is added when the circular-linear correlation was significant (_P_ <
0.05). For better visualization, the phase of each spike is replotted in a second cycle. (Lower panels in each box) For passes through the place field, the LFP trace (gray, raw signal;
black, 4-12 Hz filtered) and the spike times are depicted (red ticks). Black vertical lines indicate the peak of each LFP-theta cycle. Scale bars are 250 µV and 100 ms. To the right of the
trace for each pass, the corresponding firing phase of each spike is plotted as a function of the relative distance through the field. A regression line (black) is added when the
circular-linear correlation was significant (_P_ < 0.05). Analysis of pooled passes and single passes revealed a deficit of phase precession in cells from MEC-lesioned rats, while
prominent phase precession was observed in control cells. SUPPLEMENTARY FIGURE 5 MEC LESIONS RESULTED IN HIGHLY VARIABLE AND A LOWER PROPORTION OF SIGNIFICANT PHASE-DISTANCE CORRELATIONS
DURING SINGLE PASSES THROUGH HIPPOCAMPAL PLACE FIELDS. (A,B) Firing phase-distance regression slopes for single passes (blue ticks) through each field. Corresponding field-averaged slope
(black tick) and SEM (error bars) are shown on the horizontal axis. Fields are arranged from top to bottom by increasing field-averaged slope. All slopes (top) and only slopes where the
circular-linear correlation was significant (_P_ < 0.05) (bottom) are shown for control rats (left) and MEC-lesioned rats (right). (A) Single pass slopes and corresponding field-averages
for the entire recording session. (B) Same as in A for periods of stable spatial firing (PSSFs). (C) Slopes were first calculated for single passes through each field and then averaged per
field (_n_ = 47 control fields and 133 fields from MEC-lesioned rats). Insets: field-average of only significant slopes (_P_ < 0.05, circular-linear correlation; _n_ = 39 control fields
and 89 fields from MEC-lesioned rats). (D) Same as in C for PSSFs (see also Fig. 3; _n_ = 31 control fields and 50 fields from MEC-lesioned rats; only significant slopes: control, _n_ = 25
fields; MEC-lesioned, _n_ = 27 fields). Within each graph, the stippled orange line indicates the mean of the field-averaged slopes. Gray shading highlights the region of the graph where
slopes are negative. Compared to control rats, the CA1 cells from MEC-lesioned rats exhibited phase-distance slopes that were less frequently negative (entire recording session: 88.9 % for
control fields and 61.5 % for fields from MEC-lesioned rats, _P_ = 1.3 x 10⁻⁶, Mann-Whitney _U_ test; PSSFs: 88.9 % for control fields and 60.0 % for fields from MEC-lesioned rats, _P_ =
0.00020, Mann-Whitney _U_ test), less frequently significant (entire recording session: 40.0 % for control fields and 20.0 % for fields from MEC-lesioned rats, _P_ = 0.00019, Mann-Whitney
_U_ test; PSSFs: 50.0 % for control fields and 9.6 % for fields from MEC-lesioned rats, _P_ = 0.0045, Mann-Whitney _U_ test), and more variable (median standard deviation in entire recording
session: 0.35 for control fields and 0.91 for fields from MEC-lesioned rats, _P_ = 3.5 x 10⁻⁹, Mann-Whitney _U_ test; PSSFs: 0.22 for control fields and 0.87 for fields from MEC-lesioned
rats, _P_ = 0.0023, Mann-Whitney _U_ test) during single passes through their respective place fields. SUPPLEMENTARY FIGURE 6 SPATIAL AND TEMPORAL FIRING CHARACTERISTICS OF EXAMPLE PLACE
FIELDS RECORDED IN THE OPEN FIELD. All cells recorded on one representative tetrode per rat are shown for two control rats (A, black vertical line) and three MEC-lesioned rats (B, blue
vertical line). (First column of each cell’s panel) Color-coded rate maps (blue to red, 0 Hz to peak rate). Scale bars are 50 cm. (Second column) Corresponding trajectory plot with the rat’s
path (gray line) and the location of spikes (red dots). The place field boundaries are overlaid in black. (Third column) Spike-time autocorrelogram. (Fourth column) The phases of all
in-field spikes fired during the 10-min session are plotted as a function of the relative distance through the field. A regression line (black) is added when the circular-linear correlation
was significant (_P_ < 0.05, circular-linear correlation). Significant negative slopes, which indicate phase precession, are found for most fields from control rats (35/46, 76.1 %) but
only for few fields from MEC-lesioned rats (5/21, 23.8 %). SUPPLEMENTARY FIGURE 7 EXAMPLE PASSES THROUGH PLACE FIELDS IN THE OPEN FIELD. Pooled and single pass analysis for (A) a place cell
from a control rat and (B,C) two simultaneously recorded cells from an MEC-lesioned rat. (Top row of each panel, from left to right) Color-coded rate map (blue to red, 0 Hz to peak rate),
trajectory plot with the rat’s path (gray line) and the location of spikes (red dots), spike-time autocorrelogram, phase-distance plot for all in-field spikes fired during a 10-min session.
(Additional pairs of plots in each panel) Trajectory and phase-distance plots for all individual passes through the place field. The place field boundaries (black line) are overlaid on all
trajectory plots. A regression line is added to the phase-distance plots when significant (_P_ < 0.05, circular-linear correlation). SUPPLEMENTARY FIGURE 8 FIELD-AVERAGED SINGLE-PASS
ANALYSIS DURING SEPTAL INACTIVATION. Single trial phase precession was analyzed during a 10-minute session before and at two time points during septal inactivation. (A–C) Phase-distance
plots of example cells that were recorded before inactivation, 30 min into the inactivation, and 2 h into the inactivation. For each cell the phase-distance plot is shown for all passes
through the place field (pooled passes, left in each panel) as well as for one representative pass through the place field (single pass, right in each panel). For better visualization, the
phase of each spike is replotted in a second cycle. Regression lines (black) are added when the circular-linear correlation was significant (_P_ < 0.05). (D, top row) Representative
time-averaged and 1/f corrected spectrograms of LFP recordings used for theta phase analysis. (D, bottom row) Distributions of phase-distance slopes. For each cell, slopes were first
calculated for single passes through each field and then averaged per field (see Fig. 7 for the analysis of pooled passes). Insets: field-average of only significant slopes (_P_ < 0.05,
circular-linear correlation). (E, top) To calculate theta phase and frequency, a recording tetrode with theta power of at least 1.5 times over the 1/f baseline was chosen for each recording
session (_n_ = 5, one tetrode per session). Mean theta power on tetrodes selected for phase and frequency analysis. Dots indicate individual sessions, and matching colors are used for the
same tetrode. Mean theta power on selected tetrodes in the MEC-lesioned group is shown for comparison (blue line). (E, bottom) The mean field-averaged slope was less than zero before the
inactivation (all slopes, _n_ = 52, _P_ = 1.01 x 10⁻⁵, _t_ test; only significant slopes, _n_ = 45, _P_ = 9.33 x 10⁻⁹, sign test), not different from zero during the session 30 min into the
inactivation (all slopes, _n_ = 46, _P_ = 0.54, _t_ test; only significant slopes, _n_ = 30, _P_ = 0.86, sign test), and again less than zero during the session 2h into the inactivation (all
slopes, _n_ = 44, _P_ = 2.09 x 10⁻⁵, _t_ test; only significant slopes, _n_ = 32, _P_ = 0.020, sign test). The session at 30 min but not at 2 h into the inactivation was different from
baseline (_P_ = 0.00027 and _P_ = 0.22, Mann-Whitney _U_ test). The mean field-averaged slope in MEC-lesioned rats (all slopes, _n_ = 25) was different from baseline, but not different from
recordings in either of the septal inactivation sessions (_P_ = 0.028, _P_ = 0.97, _P_ = 0.13, Mann-Whitney _U_ test). Bar graphs include mean ± SEM. See Supplementary Table 4 for detailed
statistics. ***_P_ < 0.001, * _P_ < 0.05, compared to MEC lesion group. ### _P_ < 0.001, baseline compared to septal inactivation, Holm-Bonferroni corrected for multiple
comparisons. (F) Schematic of the relation between spikes (red ticks) and theta oscillations (black lines) with and without jitter. Vertical gray lines indicate the peak of each theta cycle.
(Top) Schematic of a spike train that exhibits clear phase precession over the course of three theta cycles. (Middle) Same spike train as shown on top after the application of spike-timing
jitter. Spike-timing jitter was simulated by adding zero-mean Gaussian noise with a particular standard deviation (σt) to each spike time prior to phase estimation. (bottom) Same spike train
as shown on top after the application of phase-onset jitter. Phase onset jitter was simulated by adding zero-mean Gaussian noise with a particular standard deviation (σϕ) to the phase of
all spikes within a theta-associated burst (TAB; see Online Methods). Single spikes not included in a TAB were treated analogously. (G) Phase-distance plots corresponding to spikes pooled
from all passes through the same field before and after applying the same jitter as shown in F. Note that, despite the ambiguity introduced at the level of single passes, the overall
phase-distance relationship over all passes remains largely unchanged after the application of a relatively large degree of jitter. (H) Phase-distance plots and corresponding circular-linear
regression lines obtained from two example passes through a place field (top) before jitter was applied, (middle) after the application of spike time jitter (σt = 20 ms), and (bottom) after
the application of phase onset jitter (σϕ = 15.00 % theta cycle). Each spike is replotted in a second cycle for clarity. Note the ambiguity introduced in the phase-distance relationship
after the application of jitter and its effect on the slope of the regression line. (I) Spike time (top) and phase onset (bottom) jitter were applied separately to the spikes of cells
recorded during baseline conditions, where clear phase precession was observed (see Fig. 7). Data without the application of jitter (Baseline) are represented at a standard deviation of
zero. All other symbols (circles) represents the average of 100 iterations (that is for each iteration, jitter applied to all fields) per degree of jitter (that isi.e., standard deviation on
horizontal axis). For each iteration, a _t_ test was used to test the means of the resulting field-averaged single pass (green lines) and pooled pass (purple lines) slope distributions
against zero at the α = 0.05 significance level. The shading of each circle corresponds to the proportion of trial distributions with mean values that were significantly different from zero
for each degree of jitter (white to black, 0 to 1). Note that the degree of jitter required to render phase precession undetectable (e.g. obtain an average distribution mean close to 0) is
lower for field-averaged single pass distributions than for pooled pass distributions, irrespective of the type of jitter simulated. Phase precession measures based on field-averaged single
pass slopes are thus less robust to jitter than slopes obtained by pooling spikes from all passes through a field. SUPPLEMENTARY FIGURE 9 SCHEMATIC MODEL OF CA1 INTRACELLULAR DYNAMICS THAT
REQUIRE MEC INPUTS FOR PHASE PRECESSION. Our results can be explained if we assume three input pathways (top three traces) combined at the CA1 pyramidal cell: the local theta oscillation
(Hippocampus), a non-oscillatory but spatially modulated input from the LEC, and an oscillatory and spatially modulated input induced by MEC. In the model, the MEC-induced oscillator is
assumed to be faster than the local oscillator (gray and white bars), which reflects our finding that cellular oscillations are slower in the MEC-lesioned rats. Mechanistically this could be
explained by resonance properties in the dendrites, as described in ref. 50. A weighted linear superposition of the three inputs yields a membrane potential that comprises both ramp like
and oscillatory character and an additional increase in the oscillation amplitude as reported in ref. 28. Setting a constant action potential threshold (red) defines a distinct
space-dependent phase range (blue) during which the cell may fire. In the control case with all three inputs intact (left column) the mean of the phase range decreases with space. In the
MEC-lesioned case (right column) the mean of the phase range stays stationary. The width of the place field, however, is not substantially affected be the absence of MEC input. SUPPLEMENTARY
INFORMATION SUPPLEMENTARY TEXT AND FIGURES Supplementary Figures 1–9 and Supplementary Tables 1–4 (PDF 11404 kb) SOURCE DATA SOURCE DATA TO FIG. 1 SOURCE DATA TO FIG. 2 SOURCE DATA TO FIG.
3 SOURCE DATA TO FIG. 4 SOURCE DATA TO FIG. 5 SOURCE DATA TO FIG. 6 SOURCE DATA TO FIG. 7 SOURCE DATA TO FIG. 8 RIGHTS AND PERMISSIONS Reprints and permissions ABOUT THIS ARTICLE CITE THIS
ARTICLE Schlesiger, M., Cannova, C., Boublil, B. _et al._ The medial entorhinal cortex is necessary for temporal organization of hippocampal neuronal activity. _Nat Neurosci_ 18, 1123–1132
(2015). https://doi.org/10.1038/nn.4056 Download citation * Received: 19 January 2015 * Accepted: 04 June 2015 * Published: 29 June 2015 * Issue Date: August 2015 * DOI:
https://doi.org/10.1038/nn.4056 SHARE THIS ARTICLE Anyone you share the following link with will be able to read this content: Get shareable link Sorry, a shareable link is not currently
available for this article. Copy to clipboard Provided by the Springer Nature SharedIt content-sharing initiative