- Select a language for the TTS:
- UK English Female
- UK English Male
- US English Female
- US English Male
- Australian Female
- Australian Male
- Language selected: (auto detect) - EN
Play all audios:
ABSTRACT Feedbacks between land carbon pools and climate provide one of the largest sources of uncertainty in our predictions of global climate1,2. Estimates of the sensitivity of the
terrestrial carbon budget to climate anomalies in the tropics and the identification of the mechanisms responsible for feedback effects remain uncertain3,4. The Amazon basin stores a vast
amount of carbon5, and has experienced increasingly higher temperatures and more frequent floods and droughts over the past two decades6. Here we report seasonal and annual carbon balances
across the Amazon basin, based on carbon dioxide and carbon monoxide measurements for the anomalously dry and wet years 2010 and 2011, respectively. We find that the Amazon basin lost 0.48 ±
0.18 petagrams of carbon per year (Pg C yr−1) during the dry year but was carbon neutral (0.06 ± 0.1 Pg C yr−1) during the wet year. Taking into account carbon losses from fire by using
carbon monoxide measurements, we derived the basin net biome exchange (that is, the carbon flux between the non-burned forest and the atmosphere) revealing that during the dry year,
vegetation was carbon neutral. During the wet year, vegetation was a net carbon sink of 0.25 ± 0.14 Pg C yr−1, which is roughly consistent with the mean long-term intact-forest biomass sink
of 0.39 ± 0.10 Pg C yr−1 previously estimated from forest censuses7. Observations from Amazonian forest plots suggest the suppression of photosynthesis during drought as the primary cause
for the 2010 sink neutralization. Overall, our results suggest that moisture has an important role in determining the Amazonian carbon balance. If the recent trend of increasing
precipitation extremes persists6, the Amazon may become an increasing carbon source as a result of both emissions from fires and the suppression of net biome exchange by drought. Access
through your institution Buy or subscribe This is a preview of subscription content, access via your institution ACCESS OPTIONS Access through your institution Subscribe to this journal
Receive 51 print issues and online access $199.00 per year only $3.90 per issue Learn more Buy this article * Purchase on SpringerLink * Instant access to full article PDF Buy now Prices may
be subject to local taxes which are calculated during checkout ADDITIONAL ACCESS OPTIONS: * Log in * Learn about institutional subscriptions * Read our FAQs * Contact customer support
SIMILAR CONTENT BEING VIEWED BY OTHERS DECADAL INCREASES IN CARBON UPTAKE OFFSET BY RESPIRATORY LOSSES ACROSS NORTHERN PERMAFROST ECOSYSTEMS Article Open access 26 July 2024 GLOBAL INCREASE
IN BIOMASS CARBON STOCK DOMINATED BY GROWTH OF NORTHERN YOUNG FORESTS OVER PAST DECADE Article 02 October 2023 ALASKAN CARBON-CLIMATE FEEDBACKS WILL BE WEAKER THAN INFERRED FROM SHORT-TERM
EXPERIMENTS Article Open access 16 November 2020 REFERENCES * Huntingford, C. et al. Contributions of carbon cycle uncertainty to future climate projection spread. _Tellus B_ 61, 355–360
(2009) Article ADS CAS Google Scholar * Friedlingstein, P. et al. Climate-carbon cycle feedback analysis: results from the (CMIP)-M-4 model intercomparison. _J. Clim._ 19, 3337–3353
(2006) Article ADS Google Scholar * Phillips, O. L. et al. Changes in the carbon balance of tropical forests: evidence from long-term plots. _Science_ 282, 439–442 (1998) Article CAS
ADS PubMed Google Scholar * Huntingford, C. et al. Simulated resilience of tropical rainforests to CO2-induced climate change. _Nature Geosci._ 6, 268–273 (2013) Article CAS ADS Google
Scholar * Malhi, Y. et al. The regional variation of aboveground live biomass in old-growth Amazonian forests. _Glob. Change Biol._ 12, 1107–1138 (2006) Article ADS Google Scholar *
Gloor, M. et al. Intensification of the Amazon hydrological cycle over the last two decades. _Geophys. Res. Lett._ 40, 1729–1733 (2013) Article ADS Google Scholar * Phillips, O. L. et al.
Drought sensitivity of the Amazon rainforest. _Science_ 323, 1344–1347 (2009) Article CAS ADS Google Scholar * Lloyd, J. et al. An airborne regional carbon balance for Central Amazonia.
_Biogeosciences_ 4, 759–768 (2007) Article CAS ADS Google Scholar * Chou, W. W. et al. Net fluxes of CO2 in Amazonia derived from aircraft observations. _J. Geophys. Res._ 107, 4614,
http://dx.doi.org/10.1029/2001JD001295 (2002) Article CAS Google Scholar * Saleska, S., da Rocha, H. R. & Nobre, A. in _Amazonia and Global Change Geophysical Monograph Series_ 186,
389–407 (ed. Gash, J., Keller, M. & Silva Dias, P. ) (American Geophysical Union, 2009) Book Google Scholar * Saleska, S. R. et al. Carbon in Amazon forests: unexpected seasonal fluxes
and disturbance-induced losses. _Science_ 302, 1554–1557 (2003) Article CAS ADS PubMed Google Scholar * Houghton, R. A. Revised estimates of the annual net flux of carbon to the
atmosphere from changes in land use and land management 1850–2000. _Tellus B_ 55, 378–390 (2003) ADS Google Scholar * Richey, J. E., Melack, J. M., Aufdenkampe, A. K., Ballester, V. M.
& Hess, L. L. Outgassing from Amazonian rivers and wetlands as a large tropical source of atmospheric CO2. _Nature_ 416, 617–620 (2002) Article CAS ADS PubMed Google Scholar *
Gurney, K. R. et al. Towards robust regional estimates of CO2 sources and sinks using atmospheric transport models. _Nature_ 415, 626 (2002) Article ADS PubMed Google Scholar * Stephens,
B. B. et al. Weak northern and strong tropical land carbon uptake from vertical profiles of atmospheric CO2 . _Science_ 316, 1732–1735 (2007) Article CAS ADS PubMed Google Scholar *
Aragão, L. E. O. C. et al. Spatial patterns and fire response of recent Amazonian droughts. _Geophys. Res. Lett._ 34, L07701, http://dx.doi.org/10.1029/2006gl028946 (2007) Article ADS
Google Scholar * Espinoza, J. C. et al. Climate variability and extreme drought in the upper Solimões River (western Amazon Basin): understanding the exceptional 2010 drought. _Geophys.
Res. Lett._ 38, L13406, http://dx.doi.org/10.1029/2011gl047862 (2011) Article ADS Google Scholar * Miller, J. B. et al. Airborne measurements indicate large methane emissions from the
eastern Amazon basin. _Geophys. Res. Lett._ 34, L10809, http://dx.doi.org/10.1029/2006GL029213 (2007) * D’Amelio, M. T. S., Gatti, L. V., Miller, J. B. & Tans, P. Regional N2O fluxes in
Amazonia derived from aircraft vertical profiles. _Atmos. Chem. Phys._ 9, 8785–8797 (2009) Article ADS Google Scholar * Gatti, L. V. et al. Vertical profiles of CO2 above eastern Amazonia
suggest a net carbon flux to the atmosphere and balanced biosphere between 2000 and 2009. _Tellus B_ 62, 581–594 (2010) Article ADS CAS Google Scholar * European Commission. Emission
Database for Global Atmospheric Research (EDGAR) version 4.0, http://edgar.jrc.ec.europa.eu/overview.php?v = 40 (Joint Research Centre/Netherlands Environmental Assessment Agency, 2009) *
Greenberg, J. P. et al. Biogenic VOC emissions from forested Amazonian landscapes. _Glob. Change Biol._ 10, 651–662 (2004) Article ADS Google Scholar * Gloor, M. et al. The carbon balance
of South America: a review of the status, decadal trends and main determinants. _Biogeosciences_ 9, 5407–5430 (2012) Article CAS ADS Google Scholar * Cox, P. M. et al. Sensitivity of
tropical carbon to climate change constrained by carbon dioxide variability. _Nature_ 494, 341–344 (2013) Article CAS ADS PubMed Google Scholar * Lloyd, J. & Farquhar, G. D. The CO2
dependence of photosynthesis, plant growth responses to elevated atmospheric CO2 concentrations and their interaction with soil nutrient status. I. General principles and forest ecosystems.
_Funct. Ecol._ 10, 4–32 (1996) Article Google Scholar * van der Werf, G. R. et al. Estimates of fire emissions from an active deforestation region in the southern Amazon based on
satellite data and biogeochemical modelling. _Biogeosciences_ 6, 235–249 (2009) Article CAS ADS Google Scholar * Lewis, S. L., Brando, P. M., Phillips, O. L., van der Heijden, G. M. F.
& Nepstad, D. The 2010 Amazon drought. _Science_ 331, 554 (2011) Article CAS ADS PubMed Google Scholar * Liu, Z., Ostrenga, D., Teng, W. & Kempler, S. Tropical Rainfall
Measuring Mission (TRMM) precipitation data and services for research and applications. _Bull. Am. Meteorol. Soc._ 93, 1317–1325 (2012) Article ADS Google Scholar * Arino, O., Casadio, S.
& Serpe, D. Global night-time fire season timing and fire count trends using the ATSR instrument series. _Remote Sens. Environ._ 116, 226–238 (2012) Article ADS Google Scholar *
INPE. _PRODES (Projeto de Deflorestamento da Amazônia)_http://www.obt.inpe.br/prodes/index.html (2011) * Zhou, L. X., Kitzis, D. & Tans, P. in _Report of the Fourteenth WMO/IAEA Meeting
of Experts on Carbon Dioxide Concentration and Related Tracer Measurement Techniques_ Vol. 186 40–43 (WMO/Global Atmospheric Watch, 2009) Google Scholar * Stohl, A., Forster, C., Frank, A.,
Seibert, P. & Wotawa, G. The Lagrangian particle dispersion model FLEXPART version 6.2. _Atmos. Chem. Phys._ 5, 2461–2474 (2005) Article CAS ADS Google Scholar * Thoning, K. W.,
Tans, P. P. & Komhyr, W. D. Atmospheric carbon dioxide at Mauna Loa Observatory 2. Analysis of the NOAA GMCC data, 1974-1985. _J. Geophys. Res._ 94, 8549–8565 (1989) Article CAS ADS
Google Scholar * Draxler, R. R. & Rolph, G. D. _HYSPLIT (HYbrid Single-Particle Lagrangian Integrated Trajectory)_ http://ready.arl.noaa.gov/HYSPLIT.php (NOAA, 2013) Google Scholar *
Freitas, S. R. et al. The Coupled Aerosol and Tracer Transport model to the Brazilian developments on the Regional Atmospheric Modeling System (CATT-BRAMS)—Part 1: Model description and
evaluation. _Atmos. Chem. Phys._ 9, 2843–2861 (2009) Article CAS ADS Google Scholar * del Aguila-Pasquel, J. et al. The seasonal cycle of productivity, metabolism and carbon dynamics in
a wet aseasonal forest in NW Amazonia (Iquitos, Peru). _Plant Ecol. Divers._ 7, 71–83 (2013) Article Google Scholar * Araujo-Murakami, A. et al. The productivity, allocation and cycling of
carbon at the dry margin of the Amazon forest in Bolivia. _Plant Ecol. Divers._ 7, 55–69 (2013) Article Google Scholar * da Costa, A. et al. Seasonality of ecosystem respiration and net
primary productivity after 8–10 years of experimental drought in an eastern Amazon forest. _Plant Ecol. Divers._ 7, 7–24 (2013) Article Google Scholar * Doughty, C. E. et al. The
production, allocation and cycling of carbon in a forest on fertile Dark Earth (terra preta do indio) soil in Eastern Amazonia, compared with forest on adjacent infertile soil. _Plant Ecol.
Divers._ 7, 41–53 (2013) Article Google Scholar * Huasco, W. H. et al. Seasonal production, allocation and cycling of carbon in two mid-elevation tropical montane forest plots in the
Peruvian Andes. _Plant Ecol. Divers._ 7, 125–142 (2013) Article Google Scholar * Malhi, Y. et al. The productivity, metabolism and carbon cycle of two lowland tropical forest plots in SW
Amazonia, Peru. _Plant Ecol. Divers._ 7, 85–105 (2013) Article Google Scholar * Rocha, W., Metcalfe, D., Doughty, C. E. & Mahli, Y. Ecosystem productivity and carbon cycling in intact
and annually burnt forest at the dry southern limit of the Amazon rainforest (Mato Grosso, Brazil). _Plant Ecol.Divers._ 7, 25–40 (2013) Article Google Scholar * Girardin, C. A. et al.
Productivity and carbon allocation in a tropical montane cloud forest in the Peruvian Andes. _Plant. Ecol. Divers._ 7, 107–123 (2013) Article Google Scholar * Beck, C., Grieser, J. &
Rudolf, B. A new monthly precipitation climatology for the global land areas for the period 1951 to 2000. _Geophys. Res. Abstr._ 7, 07154 (2005) Google Scholar * Fan, Y. & van den Dool,
H. A global monthly land surface air temperature analysis for 1948–present. _J. Geophys. Res._ 113, D01103, http://dx.doi.org/10.1029/2007jd008470 (2008) Article ADS CAS Google Scholar
* Friedl, M. A. et al. MODIS Collection 5 global land cover: algorithm refinements and characterization of new datasets. _Remote Sens. Environ._ 114, 168–182 (2010) Article ADS Google
Scholar * Center. for International Earth Science Information Network (CIESIN). _Gridded Population of the World, Version 3 (GPWv3): Population Count
Grid_http://sedac.ciesin.columbia.edu/gpw (Socioeconomic Data and Applications Center, CIESIN, Columbia University, 2011) Download references ACKNOWLEDGEMENTS We thank P. Tans and P. Bakwin,
who had the foresight to initiate a long-term high-precision greenhouse gas measurement laboratory in Sao Paulo, and D. Wickland, the NASA programme manager who initially supported this
effort. This work has been financed primarily by the UK Environmental Research Council (NERC) via the consortium grant ‘AMAZONICA’ NERC (NE/F005806/1) and also by the State of Sao Paulo
Science Foundation (FAPESP) via the ‘Carbon Tracker’ project (08/58120-3), and the EU via the 7th grant framework GEOCARBON project (grant number agreement 283080). NASA, NOAA and IPEN made
large contributions to the construction and maintenance of the GHG laboratory in Brazil. Intensive plot measurements were supported by NERC and the Moore Foundation via grants given to
RAINFOR. L.G.D., L.S.B., C.S.S.C., V.F.B. and A.M. were supported by CNPq, CAPES, Fapesp and IPEN, and O.L.P. by an ERC Advanced Grant. We thank measurement analysts and scientists at NOAA
for providing data, and the pilots who collected the air samples. Numerous people at NOAA, especially A. Crotwell, D. Guenther, C. Sweeney and K. Thoning, provided advice and technical
support for air sampling and measurements in Brazil. E. Dlugokencky provided data from Ascension Island and Ragged Point in Barbados. We also thank D. Galbraith for help with the
comprehensive forest census plot data and R. Brienen for comments. Finally, we acknowledge S. Denning for reviews of the manuscript. AUTHOR INFORMATION Author notes * L. V. Gatti, M. Gloor
and J. B. Miller: These authors contributed equally to this work. AUTHORS AND AFFILIATIONS * Instituto de Pesquisas Energéticas e Nucleares (IPEN)–Comissao Nacional de Energia Nuclear
(CNEN)–Atmospheric Chemistry Laboratory, 2242 Avenida Professor Lineu Prestes, Cidade Universitaria, Sao Paulo CEP 05508-000, Brazil , L. V. Gatti, L. G. Domingues, L. S. Basso, A.
Martinewski, C. S. C. Correia & V. F. Borges * School of Geography, University of Leeds, Woodhouse Lane, Leeds LS9 2JT, UK , M. Gloor & O. L. Phillips * Global Monitoring Division,
Earth System Research Laboratory, National Oceanic and Atmospheric Administration, 325 Broadway, Boulder, Colorado 80305, USA, J. B. Miller * Cooperative Institute for Research in
Environmental Sciences (CIRES), University of Colorado, Boulder, 80309, Colorado, USA J. B. Miller * Environmental Change Institute, School of Geography and the Environment, University of
Oxford, South Parks Road, Oxford OX1 3QY, UK , C. E. Doughty, Y. Malhi & L. O. Anderson * Center for Weather Forecasts and Climate Studies, Instituto Nacional de Pesquisas Espaciais
(INPE), Rodovia Dutra, km 39, Cachoeira Paulista CEP 12630-000, Brazil , S. Freitas & R. Braz * Remote Sensing Division, INPE (National Institute for Space Research), 1758 Avenida dos
Astronautas, São José dos Campos CEP 12227-010, Brazil, L. O. Anderson * Departamento de Ciencias Atmosfericas/Instituto de Astronomia e Geofisica (IAG)/Universidade de Sao Paulo, 1226 Rua
do Matao, Cidade Universitaria, Sao Paulo CEP 05508-090, Brazil, H. Rocha * Crew Building, The King’s Buildings, West Mains Road, Edinburgh EH9 3JN, UK , J. Grace * School of Tropical and
Marine Biology and Centre for Terrestrial Environmental and Sustainability Sciences, James Cook University, Cairns 4870, Queensland, Australia , J. Lloyd * Imperial College London, Silwood
Park Campus, Buckhurst Road, Ascot SL5 7PY, Berkshire, UK , J. Lloyd Authors * L. V. Gatti View author publications You can also search for this author inPubMed Google Scholar * M. Gloor
View author publications You can also search for this author inPubMed Google Scholar * J. B. Miller View author publications You can also search for this author inPubMed Google Scholar * C.
E. Doughty View author publications You can also search for this author inPubMed Google Scholar * Y. Malhi View author publications You can also search for this author inPubMed Google
Scholar * L. G. Domingues View author publications You can also search for this author inPubMed Google Scholar * L. S. Basso View author publications You can also search for this author
inPubMed Google Scholar * A. Martinewski View author publications You can also search for this author inPubMed Google Scholar * C. S. C. Correia View author publications You can also search
for this author inPubMed Google Scholar * V. F. Borges View author publications You can also search for this author inPubMed Google Scholar * S. Freitas View author publications You can also
search for this author inPubMed Google Scholar * R. Braz View author publications You can also search for this author inPubMed Google Scholar * L. O. Anderson View author publications You
can also search for this author inPubMed Google Scholar * H. Rocha View author publications You can also search for this author inPubMed Google Scholar * J. Grace View author publications
You can also search for this author inPubMed Google Scholar * O. L. Phillips View author publications You can also search for this author inPubMed Google Scholar * J. Lloyd View author
publications You can also search for this author inPubMed Google Scholar CONTRIBUTIONS L.V.G., M.G., J.B.M., J.L., H.R., O.L.P., Y.M. and J.G. conceived the basin-wide measurement programme
and approach. M.G., J.B.M. and L.V.G. wrote the paper. C.E.D. and Y.M. analysed and contributed the data of the comprehensive biometric forests census plots. S.F., R.B., L.O.A., L.G.D. and
L.S.B. helped with data analysis. V.F.B., C.S.C.C. and A.M. helped with greenhouse gas concentration analysis. All co-authors commented on the manuscript. CORRESPONDING AUTHORS
Correspondence to L. V. Gatti, M. Gloor or J. B. Miller. ETHICS DECLARATIONS COMPETING INTERESTS The authors declare no competing financial interests. EXTENDED DATA FIGURES AND TABLES
EXTENDED DATA FIGURE 1 AMAZON CLIMATE ANOMALIES IN 2010 AND 2011. A, Monthly Southern Hemisphere Amazon basin precipitation from the Global Precipitation Climatology Project (2.5° × 2.5°)
for the Southern Hemisphere Amazon basin (accessed from www.esrl.noaa.gov/psd/)44 The red line with diamond data points shows the monthly mean precipitation; the black solid line is the
1981–2010 mean and its standard deviation (dashed black lines) for each month. The grey solid line is the annual mean and its standard deviation (dashed grey lines) for 1981–2010 and the
filled red circles are annual averages for 2010 and 2011. B, Precipitation anomalies in 2010 (left) and 2011 (right) calculated as the annual mean differences from the 1981–2010 averages. C,
Monthly Southern Hemisphere Amazon basin temperature from the Global Historical Climatology Network version 2 and the Climate Anomaly Monitoring System (0.5° × 0.5°) for the Southern
Hemisphere Amazon basin (accessed from www.esrl.noaa.gov/psd/)45. The red line with diamond data points shows the monthly mean temperature; the black solid line is the 1981–2010 mean and its
standard deviation (dashed black lines) for each month. The grey solid line is the annual mean and its standard deviation (dashed grey lines) for 1981–2010 and the filled red circles are
annual averages for 2010 and 2011. D, Temperature anomalies in 2010 (left) and 2011 (right) calculated as the annual mean differences from the 1981–2010 averages. EXTENDED DATA FIGURE 2 CO
CONCENTRATIONS IN 2010 AND 2011. Data are grouped into above and below 1.5 km height above ground measurements for four sites. p.p.b., parts per billion. EXTENDED DATA FIGURE 3 AIR PARCEL
PATHS TO MEASUREMENT SITES. Mean seven-day back-trajectories from measurement sites (from FLEXPART) during the 2010 dry season months and fire hotspots from ATSR-WFA, from the Data User
Element of the European Space Agency29. EXTENDED DATA FIGURE 4 FLUX UNCERTAINTY STATISTICS. A, Sensitivity of flux estimates to profile extrapolation height (months and years are abbreviated
below). Comparison of quarterly flux estimates calculated by mass balance of air column up to the top level of measurements (4.4 km a.s.l.), up to 10 km and 8 km a.s.l. during the dry and
12 km during the wet season. B, Distributions of annual net carbon flux estimates obtained with Monte Carlo uncertainty propagation (described above) and 68 and 95 percentile intervals of
the mean. EXTENDED DATA FIGURE 5 COMPREHENSIVE FOREST PLOT MEASUREMENT RESULTS. A, Plant carbon expenditure (NPP plus autotrophic respiration, an upper bound on gross primary production) for
14 1-hectare plots where all NPP and autotrophic respiration components are measured. Eight 1-hectare plots did not experience drought (blue line), six experienced drought, three in the dry
lowlands (red line), and three in humid lowland regions ±standard error (black line). The black dashed line is the average seasonal value for 2009 (a typical year) repeated through 2010 and
2011. The hatched bar is the mean drought period for the six drought sites, based on CWD. B, Meteorology data from drought plots. Data from Skye instruments meteorology stations from
January 2009 to December 2011 near the drought plots (black) for (top left) cumulative water deficit (millimetres per month) and (bottom left) air temperature (in °C). On the right, both
plots are the anomalies for the same variable directly to its left with negative values representing a lower than average temperature or precipitation. The hatched bar highlights the
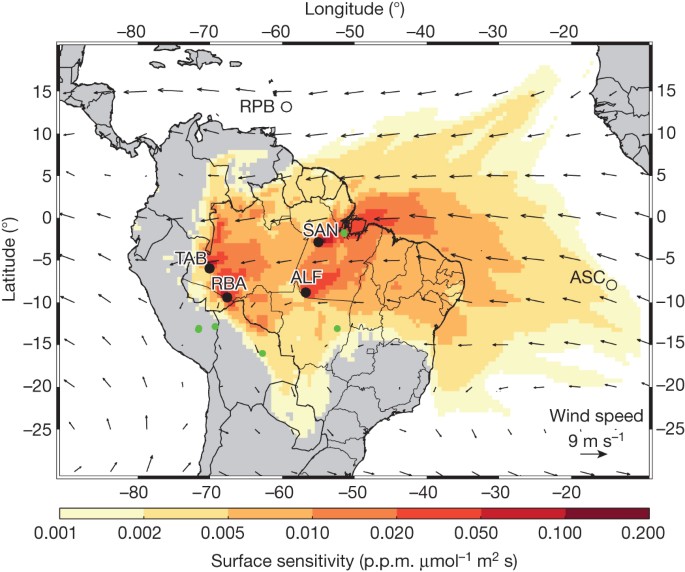
approximate period of the 2010 drought in the region based on CWD anomaly. C, Intensive carbon balance forest census sites. EXTENDED DATA FIGURE 6 SENSITIVITY OF SITE ATMOSPHERIC CO2
CONCENTRATIONS TO SURFACE FLUXES. A, Sensitivities calculated separately for the four sites (clockwise from the lower left) TAB, RBA, SAN and ALF, and for 2010 calculated with
back-trajectory ensembles from the FLEXPART Lagrangian particle dispersion model. The star symbol represents the centroid of the footprint: that is, the point at which footprint
contributions are equal to the north and south, and east and west. Note that there is significant overlap of footprints for the 2010 annual mean. B, As for A, but displaying only the
tropical forest biome fraction. EXTENDED DATA FIGURE 7 GEOGRAPHICAL SUMMARY FOR SOUTH AMERICA. A, Land cover map of South America from remote sensing (MODIS, Moderate Resolution Imaging
Spectroradiometer) obtained from http://modis-land.gsfc.nasa.gov/landcover.html (ref. 46). Black arrows represent average climatological wind speed and direction in June, July and August
(from NCEP) averaged between the surface and 600 mbar. B, Population density in South America in the year 2005 (ref. 47). EXTENDED DATA FIGURE 8 SF6 AND AMAZON BACKGROUND CONCENTRATION
CALCULATION. A, SF6 at RPB and ASC and the ‘ASC fraction’ (_f_ASC). Data shown for all Amazonian sites. B, CO2 at RPB and ASC and background values estimated based on in situ SF6
concentrations. Small diamonds (RPB and ASC) represent flask pair averages and thin lines are smooth curve fits to the data33. Filled circles (SAN, ALF, TAB and RBA) represent scalar
background values for each Amazonian site determined from the smooth curve fits to ASC and RPB and SF6 values according to equations (4) and (5). POWERPOINT SLIDES POWERPOINT SLIDE FOR FIG.
1 POWERPOINT SLIDE FOR FIG. 2 POWERPOINT SLIDE FOR FIG. 3 POWERPOINT SLIDE FOR FIG. 4 RIGHTS AND PERMISSIONS Reprints and permissions ABOUT THIS ARTICLE CITE THIS ARTICLE Gatti, L., Gloor,
M., Miller, J. _et al._ Drought sensitivity of Amazonian carbon balance revealed by atmospheric measurements. _Nature_ 506, 76–80 (2014). https://doi.org/10.1038/nature12957 Download
citation * Received: 24 May 2013 * Accepted: 12 December 2013 * Published: 05 February 2014 * Issue Date: 06 February 2014 * DOI: https://doi.org/10.1038/nature12957 SHARE THIS ARTICLE
Anyone you share the following link with will be able to read this content: Get shareable link Sorry, a shareable link is not currently available for this article. Copy to clipboard Provided
by the Springer Nature SharedIt content-sharing initiative