- Select a language for the TTS:
- UK English Female
- UK English Male
- US English Female
- US English Male
- Australian Female
- Australian Male
- Language selected: (auto detect) - EN
Play all audios:
ABSTRACT The rare earth Er3+ and Yb3+ codoped system is the most attractive for showcasing energy transfer upconversion. This system can generate green and red emissions from Er3+ under
infrared excitation of the sensitizer Yb3+. It is well known that the red-emitting state can be populated from the upper green-emitting state. The contribution of multiphonon relaxation to
this population is generally considered important at low excitation densities. Here, we demonstrate for the first time the importance of a previously proposed but neglected mechanism
described as a cross relaxation energy transfer from Er3+ to Yb3+, followed by an energy back transfer within the same Er3+–Yb3+ pair. A luminescence spectroscopy study of cubic Y2O3:Er3+,
Yb3+ indicates that this mechanism can be more efficient than multiphonon relaxation, and it can even make a major contribution to the red upconversion. The study also revealed that the
energy transfers involved in this mechanism take place only in the nearest Er3+–Yb3+ pairs, and thus, it is fast and efficient at low excitation densities. Our results enable a better
understanding of upconversion processes and properties in the Er3+–Yb3+ system. SIMILAR CONTENT BEING VIEWED BY OTHERS THERMALLY BOOSTED UPCONVERSION AND DOWNSHIFTING LUMINESCENCE IN
SC2(MOO4)3:YB/ER WITH TWO-DIMENSIONAL NEGATIVE THERMAL EXPANSION Article Open access 19 April 2022 UP-CONVERSION EMISSION IN TRANSITION METAL AND LANTHANIDE CO-DOPED SYSTEMS: DIMER
SENSITIZATION REVISITED Article Open access 07 February 2023 FULL-COLOR TUNING IN MULTI-LAYER CORE-SHELL NANOPARTICLES FROM SINGLE-WAVELENGTH EXCITATION Article Open access 11 March 2025
INTRODUCTION Infrared to visible upconversion luminescence has been extensively studied for its fundamental value1,2,3 and its various potential applications in upconversion lasers,4
bioimaging,5 _etc._ The codoping of Er3+ and a high concentration of sensitizer Yb3+ forms the most attractive energy transfer upconversion (ETU) system. Under infrared (980 nm) excitation
of the sensitizer Yb3+, this system can generate green and red upconversions originating from the 4S3/2→4I15/2 and 4F9/2→4I15/2 transitions of Er3+, respectively. Unlike the green
upconversion, the red upconversion benefits from several possible excitation mechanisms.6,7 Multiphonon relaxation (MPR) from the upper 4S3/2 state and ETU from the lower intermediate 4I13/2
state are generally considered dominant at low infrared excitation densities because other mechanisms involving three photon processes6,7 become important only at high infrared excitation
densities,8 which is not the topic of this work. The MPR is not the only mechanism for populating the 4F9/2 from the 4S3/2; a non-MPR mechanism was proposed earlier,8 but it has not been
considered important since then. This mechanism involves two sequential energy transfers between Er3+ and Yb3+. The first step is a well-known cross-relaxation (CR) energy transfer from Er3+
in the 4S3/2 excited state (4S3/2→4I13/2) to Yb3+ in the ground state (2F5/2←2F7/2),9 resulting in the excitation of Er3+ 4I13/2 and Yb3+ 2F5/2. The subsequent step is an energy back
transfer from the Yb3+ (2F5/2→2F7/2) excited by the CR to Er3+ in the 4I13/2 state (4F9/2←4I13/2) to promote the excitation of Er3+ 4F9/2. Hence, the CR can be divided into two parts: one is
followed by the energy back transfer, CRB, and the other is not followed by the energy back transfer, CRNB. The Yb3+-induced green emission quenching of Er3+ by the CR has been widely
recognized.9,10 However, the population of the 4F9/2 by the CRB from the 4S3/2 has rarely been studied or valued in both photoluminescence (PL) and upconversion luminescence (UCL). In this
article, we report an observation of the CRB in cubic Y2O3: Er3+, Yb3+. We find the CRB can be more efficient than MPR and can even make a major contribution to the red UCL. To the best of
our knowledge, this is the first time that the CRB has been found to be important to the red emission both in the PL and UCL of the Er3+–Yb3+ system. MATERIALS AND METHODS SAMPLE PREPARATION
The cubic Y2O3:0.002Er3+, _x_Yb3+ (_x_=0, 0.04, 0.1, 0.2, 0.3) samples were prepared by the normal firing precursor method.2 The firing precursor is more favorable to achieve uniform and
highly crystallized samples than the traditional solid-state reaction. The starting aqueous solutions, Y(NO3)3,Yb(NO3)3, and Er(NO3)3, with corresponding mole ratios were mixed and stirred
vigorously to form a homogeneous solution. The samples were obtained after being dried at 100 °C for 6 h and then calcined at 1600 °C for 6 h. The expression of Y2O3:0.002Er3+, _x_Yb3+ in
the present paper means the formula Y2−0.002−_x_Er0.002Yb_x_O3. The low Er3+ and high Yb3+ concentrations applied in this work were used to achieve a real ETU system and suppress the
interaction among Er3+ ions for simplifying the ETU processes. SPECTROSCOPY MEASUREMENTS Steady state PL and UCL spectra were measured using an EI-FS920 fluorimeter with a xenon lamp as an
excitation source for PL and a CW 980 nm laser diode as an excitation source for UCL. The decay curves of PL and UCL were detected using a Triax 550 spectrometer (Jobin-Yvon) and recorded by
a Tek-tronix digital oscilloscope (TDS 3052), while a 10 ns pulsed laser with tunable wavelengths from an optical parametric oscillator pumped by a Nd:YAG laser (spectra-physics, GCR 130)
was used as an excitation source. In energy level lifetime measurements, the excitation wavelengths were tuned to 520 nm for Er3+ 4S3/2, 650 nm for Er3+ 4F9/2 and 4I11/2, 1480 nm for Er3+
4I13/2 and 980 nm for Yb3+ 2F5/2. The lifetime is defined as the area under the decay curve with normalized initial intensity. The UCL spectra under pulse excitation at 980 nm were detected
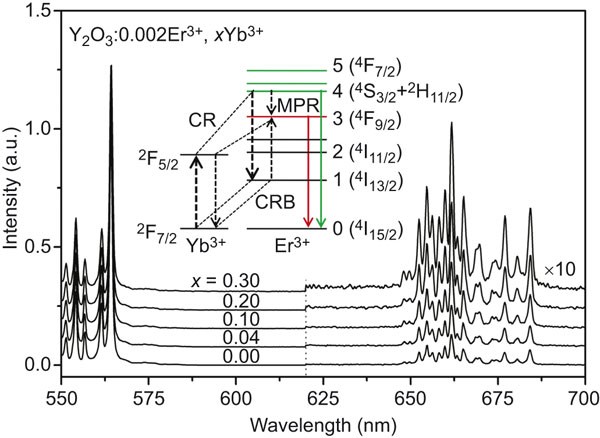
using a USB4000 spectrometer (Ocean Optics), which gives the time-integrated intensities. RESULTS AND DISCUSSION OBSERVATION OF THE CRB IN PL Figure 1 shows PL spectra of Y2O3:0.002Er3+,
_x_Yb3+ under 520 nm excitation of Er3+ 2H11/2, which can rapidly relax to the 4S3/2 due to their proximity in energy. One can observe that the red (660 nm) to green (560 nm) emission
intensity ratio (R/G) increases considerably with increasing _x_. A similar result upon Er3+ 4F7/2 excitation with 488 nm was also observed in Y2O3:Er3+, Yb3+ nanocrystals,11 and an
interaction between two excited Er3+ ions (4F7/2→4F9/2 and 4F9/2←4I11/2)7 was considered the main excitation mechanism of the red-emitting 4F9/2 state. In the present work, the 4F7/2 is not
excited and the Er3+ concentration is low, so the above mechanism is not feasible. We found through experimentation that the R/G ratio remains unchanged if La3+ or Lu3+is doped instead of
Yb3+, indicating that the 4S3/2–4F9/2 MPR rate hardly changes with rare earth doping. Therefore, we attribute the Yb3+-induced R/G increase to the effect of CRB, which benefits from
well-matched energy level structures between Er3+ and Yb3+, as sketched in the insert to Figure 1. The CRB may take place within the same Er3+–Yb3+ pair, meaning that the Yb3+ ion excited by
the CR transfer from Er3+ transfers its energy back again to the same Er3+ ion. The CRB rate in this case is independent of excitation densities, similar to the MPR. If the CRB takes place
not within the same Er3+–Yb3+ pair, i.e., the excitation energy of Yb3+ is not retransferred to the same Er3+ but transferred to any other Er3+ ion in the 4I13/2 state, then the CRB rate in
this case is dependent on the concentration of the other Er3+ ions and thus dependent on excitation densities. Therefore, the CRB may become important only at high excitation densities. In
the present work, the Yb3+-induced R/G increase can be observed under weak 520 nm excitation using a grating monochromator with a xenon lamp. We found that the enlarged R/G ratio in the
presence of Yb3+ is independent of excitation densities using the xenon lamp as an excitation source. Based on the CRB models mentioned above, we consider that the CRB takes place within the
same Er3+–Yb3+ pair in the samples in this work. Time evolutions of PL are measured for distinguishing the CRB from the MPR, as shown in Figure 2. With increasing _x_, the appreciable
shortening of the 4S3/2 lifetime (_τ_4) (Figure 2a) is due to the CR,9,10 and the small shortening of the 4F9/2 lifetime (_τ_3) (Figure 2b) is due to weak coupling12 of Er3+ 4F9/2→4I15/2
with Yb3+ 2F5/2←2F7/2. In the time evolution of the red emission after the 4S3/2 is populated (Figure 2c), we find that the samples containing Yb3+ appear to undergo a fast build-up process,
unlike the Yb3+-free sample that appears as a normal slow rising edge.13 Accordingly, the time evolution patterns in the presence of Yb3+ shown in Figure 2c are the combined patterns of the
fast build-up component and the slow build-up component. If one normalizes the initial emission intensity of the fast build-up component (Figure 2c) and denotes the total area under the
time evolution curve by _T_3, the proportion of the emitted red photons by the fast build-up component of the total emitted red photons can be calculated by _τ_3/_T_3. This proportion is
found to be consistent with the proportion of the increment in the R/G ratio (Table 1), written as _α_=1−(_τ_3/_τ_3,0)(R/G)0/(R/G), where the subscript 0 identifies the case of _x_=0 and
(_τ_3/_τ_3,0)(R/G)0 is the R/G ratio contributed only by MPR in the presence of Yb3+. The result indicates that the CRB is a fast process. Accordingly, there must be a fast CR. However, a
corresponding fast decay of the green emission is not detected (Figure 2a). We thus deduce that the fast green emission may be completely quenched by the fast CR. This deduction is further
evidenced in the following section. EFFICIENCY OF THE CRB IN PL After the 4S3/2 is populated upon 520 nm excitation, the 4S3/2 undergoes depopulation by radiative transition, MPR, CRNB and
CRB, with respective efficiencies of _η_r4, _η_MPR43, _η_CRNB and _η_CRB. Figure 3 shows the comparison of PL spectra under 520 nm excitation with that under 650 nm excitation of the 4F9/2.
Here, the red intensity under 650 nm excitation is normalized to that under 520 nm excitation. Under 520 nm excitation, one can find that the green intensity decreases rapidly with
increasing _x_, followed by simultaneous intensity enhancement of Er3+ 4I13/2→4I15/2 emission at 1530 nm and Yb3+ 2F5/2→2F7/2 emission at 1040 nm compared to that under 650 nm excitation.
The feature is an explicit indication of the CRNB process. In the absence of Yb3+, the Er3+ 4I11/2→4I15/2 emissions for both 520 nm and 650 nm excitations can be observed at 1000 nm; they
coincide because the population of 4I11/2 by 4S3/2→4I9/2, 4I11/2 radiative transitions for 520 nm excitation is very small with respect to that from the 4F9/2 by cascade MPR. In the presence
of Yb3+, the Er3+ 4I11/2→4I15/2 emission is too weak to be identified, and instead, the Yb3+ emission is dominant. This is due to a highly efficient energy transfer from Er3+ 4I11/2 to Yb3+
2F5/2,14 which is also evidenced by the very weak 1530 nm emission of Er3+ under 650 nm excitation. In addition, one may find that the Yb3+ emission intensities decrease with increasing _x_
in the _x_ range of 0.1–0.4 for 520 nm excitation. The decline is due to concentration quenching because the critical concentration of Yb3+ was observed to be 7.36% in the Y2O3 host.15 We
evaluate _η_r4, _η_MPR43, _η_CRNB and _η_CRB based on the observed increase in the Er3+ 1530 nm emission, Yb3+ 1040 nm emission and Er3+ R/G ratio for 520 nm excitation. Considering the
distinct increment (_I_1−_i_1) in 1530 nm emission intensity in the presence of Yb3+, one may also observe a small increase for _x_=0. The small increase is attributed to the feeding by the
4S3/2→4I13/2 radiative transition, which has a big branch ratio (_β_=0.27).16 Hence both the CRNB and the 4S3/2→4I13/2 radiative transition contribute to the increase. Regarding the
experimentally observed _x_-independent 4I13/2 lifetime, we have, as described in Supplementary Equations (S1)–(S4) where _I__i_ and _i__i_ are emission intensities from the _i_th state of
Er3+ upon 520 nm and 650 nm excitations, respectively. These emission intensities on the right side of Equation (1) are dependent on _x_. For the increment (_I_d−_i_d) in Yb3+ emission
intensity, the CRNB is the only contributor, while the rest intensity (_i_d) is populated by quasi-resonant energy transfer from Er3+ 4I11/2 with a transfer efficiency close to 1 due to the
high Yb3+ concentration. The 4I11/2 can be populated from the 4F9/2 _via_ the 4I9/2 by cascade MPR with an efficiency of almost 100%, regarding a very short 4F9/2 lifetime (approximately 20
μs) compared with its radiative lifetime (600 μs).16 As a result, the population of the 4F9/2 by the MPR and the CRB from the 4S3/2 finally and completely reaches the 4I11/2. Hence, the
excitation source of the rest Yb3+ emission is the MPR and the CRB from the 4S3/2. Then, we have where the subscript d denotes Yb3+. The red emission is populated by MPR and CRB from the
4S3/2, so the R/G ratios simply satisfy Using Equations (1)–(3) with _η_r4+_η_MPR43+_η_CRNB+_η_CRB=1, we calculated the efficiencies, as shown in Figure 4a. We obtained _η_MPR43/_η_r4=2.08,
which yields _η_r4=32% for cubic Y2O3:Er3+. The measured green PL intensities (square) follow the tracks of _η_r4 well, but it decreases faster than _τ_4 with increasing _x_ (Table 1). This
feature further implies the existence of an undetected fast decay in the green emission, as indicated in the above section, like the case of the Perrin model.17 We may consider an ‘active
sphere’ centered at an Er3+ ion so that its green emission can be completely quenched by a Yb3+ ion located within the sphere through the CR. If the number of the effective cation sites
within the sphere is _n_, the fraction (_f_) of Er3+ ions that have no Yb3+ in the sphere satisfies the binomial distribution: _f_=(1−_x_/2)_n_. Considering that the green luminescence yield
(_I_4 or _η_r4) can be regarded as the area under its decay curve including the undetected fast component, then _f_ can be obtained either by (_I_4/_I_4,0)(_τ_4,0/_τ_4) or
(_η_r4/_η_r4,0)(_τ_4,0/_τ_4) from the decay picture of the green emission containing a fast component with a lifetime close to 0 and a slow one with a lifetime of _τ_4, weighted by 1−_f_ and
_f_, respectively, as described in Supplementary Fig. S1 and Equation (S5). In cubic Y2O3, there are two Y sites with respective _C_3_i_ and _C_2 symmetries. The _C_3_i_ has an inversion
center on this site; the 4_f_–4_f_ transition of a rare earth ion is forbidden. Therefore, only the _C_2 site is effective. A _C_2 site has four of the first nearest _C_2 sites, four of the
second nearest _C_2 sites and six of the next nearest _C_2 sites. The fitting results point to _n_=8, as shown in Figure 4b, indicating that the green emission of an Er3+ can be completely
quenched only by an Yb3+ located in the nearest site of the Er3+ ion. As a result, the nearest Er3+–Yb3+ pairs exhibit completely quenched green emission and produce the undetected fast
decay of the green emission. As we have observed, the CRB is a fast process; thus, the CRB takes place only within the nearest Er3+–Yb3+ pairs. Of course, the occurrence of a fast CRNB is
also expected in the nearest Er3+–Yb3+ pairs. Accordingly, the distant Er3+–Yb3+ pairs can only perform the slow CRNB to reduce _τ_4. In Figure 4a, over 30% of the CR is the CRB upon 520 nm
excitation, and the CRB becomes more important than the MPR for populating the red-emitting state from the green state as _x_≥0.1. The efficient CRB benefits from the nearest Er3+–Yb3+ pairs
that can compete with the energy transfer from the Yb3+ ions excited by the CR to other Yb3+ ions outside the pairs. The nearest Er3+–Yb3+ pair ensures that the CRB takes place within the
pair because the energy back transfer from Yb3+ to other Er3+ undergoes a longer interaction distance due to the low Er3+ concentration used in this work. Hence, no dependency of the CRB on
excitation densities is observed in the present work. The Perrin model, like CRB, may be governed by the exchange mechanism described by Inokuti and Hirayama.17 In CRB, the CR transfer from
Er3+ (4S3/2→4I13/2) to Yb3+ (2F5/2←2F7/2) and the back transfer from Yb3+ (2F5/2→2F7/2) to Er3+ (4F9/2←4I13/2) suffer from an energy mismatch of ∼1700 cm−1 and ∼1500 cm−1, respectively,
which is more than twice as large as the cutoff phonon energy of 600 cm−1 in Y2O3. The performance of the energy transfers thus requires emission of two or three phonons to make up for the
large energy mismatch. In spite of requirement of several phonons, the high Yb3+ concentration and the nearest Er3+–Yb3+ pairs make the transfers efficient. EFFECT OF THE CRB ON UCL Figure 5
shows the UCL spectra for Y2O3:0.002Er3+, 0.1Yb3+ upon pulse and CW infrared (980 nm) excitations. For comparison, its PL spectrum is also presented. The phenomenon11,18,19,20 that the R/G
ratio in PL is much less than that in UCL is evident. Ignoring the CRB, it was naturally deduced from the phenomenon that the ETU from 4I13/2 makes the major contribution to the red
UCL.18,19 If the CRB is operative, the above deduction could be possibly invalid because of the following reasons: the nearest Er3+–Yb3+ pairs can be preferentially excited to the Er3+ 4S3/2
state by two sequential energy transfers from Yb3+ in ETU, as shown in the insert to Figure 5. Meanwhile, the CRB enables the nearest Er3+–Yb3+ pairs to only have a red emission in the
visible spectral region. In the PL measurement, however, each Er3+ ion has the same probability to be excited to the 4S3/2 state by ground state absorption. Based on the analysis above, a
much smaller R/G ratio of PL than that of UCL is still achievable if the CRB makes the major contribution to the red UCL. In other words, the observation of a much smaller R/G ratio for PL
than for UCL cannot exclude the major role of the 4S3/2 state in populating the red-emitting state in the upconversion of the Er3+–Yb3+ system. In our experiment, the PL and UCL temporal
behaviors of Y2O3:0.002Er3+, 0.1Yb3+ (Figure 6) demonstrate that the 4F9/2 is populated mainly from 4S3/2 in ETU, as analyzed below. From Figure 6, the Yb3+ emission decays exponentially
(with a decay time of _τ_d=840 μs), indicating the rapid diffusion limited energy transfer. The decay time of the green UCL is 391 μs, and that of the red is 412 μs. These UCL decay times
are much longer than _τ_4 (66 μs) and τ3 (20.9 μs) (Table 1), exhibiting the typical effect of ETU. Thus, the UCL decay function is mainly determined by the product of the decay functions of
the Yb3+ 2F5/2 and Er3+ intermediate states. The green UCL decay time approaches _τ_d/2, reflecting that Er3+ 4I11/2, as the intermediate state for the green upconversion, has the same
decay time as Yb3+ 2F5/2 because the two levels are thermally coupled in case of rapid energy transfer between them, as predicated earlier.14 The approximation of the red UCL decay time to
the green one indicates that the 4F9/2 is populated mainly from the 4S3/2 under pulse infrared excitation; otherwise, the red could have a decay time close to _τ_d (840 μs) because of the
quite long lifetime (_τ_1=8.4 ms) of the intermediate 4I13/2 state. Now, we want to determine if the 4F9/2 is still populated mainly from the 4S3/2 under CW infrared excitation. In Figure 5,
one may find that the R/G ratio in UCL for CW excitation, (R/G)UCL@CW, is larger than that for pulse excitation, (R/G)UCL@pulse. The smaller (R/G)UCL@pulse arises from the low build-up
process of the 4I13/2 state (Figure 6), as described in Supplementary Equation (S10), which slows down the ETU from the 4I13/2 to the 4F9/2 after pulse infrared excitation. Taking the
different R/G ratios into account, the percentages of the red component _R_4, populated from the 4S3/2, and _R_1, from the 4I13/2, can be evaluated. If the 4S3/2 and the 4F9/2 states are
populated under infrared excitation in ETU, we denote the mean emitting efficiencies of the two states by _η_G and _η_R, respectively. While the mean depopulating efficiency from the 4S3/2
to the 4F9/2 _via_ MPR and the CRB is denoted by _η_43, the R/G ratio in UCL is where _η_G, _η_R and _η_43 are unchanged for CW or pulse infrared excitations. In view of the high Yb3+ and
low Er3+ concentrations, we assume here the simplest possible model; (i) ETU undergoes the rapid diffusion limited energy transfer from Yb3+ that can be described by an average energy
transfer rate; (ii) the ground and excited states absorption of Er3+ is neglected. We also assume the 4F7/2 can rapidly and completely relax down to the 4S3/2 state due to their proximity in
energy. From the diagram of ETU processes inserted in Figure 5, the population flow from the 4I11/2 to the 4F7/2 is _C_d5_n_d_n_2 and that from the 4I13/2 to the 4F9/2 is _C_d3_n_d_n_1.
Under CW excitation, the population flow is time independent, and thus, _R_4@CW=_η_R_η_43_C_d5_n_d_n_2 and _R_1@CW=_η_R_C_d3_n_d_n_1, where _C_d_i_ is the coefficient for energy transfer
from donor Yb3+ to the _i_th state of Er3+, and _n_d and _n__i_ are populations of Yb3+ 2F5/2 and Er3+ in the _i_th state, respectively. Then, the _R_1/_R_4 ratio for CW infrared excitation
is expressed as where _W_21 is the sum of the 4I11/2–4I13/2 radiative and MPR rates, which satisfies _W_21_n_2=_n_1/_τ_1 for a steady state excitation. Under pulse infrared excitation of
Yb3+, we detect the upconversion luminescence yield over time. Based on the rate equations for describing ETU in the Er3+–Yb3+ system, as in Supplementary Equations (S7)–(S13), we obtain
From Figure 5, the R/G ratio in UCL for CW excitation is 1.2 times as large as that for pulse excitation, Combining Equations (4)–(7) with _τ_d=840 μs and _τ_1=8.4 ms gives
(_R_1/_R_4)@pulse=0.02 and (_R_1/_R_4)@CW=0.22 for Y2O3:0.002Er3+, 0.1Yb3+. These values mean that only 2% of the red UCL is populated from the 4I13/2 and 98% from the 4S3/2 under pulse
infrared excitation, and for CW infrared excitation, 18% of the red UCL is populated from the 4I13/2 and 82% from the 4S3/2. The main role of the 4S3/2 in populating the red UCL reflects a
strong CRB. Meanwhile, the small contribution of the ETU from the 4I13/2 is partially due to a small value of _C_d3/_C_d5 that is calculated to be 0.124_η_43 using Equation (5). In this
calculation, a _W_21 of 218 s−1 is used, which is determined from our measured 4I11/2 lifetime (_τ_2,0) of 2.73 ms in Y2O3:0.002Er3+ and the reported16 intrinsic 4I11/2 lifetime of 6.03 ms
and 4I11/2→4I13/2 radiative branch ratio of 0.108. The small _C_d3/_C_d5 ratio is well understood in view of a large energy mismatch (∼1500 cm−1) in the transfer from Yb3+(2F5/2→2F7/2) to
Er3+(4F9/2←4I13/2) relating to _C_d3, while the energy transfer from Yb3+(2F5/2→2F7/2) to Er3+(4F7/2←4I11/2) relating to _C_d5 is quasi-resonant. Obviously, a high Yb3+ concentration and
preferential excitation of the nearest Er3+–Yb3+ pairs in ETU can promote the CRB process. Meanwhile, increasing the population ratio of Er3+ 4I11/2 to 4I13/2 is beneficial to ETU from the
4I11/2 to the 4F7/2, and it thus can promote the contribution of the CRB to the red UCL against the ETU from the 4I13/2 to the 4F9/2. Therefore, the host material with low cutoff phonon
energy likely has a pronounced CRB process like Y2O3. However, this population ratio is usually reduced in nanomaterials because the 4I11/2–4I13/2 MPR is strongly enhanced by coupling with
OH− groups on the large surface of the nanomaterials.21 CONCLUSIONS We observed a pronounced CRB process for populating the Er3+ red-emitting state from its green state in cubic Y2O3:Er3+,
Yb3+. We found the CRB can be more efficient than MPR and can even make the major contribution to the red emission in both PL and UCL. The CRB takes place only in the nearest Er3+–Yb3+
pairs, and thus, it is a fast and efficient process at low excitation densities. The present research methods may be applied to a general Er3+–Yb3+ system, and the identification of the
importance of the CRB in other material hosts is expected. REFERENCES * Auzel F . Upconversion and anti-stokes processes with f and d ions in solids. _Chem Rev_ 2004; 104: 139–174. Article
Google Scholar * Li J, Zhang J, Hao Z, Zhang X, Zhao J _et al_. Intense upconversion luminescence and origin study in Tm3+/Yb3+ codoped calcium scandate. _Appl Phys Lett_ 2012; 101: 121905.
Article ADS Google Scholar * Qin W, Liu Z, Sin C, Wu C, Qin G _et al_. Multi-ion cooperative processes in Yb3+ clusters. _Light Sci Appl_ 2014; 3: e193, doi: 10.1038/lsa.2014.74. Article
Google Scholar * Mobert PEA, Heumann E, Huber G, Chai BHT . Green Er3+:YLiF4 upconversion laser at 551 nm with Yb3+ codoping: a novel pumping scheme. _Opt Lett_ 1997; 22: 1412–1414.
Article ADS Google Scholar * Zijlmans H, Bonnet J, Burton J, Kardos K, Vail T _et al_. Detection of cell and tissue surface antigens using up-converting phosphors: a new reporter
technology. _Anal Biochem_ 1999; 267: 30–36. Article Google Scholar * Uitert LG, Levinstein HJ, Grodkiewicz WH . Infrared stimulable rare earth oxy-halide phosphors: their synthesis,
properties and applications. _Mater Res Bull_ 1969; 4: 381–389. Article Google Scholar * Wittke JP, Ladany I, Yocom PN . Y2O3:Yb:Er—new red-emitting infrared-excited phosphor. _J Appl
Phys_ 1972; 43: 595–600. Article ADS Google Scholar * Sommerdijk JL, Bril A . Visible luminescence of Er3+, Yb3+ under IR excitation. In: Williams F, editor. _Luminescence of Crystals,
Molecules and Solutions_. New York: Plenum Press; 1973, p 86–91. Chapter Google Scholar * Ostermayer FW . Preparation and properties of infrared-to-visible conversion phosphors. _Metall
Trans_ 1971; 2: 747–755. Article Google Scholar * Solis D, Rosa E, Meza O, Diaz-Torres LA, Salas P _et al_. Role of Yb3+ and Er3+ concentration on the tunability of green–yellow–red
upconversion emission of codoped ZrO2:Yb3+–Er3+ nanocrystals. _J Appl Phys_ 2010; 108: 023103. Article ADS Google Scholar * Vetrone F, Boyer JC, Capobianco JA, Speghini A, Bettinelli M .
Significance of Yb3+ concentration on the upconversion mechanisms in codoped Y2O3:Er3+,Yb3+nanocrystals. _J Appl Phys_ 2004; 96: 661–667. Article ADS Google Scholar * Kuroda H, Shionoya
S, Kushida T . Mechanism and controlling factors of infrared to visible conversion process in Er3+ and Yb3+ doped phosphors. _J Phys Soc Jpn_ 1972; 33: 125–141. Article ADS Google Scholar
* Weber MJ . Selective excitation and decay of Er3+ fluorescence in LaF3 . _Phys Rev_ 1967; 156: 231–241. Article ADS Google Scholar * Ziel JP, Uitert LG, Grodkiewicz WH . Factors
controlling infrared pumped visible emission of Yb3+–Er3+ in the scheelites. _J Appl Phys_ 1970; 41: 3308–3315. Article ADS Google Scholar * Auzel F, Baldacchini G, Laversenne L, Boulon G
. Radiation trapping and self-quenching analysis in Yb3+, Er3+, and Ho3+ doped Y2O3 . _Opt Mater_ 2003; 24: 103–109. Article ADS Google Scholar * Sardar DK, Nash KL, Yow RM, Gruber JB .
Absorption intensities and emission cross section of intermanifold transition of Er3+ in Er3+:Y2O3 nanocrystals. _J Appl Phys_ 2007; 101: 113115. Article ADS Google Scholar * Inokuti M,
Hirayama F . Influence of energy transfer by the exchange mechanism on donor luminescence. _J Chem Phys_ 1965; 43: 1978–1989. Article ADS Google Scholar * Sommerdijk JL, Wanmaker WL,
Verriet JG . Infrared excited visible luminescence in oxidic lattices doped with Yb3+ and Er3+. _J Lumin_ 1971; 4: 404–416. Article Google Scholar * Sommerdijk JL . On the excitation
mechanism of the infrared excited visible luminescence in Yb3+, Er3+ doped fluorides. _J Lumin_ 1971; 4: 441–449. Article Google Scholar * Singh V, Rai VK, Haase M . Intense green and red
upconversion emission of Er3+,Yb3+ co-doped CaZrO3 obtained by a solution combustion reaction. _J Appl Phys_ 2012; 112: 063105. Article ADS Google Scholar * Eilers H . Effect of
particle/grain size on the optical properties of Y2O3:Er, Yb. _J Alloys Compd_ 2009; 474: 569–572. Article Google Scholar Download references ACKNOWLEDGEMENTS This work has been supported
by NSFC (Grants No. 10834006, 51172226, 61275055 and 11274007). _NOTE: ACCEPTED ARTICLE PREVIEW ONLINE 19 NOVEMBER 2014_ AUTHOR INFORMATION AUTHORS AND AFFILIATIONS * State Key Laboratory of
Luminescence and Applications, Changchun Institute of Optics, Fine Mechanics and Physics, Chinese Academy of Sciences, Changchun, China Jiahua Zhang, Zhendong Hao, Jing Li, Xia Zhang,
Yongshi Luo & Guohui Pan Authors * Jiahua Zhang View author publications You can also search for this author inPubMed Google Scholar * Zhendong Hao View author publications You can also
search for this author inPubMed Google Scholar * Jing Li View author publications You can also search for this author inPubMed Google Scholar * Xia Zhang View author publications You can
also search for this author inPubMed Google Scholar * Yongshi Luo View author publications You can also search for this author inPubMed Google Scholar * Guohui Pan View author publications
You can also search for this author inPubMed Google Scholar CORRESPONDING AUTHOR Correspondence to Jiahua Zhang. ADDITIONAL INFORMATION Note: Supplementary information for this article can
be found on the _Light: Science & Applications'_ website. SUPPLEMENTARY INFORMATION SUPPLEMENTARY INFORMATION (DOCX 186 KB) RIGHTS AND PERMISSIONS This work is licensed under a
Creative Commons Attribution 3.0 Unported License. The images or other third party material in this article are included in the article's Creative Commons license, unless indicated
otherwise in the credit line; if the material is not included under the Creative Commons license, users will need to obtain permission from the license holder to reproduce the material. To
view a copy of this license, visit http://creativecommons.org/licenses/by/3.0/ Reprints and permissions ABOUT THIS ARTICLE CITE THIS ARTICLE Zhang, J., Hao, Z., Li, J. _et al._ Observation
of efficient population of the red-emitting state from the green state by non-multiphonon relaxation in the Er3+–Yb3+ system. _Light Sci Appl_ 4, e239 (2015).
https://doi.org/10.1038/lsa.2015.12 Download citation * Received: 04 August 2014 * Revised: 12 November 2014 * Accepted: 18 November 2014 * Published: 16 January 2015 * Issue Date: January
2015 * DOI: https://doi.org/10.1038/lsa.2015.12 SHARE THIS ARTICLE Anyone you share the following link with will be able to read this content: Get shareable link Sorry, a shareable link is
not currently available for this article. Copy to clipboard Provided by the Springer Nature SharedIt content-sharing initiative KEYWORDS * energy transfer * erbium–ytterbium system *
upconversion luminescence