- Select a language for the TTS:
- UK English Female
- UK English Male
- US English Female
- US English Male
- Australian Female
- Australian Male
- Language selected: (auto detect) - EN
Play all audios:
ABSTRACT The Japanese Genetic Research Group for Eating Disorders (JGRED) is a multisite collaborative study group that was organized for the systematic recruitment of patients with an
eating disorder for the purpose of genetic study in Japan. We conducted a genome-wide case–control association study using 23 465 highly polymorphic microsatellite (MS) markers to identify
genomic loci related to anorexia nervosa (AN). Pooled DNA typing in two screening stages, followed by individual typing of 320 AN cases and 341 controls, allowed us to identify 10 MS markers
to be associated with AN. To narrow down genomic regions responsible for the association of these MS markers, we further conducted a single-nucleotide polymorphism (SNP) association
analysis for 7 of the 10 loci in 331 AN cases and 872 controls, which include the 320 AN cases and the 341 controls genotyped in the MS screening, respectively. Two loci, namely 1q41 and
11q22, remained significantly associated with AN in the SNP-based fine mapping, indicating the success in narrowing down susceptibility regions for AN. Neither of these loci showed a
positive evidence of association with bulimia nervosa. The most significant association was observed at SNP rs2048332 (allelic _P_-value=0.00023) located at 3′-downstream of the _SPATA17_
gene on the 1q41 locus. The association analysis for MS-SNP haplotypes detected a statistically significant association (permutation _P_-value=0.00003) of the A-4-G-T haplotype that
comprised four SNP/MS markers (rs6590474–D11S0268i–rs737582–rs7947224) on the 11q22 locus with AN. This linkage disequilibrium block spanning a 20.2-kb interval contains exon 9 of the
_CNTN5_ gene encoding contactin 5. SIMILAR CONTENT BEING VIEWED BY OTHERS GENOME-WIDE COPY NUMBER VARIATION ASSOCIATION STUDY IN ANOREXIA NERVOSA Article Open access 12 November 2024 SINGLE
NUCLEOTIDE POLYMORPHISMS (SNPS) THAT ARE ASSOCIATED WITH OBESITY AND TYPE 2 DIABETES AMONG ASIANS: A SYSTEMATIC REVIEW AND META-ANALYSIS Article Open access 29 August 2024 CHROMOSOMAL
REGIONS STRONGLY ASSOCIATED WITH WAIST CIRCUMFERENCE AND BODY MASS INDEX IN METABOLIC SYNDROME IN A FAMILY-BASED STUDY Article Open access 16 March 2021 INTRODUCTION Eating disorders (EDs)
are psychiatric conditions characterized by severe disturbances in eating behavior, and can be classified into three major types, namely anorexia nervosa (AN), bulimia nervosa (BN) and ED
not otherwise specified. AN and BN are not mutually exclusive conditions as some individuals cross over between both conditions.1, 2 It is generally believed that ED has become more frequent
over recent decades. Fairburn and Harrison3 summarized the prevalence of AN and BN to be 0.7% in teenage girls and 1–2% in 16–35-year-old females, and the incidence (per 100 000 per year)
of AN and BN to be 19 in females and 2 in males, and 29 in females and 1 in males, respectively.3 AN has the highest mortality rate (5–6%) of any psychiatric disease,4 whereas the mortality
rate of BN is reported to be 0.3%.5 The cause of ED is complex and poorly understood. However, the involvement of genetic factors in the etiology of ED has been demonstrated in family and
twin studies.6, 7, 8, 9 Twin studies have estimated the contribution of genetic factors in AN to be between 33 and 84%9 and that in BN to be between 28 and 83%.8 To search for the genetic
etiology of ED, two types of molecular genetic approaches, namely linkage studies and association studies, have been carried out (reviewed in Bulik _et al._10 and Pinheiro _et al._11).
Linkage studies for AN have detected significant linkage at two regions on chromosome 112, 13 and an additional suggestive linkage at a number of loci.13, 14 From the 1p33-p36 region, one of
the regions showing significant linkage to AN,12 serotonin 1D receptor (_HTR1D_) and opioid delta receptor (_OPRD1_) genes were further evaluated and found to exhibit significant
association with AN.15 Linkage analysis of a BN cohort detected significant linkage at 10p13 and a suggestive linkage at 14q22.2-23.1.16 Fine mapping of these regions with
significant/suggestive linkage signals will clarify whether the regions contain gene(s) relevant to AN or BN. Association studies for ED have so far been limited to candidate gene approaches
that focused on the genes, such as those involved in the regulation of feeding and body composition and those implicated in neurotransmitter pathways regulating behavior.10, 11, 17 Although
many association studies performed for ED are considered to be statistically underpowered because of their small sample sizes and/or suffer from multiple testing,10 positive findings on
_HTR1D_, _OPRD1_ and _BDNF_ genes seem promising, as their association with AN/BN has been replicated in more than one study in which relatively large numbers of samples were enrolled
(reviewed in Bulik _et al._10). Completion of the Human Genome Project18 and the rapid progress of the International HapMap Project19 dramatically increased the amount of information on
genetic markers, such as microsatellite (MS) markers and single-nucleotide polymorphisms (SNPs). Consequently, statistical strategies and genotyping platforms for genome-wide association
studies (GWASs) have been established and prevailed as a means of identifying disease susceptibility genes. Disease association studies using MS markers distributed across the human genome
have advantages over linkage analysis and the candidate gene approach. MS markers are highly polymorphic and show a high degree of heterozygosity (∼70% on average), and their linkage
disequilibrium (LD) lengths are in the 100 kb range.20, 21, 22 In this study, we adopted a practical and efficient GWAS strategy for AN using a set of 23 465 MS markers22, 23 and the DNA
pooling method, which has been adopted to identify novel susceptibility genes of rheumatoid arthritis22 and candidate loci for hypertension24 and adult height.23 We identified 10 novel loci
related to AN by the MS marker-based GWAS strategy, and subsequently conducted an SNP-based association analysis for 7 of the 10 loci to further narrow down candidate genomic intervals
responsible for AN susceptibility. MATERIALS AND METHODS SUBJECTS The patients enrolled in this study were recruited through the efforts of the Japanese Genetic Research Group for Eating
Disorders (JGRED), which comprises 67 nation-wide hospitals/institutions (the full list is available in Supplementary Table 1). A total of 456 unrelated Japanese female patients with ED (331
cases with AN and 125 cases with BN) participated in this study. According to the Diagnostic and Statistical Manual of Mental Disorders,25 218 and 113 cases were diagnosed as AN-restricting
type (AN-R) and as AN with binge eating/purging type (AN-BP), respectively. Among the 125 BN cases, 46 had histories of AN and 79 cases did not. The average age at assessment was 23.2±7.91
(s.d.) years for AN-R, 25.7±7.22 years for AN-BP and 26.3±6.77 years for BN. The lifetime minimum body mass index was 12.4±1.90 (s.d.) kg m−2 for AN-R, 12.8±2.67 kg m−2 for AN-BP and
16.2±3.47 kg m−2 for BN. A total of 872 Japanese healthy individuals participated in this study: 180 female individuals whose average age was 34.5 years (control group 1) and 692 male and
female volunteers recruited among university students (control group 2). The average age and gender ratio of control group 2 were unavailable. The ethics committees of all facilities
approved the investigation. All subjects gave their written informed consent before participation in the study. POOLED DNA CONSTRUCTION AND MS GENOTYPING Among the 27 037 MS markers
developed by Tamiya _et al._,22 23 465 (with average spacing 118.0-kb) were used in this study. Detailed information on the 27 037 MS markers is also available at the Japan Biological
Information Research Center website (http://jbirc.jbic.or.jp/gdbs/database/viewer/download/list.jsp). The pooled DNA method for MS typing was performed according to the protocol of Collins
_et al._26 with a slight modification.21 Genomic DNA was extracted from peripheral blood using the Qiagen blood mini kit (Qiagen, Hilden, Germany). DNA concentration was determined using
PicoGreen fluorescence assay (Molecular Probes, Eugene, OR, USA) as described previously.22, 26 The detailed conditions for PCR amplification and peak detection for pooled DNA and individual
genotyping were described previously.22, 24 A total of 320 AN cases and 341 controls were subjected to MS genotyping. The number of subjects for pooled DNA typing was 90 AN-R cases and 90
female controls from control group 1 in the first-stage screening, and another 90 AN-R cases and another 90 female controls from control group 1 in the second-stage screening. The number of
subjects for individual genotyping in the third screening was 140 AN cases (composed of 32 AN-R and 108 AN-BP cases) and 161 controls from control group 2. As the final step of MS screening,
positive markers were subjected to individual genotyping of all 320 AN cases and 341 controls used in the three screening stages. MS markers showing statistical significance (_P_<0.05)
in Fisher's exact test for the 2 × 2 contingency table in the first screening were subjected to the second screening. In the second and third screening stages, besides statistical
significance (_P_<0.1), consistency in the directions of effect of the associated MS allele on AN susceptibility was considered; when the allele holding statistical significance showed
the opposite direction of effect compared with that in the previous screening stage, such a marker was excluded from further analysis. SNP GENOTYPING Single-nucleotide polymorphisms in
candidate regions were selected from the SNP database (http://www2.appliedbiosystems.com/) using SNPbrowser software 3.5 (Applied Biosystems, Foster City, CA, USA). SNPs were genotyped using
TaqMan assays, which were carried out using standard protocols for ABI PRISM 7900HT Sequence Detection Systems (Applied Biosystems). A total of 331 AN cases, 125 BN cases and 872 control
individuals were subjected to SNP genotyping. The 331 AN cases consisted of the 320 cases genotyped in the MS screening and 11 additional cases. The 872 controls consisted of 180 female
controls from control group 1 and 692 controls from control group 2. STATISTICAL ANALYSES Allelic frequencies in pooled DNA genotyping were estimated from the height of peaks measured using
the PickPeak and MultiPeaks programs (Applied Biosystems). To calculate allelic _P_-values from MS genotyping data, we used Fisher's exact test for the 2 × 2 contingency tables for each
individual allele and for the 2 × _m_ contingency tables for each locus, where _m_ refers to the number of marker alleles observed in the genotyped population. The power of each of the
three-stage MS screenings was calculated using a ‘Genetic Power Calculator27 (http://pngu.mgh.harvard.edu/~purcell/gpc/)’ in the AN prevalence rate of 1%. In the three successive screening,
the overall power of the study was 72 and ∼50% for detecting an AN-susceptible allele with a genotype relative risk of 2.0 and 1.8, respectively, under an additive model in log-odds scale
when the susceptible allele (with a frequency of 0.2) and an AN-associated MS marker were in complete LD. For SNP genotyping, disease associations were assessed by the χ2 test mainly using
Haploview 4.0 software (http://www.broad.mit.edu/mpg/haploview/).28 As a multistep analysis was used, nominal _P-_values were corrected with 10 000 iterated permutations for a series of SNPs
selected for each candidate genomic interval. The significance level for SNP association was set at 0.05 throughout the study. Haplotype association analysis (100 000 iterated permutations)
was also performed using Haploview 4.0. LD blocks in each candidate locus were defined using the default algorithm, namely confidence intervals,29 of Haploview 4.0. SNPAlyze v7.0 software
(Dynacom, Mobara, Japan) was used to perform LD calculation, haplotype inference, identification of haplotype-tagging SNP/MS and case–control haplotype analysis (100 000 iterated
permutations) for combined data of MS and SNP genotypes. RESULTS PHASED GENOMIC SCREENS USING DNA POOLS In the first-stage screening, among the 23 465 MS markers subjected to genotyping,
1414 (6.0%) were considered to be statistically significant (_P_<0.05) and were subjected to the next screening stage. In the second-stage screening, among the 1414 markers tested, 158
satisfied our selection criteria: statistical significance (_P_<0.1) and the same direction of allelic effect on AN susceptibility between the first and the second screening results. In
the third screening, among the 158 markers tested, 16 satisfied our selection criteria: statistical significance (_P_<0.1) and the same direction of allelic effect throughout the MS
screening stages. We determined a significance threshold to control false-positive rates (nominal _α_=0.05) in the first stage of MS screening. In the second and third stages, considering
that our sample sizes of cases and controls are not large, we set the significance thresholds (nominal _α_=0.1) to maintain the overall statistical power of the screening. To determine the
definite allele frequencies of the selected 16 MS markers, we performed individual genotyping on all the AN cases (_n_=320) and controls (_n_=341) used in the first to third screenings. Of
the 16 markers, 10 showed a statistically significant difference by Fisher's exact test in the comparison between controls and the AN cohort (Table 1). After correction of multiple
tests with the number of alleles, 7 of 10 markers remained statistically significant (_P_c<0.05). SNP ASSOCIATION ANALYSIS TO NARROW DOWN THE REGIONS RESPONSIBLE FOR AN SUSCEPTIBILITY
From the 10 MS markers that were found to be associated with AN, we selected 7 (shown in bold in Table 1), on the basis of the gene content around each marker, as targets for SNP association
analysis to narrow down disease susceptibility loci. We primarily selected a collection of evenly spaced SNPs (11.1-kb interval on average) within a several 100-kb region surrounding each
candidate MS marker, although it should be noted that intragenic SNPs were preferentially selected from the loci of 1q41 (spermatogenesis associated 17 (_SPATA17_)), 5q15 (_CDH18_) and 18q22
(_NETO1_). The number of SNPs subjected to association analysis and the size and nucleotide positions of the corresponding genomic interval are listed for each locus in Table 2. In total,
we performed genotyping for 333 SNPs on 331 AN cases and 872 controls. Among the 251 SNPs that satisfied thresholds for the Hardy–Weinberg equilibrium (exact test _P_>0.01) and minor
allele frequency (>5%), 24 showed a statistically significant association (nominal _P_<0.05) with the AN cohort (Table 2). For each of the seven loci analyzed, nominal _P_-values were
corrected with 10 000 iterated permutations using Haploview 4.0. In all, 3 SNPs, all of which are located on 1q41, out of the 24 SNPs remained statistically significant (_P_c<0.05)
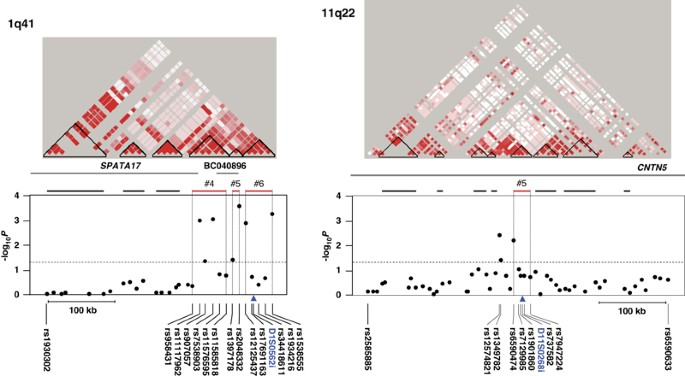
(underlined in Table 2). Subsequently, using Haploview 4.0, we inferred LD block structures for each candidate chromosomal region, and performed a haplotype association analysis (100 000
iterated permutations) for the constructed LD blocks. Significant association (_P_c<0.05) with the AN cohort was detected in three of the six SNP haplotype blocks defined in the 1q41
locus, and in one of the eight blocks defined in the 11q22 locus (Figure 1 and Table 3). 1Q41 A total of 38 SNPs were selected for genotyping within a 337.3-kb interval, including the
AN-associated MS marker D1S0562i. Among 30 SNPs subjected to association analysis, 7 showed a statistically significant association (_P_<0.05) with the AN cohort (Table 2). All the seven
SNPs were located at 3′-downstream of the _SPATA17_ gene (Figure 1, left). SNP rs2048332 showed the most significant association (allelic _P_=0.00023) and was further analyzed under
different genetic models. Association analysis under a recessive model for rs2048332 showed the lowest _P_-value of 0.00015 with the CC genotype, indicating that the CC genotype of rs2048332
has a susceptible effect on the AN phenotype in the Japanese (odds ratio=1.73, confidence interval, 1.30–2.31). Among the three AN-associated haplotype blocks (1q41-#4, #5 and #6 in Figure
1, left and Table 3), 1q41-#5 that comprised two SNPs, namely rs1397178 and rs2048332, spanning a 10.2-kb interval, was found to be most significantly associated (_P_c=0.0039). The
AN-associated MS marker D1S0562i was located in block 1q41-#6, which comprised five SNPs spanning a 38.1-kb interval, and was also associated with AN (_P_c=0.038). Four of the five SNPs
binned to haplotype block 1q41-#6, rs17691163, rs34418611, rs1934216 and rs1538555, were in a relatively strong pairwise LD (_D′_=0.72–0.75) with D1S0562i, whereas the most significant SNP,
rs2048332, in 1q41-#5 block was in modest LD (_D′_=0.46) with it. The four SNPs and D1S0562i (rs17691163–D1S0562i–rs34418611–rs1934216–rs1538555) were selected as tags captured through LD in
block 1q41-#6. These haplotype tags were subjected to an MS-SNP haplotype-based association analysis: one haplotype (G-2-A-T-G), tagged by an AN-associated risk allele of D1S0562i
(Supplementary Table 2), was significantly associated with AN (_P_c=0.0065) (Table 4). This association was comparable with those observed in the SNP-haplotype analysis in two haplotype
blocks 1q41-#5 (_P_c=0.0039) and 1q41-#6 (_P_c=0.038) in terms of statistical significance. 11Q22 A total of 66 SNPs were selected from a 699.8-kb interval surrounding the AN-associated MS
marker D11S0268i. Among the 56 SNPs subjected to association analysis, 3 (rs12574821, rs1349782 and rs6590474) showed a statistically significant association (_P_<0.05) with the AN cohort
(Table 2). These associated SNPs were found to be located in the eighth intron of the _CNTN5_ gene (GenBank accession no. NM_014361). Although these three SNPs did not hold statistical
significance after multiple-testing correction by permutation tests, a haplotype composed of five SNPs (rs6590474, rs7129985, rs1901860, rs737582 and rs7947224) spanning a 20.2-kb interval
showed a statistically significant association with AN (_P_c=0.0082) in the haplotype association analysis (11q22-#5 in Figure 1, right and Table 3). Exon 9 of _CNTN5_ was included in the
20.2-kb interval. The AN-associated MS marker, D11S0268i, was located in the AN-associated 11q22-#5 block. In this block, D11S0268i was in a strong pairwise LD (_D′_=0.81–0.90) with each of
the five SNPs binned to this block. As three SNPs (rs6590474, rs737582 and rs7947224) and D11S0268i were selected as tags captured through LD in the 11q22-#5 block, we further conducted an
MS-SNP haplotype-based association study within the block using these four markers (rs6590474, D11S0268i, rs737582 and rs7947224). As shown in Table 4, the A-4-G-T haplotype was
overrepresented in AN cases with the greatest statistical significance (_P_c=0.00003). This MS-SNP haplotype contained both of the significantly associated risk alleles (A allele and 4) at
SNP rs6590474 (Table 2) and D11S0268i (Supplementary Table 3). ASSESSMENT OF POSSIBLE GENDER EFFECTS IN THE DETECTED ASSOCIATION OF 1Q41 AND 11Q22 WITH AN Owing to the limited number of
female individuals whose age matches with the average age of the AN cases in our control samples, we adopted a population-based control group to search for AN susceptibility loci. Therefore,
although 180 female controls (control group 1, average age: 34.5 years) were genotyped in the first and second stages of MS screening, an additional 692 control individuals enrolled in the
later stages (161 individuals in the third stage of MS screening and all of 692 individuals in the SNP association analysis) consisted of male and female individuals. To assess whether the
detected association of the 1q41 and 11q22 loci to AN was inflated by this partial mismatch in gender between case and control populations, we conducted a stratified analysis for 7 SNPs on
1q41 and for 3 SNPs on 11q22 (Table 2) that showed a significant association with AN. When control group 1 (180 females) and the AN cohort were subjected to association analysis, all 10 SNPs
were detected to be associated (_P_<0.05) with AN (Supplementary Table 4). These results assure that the association of the 1q41 and 11q22 loci with AN detected in this study is not
because of inflation caused by the inclusion of male individuals in the control population. ASSOCIATION ANALYSIS FOR A BN COHORT To assess whether the genomic intervals identified to be
associated with AN in this study are also involved in the genetic etiology of BN, we conducted an SNP association analysis for BN cases and controls. The 7 SNPs from the 1q41 locus and the 3
SNPs from the 11q22 locus, which showed a statistically significant association (_P_<0.05) with AN before multiple-testing correction, were subjected to SNP genotyping on the cohort of
125 BN cases. None of the 10 SNPs showed a statistically significant association with BN (data not shown). DISCUSSION We have completed a genome-wide association analysis for AN using 23 465
MS markers. To our knowledge, this is the first GWAS performed for EDs. Among the 10 candidate loci we identified, 9 are reported to be associated with AN for the first time in this study.
Only one locus, D1S0016i on 1p36, overlaps with the chromosomal region of 1p33-p36 that has already been reported to show significant linkage to AN.12 Through an SNP association analysis for
the seven selected candidate regions to narrow down genomic intervals involved with AN susceptibility, we tentatively identified a 10.2-kb genomic interval (the haplotype block 1q41-#5)
located at 3′-downstream of the _SPATA17_ gene as a region associated with AN. The MS-SNP haplotype-based association analysis also indicated the association of haplotype block 1q41-#6 with
AN with a similar statistical significance. _SPATA17_ encodes a 361 amino-acid protein that contains three highly conserved IQ motifs and is strongly expressed in the testis.30 It is unknown
whether the SPATA17 protein has any physiological roles in neuronal tissues. It should be noted that the 10.2-kb critical interval coincides with the exon–intron structure of the
uncharacterized mRNA sequence BC040896, which is derived from a cDNA library made from brain (adult medulla) RNA. Another genomic region identified to be associated with AN in this study is
a 20.2-kb interval (the haplotype block 11q22-#5), spanning from the eighth to the ninth intron of the _CNTN5_ gene on 11q22. Furthermore, we found that one MS-SNP haplotype (A-4-G-T), which
includes two AN-associated risk alleles at SNP rs6590474 and MS D11S0268i, was significantly overrepresented in AN cases. _CNTN5_ encodes a member of the contactin family known to function
during the formation of neuronal interactions. It is reported that the mouse line deficient of _Cntn1_, another member of the contactin family, exhibits an ataxic and anorectic phenotype.31,
32 In human adult tissues examined using northern blot analysis, _CNTN5_ has been shown to be predominantly expressed in the brain and thyroid.33 In various regions of an adult brain
examined, the gene was found to be expressed with highest levels in the occipital lobe and amygdala, followed by the cerebral cortex, frontal lobe, thalamus and temporal lobe.33 Although
neuronal activity in the auditory system is reported to be impaired in the mouse line deficient for _Cntn5_, no anorexic phenotype has been described.34 Although causative SNPs are not yet
determined, we have successfully mapped genetic association with AN to at least two genomic regions on 1q41 and 11q22 and narrowed down an AN-associated genomic interval for each locus by
haplotype association analysis. Further replication analysis using independent patient/control populations for AN-associated SNPs and functional analyses for the genes or for particular
genomic regions in these loci will better clarify the impact of these SNPs/genes in the genetic etiology of AN. It should also be noted that additional common variants are likely to have
roles in the development of AN because this study was not well powered to detect susceptible loci with relatively small genetic risks. Additional gender/age-matched cohorts consisting of
much larger numbers of cases and controls need to be used to improve statistical power in MS-based genome-wide association analysis. ACCESSION CODES ACCESSIONS GENBANK/EMBL/DDBJ * NM_014361
REFERENCES * Tozzi, F., Thornton, L. M., Klump, K. L., Fichter, M. M., Halmi, K. A., Kaplan, A. S. _et al_. Symptom fluctuation in eating disorders: correlates of diagnostic crossover. _Am.
J. Psychiatry_ 162, 732–740 (2005). Article Google Scholar * Nishimura, H., Komaki, G., Ando, T., Nakahara, T., Oka, T., Kawai, K. _et al_. Japanese Genetic Research Group for Eating
Disorders. Psychological and weight-related characteristics of patients with anorexia nervosa-restricting type who later develop bulimia nervosa. _Biopsychosoc. Med._ 2, 5 (2008). Article
Google Scholar * Fairburn, C. G., Harrison, P. J. Eating disorders. _Lancet_ 361, 407–416 (2003). Article Google Scholar * Birmingham, C. L., Su, J., Hlynsky, J. A., Goldner, E. M., Gao,
M. The mortality rate from anorexia nervosa. _Int. J. Eat. Disord._ 38, 143–146 (2005). Article Google Scholar * Keel, P. K., Mitchell, J. E. Outcome in bulimia nervosa. _Am. J.
Psychiatry_ 154, 313–321 (1997). Article CAS Google Scholar * Lilenfeld, L. R., Kaye, W. H., Greeno, C. G., Merikangas, K. R., Plotnicov, K., Pollice, C. _et al_. A controlled family
study of anorexia nervosa and bulimia nervosa: psychiatric disorders in first-degree relatives and effects of proband comorbidity. _Arch. Gen. Psychiatry_ 55, 603–610 (1998). Article CAS
Google Scholar * Strober, M., Freeman, R., Lampert, C., Diamond, J., Kaye, W. Controlled family study of anorexia nervosa and bulimia nervosa: evidence of shared liability and transmission
of partial syndromes. _Am. J. Psychiatry_ 157, 393–401 (2000). Article CAS Google Scholar * Bulik, C. M., Sullivan, P. F., Wade, T. D., Kendler, K. S. Twin studies of eating disorders: a
review. _Int. J. Eat. Disord._ 27, 1–20 (2000). Article CAS Google Scholar * Wade, T. D., Bulik, C. M., Neale, M., Kendler, K. S. Anorexia nervosa and major depression: shared genetic and
environmental risk factors. _Am. J. Psychiatry_ 157, 469–471 (2000). Article CAS Google Scholar * Bulik, C. M., Slof-Op't Landt, M. C., van Furth, E. F., Sullivan, P. F. The
genetics of anorexia nervosa. _Annu. Rev. Nutr._ 27, 263–275 (2007). Article CAS Google Scholar * Pinheiro, A. P., Sullivan, P. F., Bacaltchuck, J., Prado-Lima, P. A., Bulik, C. M.
Genetics in eating disorders: extending the boundaries of research. _Rev. Bras. Psiquiatr._ 28, 218–225 (2006). Article Google Scholar * Grice, D. E., Halmi, K. A., Fichter, M. M.,
Strober, M., Woodside, D. B., Treasure, J. T. _et al_. Evidence for a susceptibility gene for anorexia nervosa on chromosome 1. _Am. J. Hum. Genet._ 70, 787–792 (2002). Article CAS Google
Scholar * Devlin, B., Bacanu, S. A., Klump, K. L., Bulik, C. M., Fichter, M. M., Halmi, K. A. _et al_. Linkage analysis of anorexia nervosa incorporating behavioral covariates. _Hum. Mol.
Genet._ 11, 689–696 (2002). Article CAS Google Scholar * Bacanu, S. A., Bulik, C. M., Klump, K. L., Fichter, M. M., Halmi, K. A., Keel, P. _et al_. Linkage analysis of anorexia and
bulimia nervosa cohorts using selected behavioral phenotypes as quantitative traits or covariates. _Am. J. Med. Genet. B. Neuropsychiatr. Genet._ 139, 61–68 (2005). Article Google Scholar
* Bergen, A. W., van den Bree, M. B., Yeager, M., Welch, R., Ganjei, J. K., Haque, K. _et al_. Candidate genes for anorexia nervosa in the 1p33-36 linkage region: serotonin 1D and delta
opioid receptor loci exhibit significant association to anorexia nervosa. _Mol. Psychiatry_ 8, 397–406 (2003). Article CAS Google Scholar * Bulik, C. M., Devlin, B., Bacanu, S. A.,
Thornton, L., Klump, K. L., Fichter, M. M. _et al_. Significant linkage on chromosome 10p in families with bulimia nervosa. _Am. J. Hum. Genet._ 72, 200–207 (2003). Article CAS Google
Scholar * Klump, K. L., Gobrogge, K. L. A review and primer of molecular genetic studies of anorexia nervosa. _Int. J. Eat. Disord._ 37, S43–S48 (2005). Article Google Scholar *
International Human Genome Sequencing Consortium. Finishing the euchromatic sequence of the human genome. _Nature_ 431, 931–945 (2004). Article Google Scholar * International HapMap
Consortium. A second generation human haplotype map of over 3.1 million SNPs. _Nature_ 449, 851–861 (2007). Article Google Scholar * Oka, A., Tamiya, G., Tomizawa, M., Ota, M., Katsuyama,
Y., Makino, S. _et al_. Association analysis using refined microsatellite markers localizes a susceptibility locus for psoriasis vulgaris within a 111 kb segment telomeric to the HLA-C gene.
_Hum. Mol. Genet._ 8, 2165–2170 (1999). Article CAS Google Scholar * Oka, A., Hayashi, H., Tomizawa, M., Okamoto, K., Suyun, L., Hui, J. _et al_. Localization of a non-melanoma skin
cancer susceptibility region within the major histocompatibility complex by association analysis using microsatellite markers. _Tissue Antigens_ 61, 203–210 (2003). Article CAS Google
Scholar * Tamiya, G., Shinya, M., Imanishi, T., Ikuta, T., Makino, S., Okamoto, K. _et al_. Whole genome association study of rheumatoid arthritis using 27 039 microsatellites. _Hum. Mol.
Genet._ 14, 2305–2321 (2005). Article CAS Google Scholar * Kimura, T., Kobayashi, T., Munkhbat, B., Oyungerel, G., Bilegtsaikhan, T., Anar, D. _et al_. Genome-wide association analysis
with selective genotyping identifies candidate loci for adult height at 8q21.13 and 15q22.33-q23 in Mongolians. _Hum. Genet._ 123, 655–660 (2008). Article CAS Google Scholar * Yatsu, K.,
Mizuki, N., Hirawa, N., Oka, A., Itoh, N., Yamane, T. _et al_. High-resolution mapping for essential hypertension using microsatellite markers. _Hypertension_ 49, 446–452 (2007). Article
CAS Google Scholar * American Psychiatric Association. _Diagnostic and Statistical Manual of Mental Disorders_, 4th edn. (American Psychiatric Association: Washington, DC, 1994). *
Collins, H. E., Li, H., Inda, S. E., Anderson, J., Laiho, K., Tuomilehto, J. _et al_. A simple and accurate method for determination of microsatellite total allele content differences
between DNA pools. _Hum. Genet._ 106, 218–226 (2000). Article CAS Google Scholar * Purcell, S., Cherny, S. S., Sham, P. C. Genetic Power Calculator: design of linkage and association
genetic mapping studies of complex traits. _Bioinformatics_ 19, 149–150 (2003). Article CAS Google Scholar * Barrett, J. C., Fry, B., Maller, J., Daly, M. J. Haploview: analysis and
visualization of LD and haplotype maps. _Bioinformatics_ 21, 263–265 (2005). Article CAS Google Scholar * Gabriel, S. B., Schaffner, S. F., Nguyen, H., Moore, J. M., Roy, J., Blumenstiel,
B. _et al_. The structure of haplotype blocks in the human genome. _Science_ 296, 2225–2229 (2002). Article CAS Google Scholar * Deng, Y., Hu, LS., Lu, GX. Expression and identification
of a novel apoptosis gene Spata17 (MSRG-11) in mouse spermatogenic cells. _Acta. Biochim. Biophys. Sin. (Shanghai)_ 38, 37–45 (2006). Article CAS Google Scholar * Johansen, J. E.,
Fetissov, S. O., Bergström, U., Nilsson, I., Faÿ, C., Ranscht, B. _et al_. Evidence for hypothalamic dysregulation in mouse models of anorexia as well as in humans. _Physiol. Behav._ 92,
278–282 (2007). Article CAS Google Scholar * Fetissov, S. O., Bergström, U., Johansen, J. E., Hökfelt, T., Schalling, M., Ranscht, B. Alterations of arcuate nucleus neuropeptidergic
development in contactin-deficient mice: comparison with anorexia and food-deprived mice. _Eur. J. Neurosci._ 22, 3217–3228 (2005). Article Google Scholar * Kamei, Y., Takeda, Y.,
Teramoto, K., Tsutsumi, O., Taketani, Y., Watanabe, K. Human NB-2 of the contactin subgroup molecules: chromosomal localization of the gene (CNTN5) and distinct expression pattern from other
subgroup members. _Genomics_ 69, 113–119 (2000). Article CAS Google Scholar * Li, H., Takeda, Y., Niki, H., Ogawa, J., Kobayashi, S., Kai, N. _et al_. Aberrant responses to acoustic
stimuli in mice deficient for neural recognition molecule NB-2. _Eur. J. Neurosci._ 17, 929–936 (2003). Article Google Scholar Download references ACKNOWLEDGEMENTS This study was performed
under the management of the Japan Biological Informatics Consortium (JBIC) and was supported by grants from the New Energy and Industrial Technology Development Organization (NEDO). This
study was also supported by Grant-in-Aid for Scientific Research on Priority Areas from MEXT, and by Grant-in-Aid for Young Scientists (B) from JSPS. We thank Karin Ohki for her technical
assistance. AUTHOR INFORMATION Author notes * Kazuhiko Nakabayashi Present address: 7Current address: Department of Maternal-Fetal Biology, National Research Institute for Child Health and
Development, 2-10-1 Okura, Setagaya, Tokyo 157-8535, Japan, AUTHORS AND AFFILIATIONS * Department of Pathology, Research Institute, International Medical Center of Japan, Shinjuku, Tokyo,
Japan Kazuhiko Nakabayashi, Mayuko Ishikawa & Junko Nomoto * Department of Cell Biology, Faculty of Medicine, Fukuoka University, Jonan, Fukuoka, Japan Kazuhiko Nakabayashi & Senji
Shirasawa * Department of Psychosomatic Research, National Institute of Mental Health, National Center of Neurology and Psychiatry, Ogawahigashicho, Kodaira, Japan Gen Komaki & Tetsuya
Ando * Department of Molecular Life Science, Tokai University School of Medicine, Isehara, Japan Atsushi Tajima, Akira Oka & Hidetoshi Inoko * Department of Maternal-Fetal Biology,
National Research Institute for Child Health and Development, Setagaya, Tokyo, Japan Kenichiro Hata * International Medical Center of Japan, Shinjuku, Tokyo, Japan Takehiko Sasazuki Authors
* Kazuhiko Nakabayashi View author publications You can also search for this author inPubMed Google Scholar * Gen Komaki View author publications You can also search for this author inPubMed
Google Scholar * Atsushi Tajima View author publications You can also search for this author inPubMed Google Scholar * Tetsuya Ando View author publications You can also search for this
author inPubMed Google Scholar * Mayuko Ishikawa View author publications You can also search for this author inPubMed Google Scholar * Junko Nomoto View author publications You can also
search for this author inPubMed Google Scholar * Kenichiro Hata View author publications You can also search for this author inPubMed Google Scholar * Akira Oka View author publications You
can also search for this author inPubMed Google Scholar * Hidetoshi Inoko View author publications You can also search for this author inPubMed Google Scholar * Takehiko Sasazuki View author
publications You can also search for this author inPubMed Google Scholar * Senji Shirasawa View author publications You can also search for this author inPubMed Google Scholar CONSORTIA
JAPANESE GENETIC RESEARCH GROUP FOR EATING DISORDERS (JGRED) CORRESPONDING AUTHOR Correspondence to Kazuhiko Nakabayashi. ADDITIONAL INFORMATION Supplementary Information accompanies the
paper on Journal of Human Genetics website (http://www.nature.com/jhg) SUPPLEMENTARY INFORMATION SUPPLEMENTARY INFORMATION (XLS 47 KB) RIGHTS AND PERMISSIONS Reprints and permissions ABOUT
THIS ARTICLE CITE THIS ARTICLE Nakabayashi, K., Komaki, G., Tajima, A. _et al._ Identification of novel candidate loci for anorexia nervosa at 1q41 and 11q22 in Japanese by a genome-wide
association analysis with microsatellite markers. _J Hum Genet_ 54, 531–537 (2009). https://doi.org/10.1038/jhg.2009.74 Download citation * Received: 15 April 2009 * Revised: 02 July 2009 *
Accepted: 15 July 2009 * Published: 14 August 2009 * Issue Date: September 2009 * DOI: https://doi.org/10.1038/jhg.2009.74 SHARE THIS ARTICLE Anyone you share the following link with will be
able to read this content: Get shareable link Sorry, a shareable link is not currently available for this article. Copy to clipboard Provided by the Springer Nature SharedIt content-sharing
initiative KEYWORDS * anorexia nervosa * bulimia nervosa * eating disorders * genome-wide association study * microsatellite markers * SNPs